Francesco Prati, Flavio Giuseppe Biccirè
Stents and scaffolds
Updated on May 13, 2021
Optical coherence tomography (OCT) is a light-based imaging modality which shows tremendous potential in the setting of coronary imaging. Compared to intravascular ultrasound (IVUS), OCT has a ten-fold higher image resolution. OCT is able to characterise the structure and extent of coronary artery disease in unprecedented detail as the various components of atherosclerotic plaques have different optical properties. Typically, calcified, fibrous and lipid-rich plaque components can be distinguished, as well as the presence of dense macrophage infiltration, neovascularisation and mural or intraluminal thrombi. These diagnostic capabilities are being applied to study patients with coronary artery disease (CAD), especially acute coronary syndrome (ACS) and ST-elevation myocardial infarction (STEMI), to improve our understanding of the pathophysiology and progression of atherosclerosis. In patients with ACS, the use of OCT has emerged as instrumental in recognising and characterising the lesions responsible for the acute event, as well as in identifying the atherosclerotic plaque composition of non-culprit lesions. Several studies have also shed light on the role of OCT as an instrumental tool for studying the severity and extension of calcific components and for selecting the most appropriate interventional device to perform PCI in such complex lesions. Likewise, OCT allows the detailed analysis of coronary stents, their interaction with the vessel wall and their long-term outcome. Consequently, OCT is particularly effective in daily practice to guide complex interventions, as the use of this tool can change the operator's idea of how to treat the vessel and modify the overall revascularisation strategy. Large prospective registries and recent randomised trials have confirmed the efficacy of OCT in improving stent placement, and ultimately, the clinical outcome of patients undergoing PCI, as stated in the latest guidelines of the European Society of Cardiology, which recommend its use to guide PCI with a class IA indication. Overall, these data indicate that OCT is now a key tool that dramatically improves the understanding, management and outcome of patients with CAD and should therefore be considered a mandatory modality in the armamentarium of a contemporary catheterisation laboratory.
Optical coherence tomography (OCT) is a light-based imaging modality which shows tremendous potential in understanding the coronary circulation. Compared to intravascular ultrasound (IVUS), OCT has a ten-fold higher image resolution given the use of near-infrared light rather than sound in the megahertz range. This advantage has seen OCT successfully applied to assess coronary atherosclerosis, stent apposition and tissue coverage, introducing a new era in intravascular coronary imaging.
The origins of OCT date back to 1990. David Huang was in his fourth year of an MD-PhD programme at Massachusetts Institute of Technology (MIT). He had been studying optical coherence domain reflectometry (OCDR) to perform ranging measurements in the eye . The central problem in making tomographic images using light was developing a technique which would permit reflections from various depths to be measured and recorded in a fashion analogous to ultrasonic imaging. In the case of sound, electronic circuits are fast enough to separate the echoes from structures which are within the resolution cell of the ultrasonic transducer. In the case of light, an interferometer has to be employed to overcome measurement difficulties caused by the speed of light which is much faster than the speed of sound.
Therefore, the intracoronary application of OCT has slowly but steadily increased over the last decade, with a commercially available system for clinical use (Abbott Westford, MA, USA; Terumo Japan, and Gentuity, LLC, Suite G Sudbury, MA) being approved in Europe, Japan and the USA. The technology advances from “time-domain OCT” to “Fourier-domain OCT” enabled widespread applications of intracoronary technology in research and patient care. The chapter will discuss the technical principles of intracoronary OCT and summarise the results obtained in the research and clinical setting.
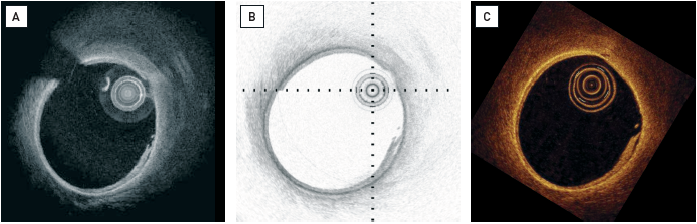
The principle of OCT is analogous to pulse-echo ultrasound imaging, except that light, rather than sound, is used to create the image. Whereas ultrasound produces images from backscattered sound “echoes”, OCT uses infrared light waves which reflect off the internal microstructure within the biological tissues. The use of near-infrared light allows a ten-fold higher image resolution (Figure 1); however, this is at the expense of a reduced penetration depth and the need to create a blood-free environment for imaging. In coronary arteries, blood (namely red blood cells) is, in effect, a non-transparent tissue, causing multiple scattering and substantial signal attenuation. As a consequence, blood must be displaced during OCT imaging.
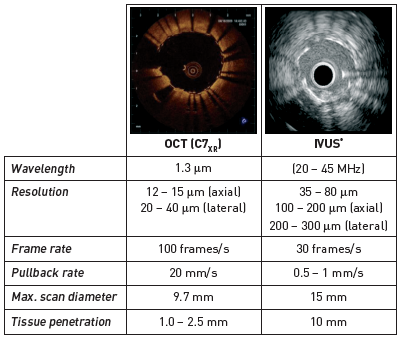
OCT utilises a near-infrared light source (approximately 1,300 nm wavelength) in combination with advanced fibre optics to create a dataset of the coronary artery. Both the bandwidth of the infrared light used, and the wave velocity, are orders of magnitude higher than in medical ultrasound. The resulting resolution depends primarily on the ratio of these parameters and is one order of magnitude larger than that of IVUS; the axial resolution of OCT is about 15 μm. The lateral resolution is mainly determined by the imaging optics in the catheter and is approximately 25 μm. The imaging depth of approximately 1.0-1.5 mm within the coronary artery wall is limited by the attenuation of light in the tissue. Analogous to ultrasound imaging, the echo time-delay of the emitted light is used to generate spatial image information: the intensity of the received (reflected or scattered) light is translated into a (false) colour scale. As the speed of light is faster than that of sound, an interferometer is required to measure the backscattered light . The interferometer splits the light source into two “arms” – a reference arm and a sample arm, which is directed into the tissue. The light from both arms is recombined at a detector, which registers the so-called interferogram, the sum of reference and sample arm fields. Because of the large source bandwidth, the interferogram is non-zero only if the sample and reference arms are of equal length within a small window equal to the coherence length of the light source , .
Time-domain OCT was replaced by a new generation of OCT systems, Fourier-domain OCT, in 2008 due to slow data acquisition and the need to clear the artery of blood during image acquisition . Fourier-domain OCT operates in the frequency (rather than time) domain, and is also called Fourier-domain (Figure 2). The interferogram is detected as a function of wavelength, either by using a broadband source as in time-domain systems, and spectrally resolved detection, or, alternatively, by incorporating a novel wavelength-swept laser source , . This latter technique is also called “swept-source OCT”, or optical frequency domain imaging (OFDI), and capitalises most effectively on the higher sensitivity and lower signal-to-noise ratio offered by Fourier-domain detection. This development has led to faster image acquisition speeds with greater penetration depth, without loss of vital detail or resolution, and represents a great advancement on current conventional OCT systems.
In a Fourier-domain OCT system, the wavelength range of the sweep determines the resolution of the image, while the imaging depth is inversely related to the instantaneous spectral width of the source. The increased sensitivity of Fourier-domain OCT also allows for deeper images. The attenuation of light by the tissue is the same for time-domain and for Fourier-domain OCT, but the lower noise of the latter makes it possible to discern weaker signals which would be indistinguishable from the background noise in time-domain OCT. Clinically, this advantage enables the assessment of coronary microstructures, well beyond the arterial-lumen border. .
Fourier-domain OCT systems produce images much faster than standard video frame rate, so recorded data have to be replayed for inspection by the operator. Currently, OCT systems scan 200-500 angles per revolution (frame), and 5-10 images per mm in a pullback. If these parameters are maintained with high-speed systems, 20 mm/sec (or higher) pullback speeds are possible at the same sampling density as conventional (time-domain) OCT data. The high scan speeds have been employed for real-time volumetric imaging of dynamic phenomena including fast pullbacks for intracoronary imaging with minimal ischaemia, and retinal scans with minimal motion artifacts . Three-dimensional rendering of volumes becomes possible if motion during the scan is limited.
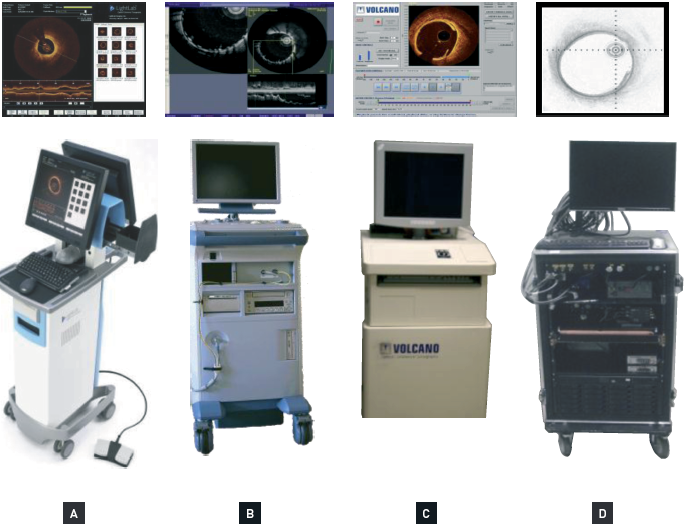
The equipment for intracoronary OCT generally consists of an OCT imaging catheter, a motorised pullback device and an imaging console, which contains the light source, signal processing units, data storage and display . The imaging catheter is part of the sample arm of the interferometer described above. The optical signal is transmitted by a single-mode fibre, which is fitted with an integrated lens microprism assembly to focus the beam and direct it towards the tissue. The focus is approximately 1 mm outside the catheter. In order to scan the vessel lengthwise, the catheter imaging tip is pulled back while being rotated, usually inside a transparent sheath, allowing it to collect a three-dimensional dataset of the coronary artery. Both the rotary and pullback motion are driven proximally by a motor outside the patient. We will describe the currently commercially available equipment for Fourier-domain OCT and the imaging procedure in detail. As many early studies of intracoronary OCT employed time-domain OCT, we also summarise the equipment and imaging procedure for time-domain OCT.
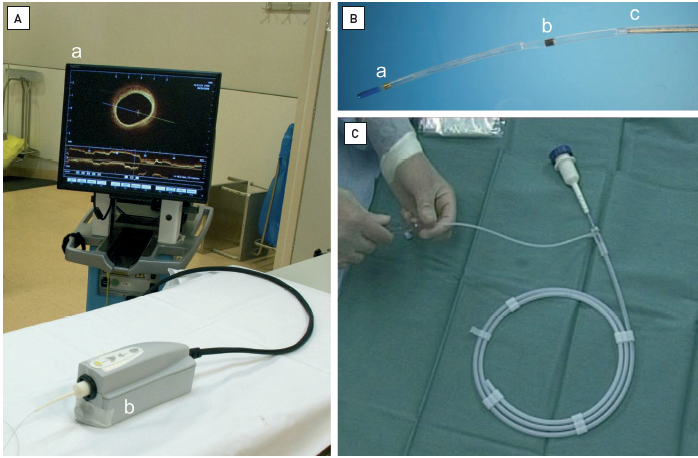
Currently, there are three commercially available Fourier-domain OCT systems: the Dragonfly (Abbott Vascular, Santa Clara, USA), the Fastview catheter (Terumo, Japan) (Figure 3) and Gentuity (Sudbury, MA, USA). The optical probe consists of a short monorail catheter (Dragonfly, 2.7 French; Fastview, 2.6 French; Gentuity, 1.8 French) that can be advanced in the coronary artery over any conventional 0.014” guidewire and is compatible with 6 Fr guiding catheters. The usable length is around 140 cm.
The OCT imaging catheter is advanced using the monorail technique distally into the coronary artery via a standard angioplasty guidewire (0.014”). Care should be taken to position the guide catheter coaxially and deep into the coronary ostium. The correct guide catheter position can be confirmed by manual injection of a small flush bolus through the guide catheter prior to imaging (if needed). During automated OCT pullback (pullback speed is typically in the range of 20 mm/sec to 40 mm/sec) blood needs to be cleared from the lumen by injection of a flush solution through the guide catheter, applying a non-occlusive technique that was set up for the time-domain probe . A variety of solutions are being used as flush media, including viscous iso-osmolar contrast media, and mixtures of lactated Ringer’s solution and contrast media or low molecular weight dextran. The flush injection can be performed manually, with assist systems or by using a power injector. Usually, an iso-osmolar contrast medium at room temperature is used via a power injection at a rate of 3 ml/sec or 4 ml/sec through the guide catheter, depending on the vessel diameter. Flushing should be terminated when the region of interest has been imaged, when the OCT catheter optics enter the guide catheter, or in the case of any complications.
In the field of interventional cardiology, the integration of OCT with angiographic coregistration represents a significant advancement in the precision of percutaneous coronary interventions (PCI). This technique enhances the visualisation of plaque morphology and critical lesion characteristics, essential for strategic decision-making during PCI. For instance, it facilitates the accurate measurement of lesion dimensions, optimal stent sizing, and precise placement, addressing challenges like stent underexpansion and malapposition that might not be visible on angiography alone. Additionally, in the latest iteration of the OCT software UltreonTM (Abbott Vascular, Santa Clara, USA), a dynamic angio view is provided next to the co-registration view to enable operators to precisely place the stent according to proximal and distal vessel references set at the OCT analysis.
In a recent study, Kadavil et al evaluate the real-time application of OCT with angiographic coregistration (OCT-ACR) in clinical settings. The study found that preprocedural OCT adjustments affected the PCI strategy in 80% of lesions, influencing decisions on lesion preparation (25%), stent length (53%), stent diameter (36%), and device landing zone (61%). Furthermore, OCT-ACR altered treatment strategies in 34% of cases, demonstrating its significant impact on clinical decision-making . This synergistic approach not only improves procedural accuracy but also contributes to better clinical outcomes by ensuring that interventions are tailored to the specific pathology observed, thereby enhancing the safety and efficacy of the treatments provided. The process involves real-time mapping of OCT images onto the corresponding angiographic images, creating a detailed and dynamic visual guide that aids clinicians in navigating complex anatomical sites and to make informed procedural choices .
Similar to other diagnostic coronary instrumentation, such as fractional flow reserve or IVUS, patients should be anticoagulated, typically with heparin, before inserting the guidewire into the coronary artery. The OCT catheter should preferably only be introduced into the coronary artery after the administration of intracoronary nitroglycerine, to minimise the potential for catheter-induced vasospasm.
In principle, all epicardial coronary arteries, venous or arterial grafts accessible to a guiding catheter are eligible for OCT imaging.
Considerations regarding anatomy and patient characteristics arise (a) from the fact that OCT imaging requires a blood-free environment, and (b) from the OCT catheter design . As the imaging procedure demands temporary blood removal and flush (e.g., lactated Ringer’s or x-ray contrast medium), it should be performed with caution in patients with severely impaired left ventricular function, those who are haemodynamically compromised or those with markedly impaired renal function. Ostial and proximal lesions cannot be adequately imaged using proximal balloon occlusion and thus a non-occlusive technique may be preferred in these circumstances. Large calibre vessels or very tortuous vessels often preclude complete circumferential imaging as a result of a non-central, non-coaxial position of the OCT imaging probe within the vessel.
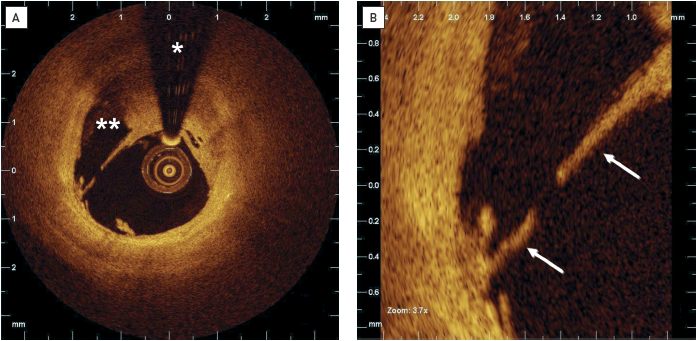
OCT has the ability to characterise the structure and extent of coronary artery disease in unprecedented detail (Figure 4). OCT images can be interpreted by visual assessment of the signal intensity and geometry , , , , , , , , , as various components of atherosclerotic plaques have different optical properties (Figure 5). Attenuation and backscatter affect the received signal intensity and penetration depth into the tissue. OCT signal intensity is displayed using a false colour map. A popular colour map is the “sepia” scale, ranging from black (low OCT signal) through to brown, yellow and white (high OCT signal); alternatively, grey scale (low is black, high is white), or inverted grey scale maps are also being used (Figure 6). The depth of penetration is greatest for fibrous tissue and least for thrombi, with calcium and lipid tissue having intermediate values , , , , , , , , , . Correct identification of plaque components by OCT depends on the penetration depth of the incident light beam into the vessel wall.
The normal coronary artery wall appears as a three-layer structure by OCT. The media is seen as a dark band delineated by the internal elastic lamina and external elastic lamina. As the mean media thickness is 200 μm, it can easily be visualised by OCT , , , , . In the presence of vessel remodelling (where there is an expansion of the vessel wall at the sites of plaque accumulation) the media typically becomes thinner. Unfortunately, because of its limited tissue penetration (1-1.5 mm) OCT is not suited to study vessel remodelling, as often the presence of atherosclerotic vessel wall thickening obscures visualisation of the media.
A normal intima consists of a thin subendothelial collagen layer covered towards the lumen by a single layer of endothelial cells. This normal anatomical structure is beyond the resolution of OCT. However, OCT can detect early stages of intimal thickening, depicted as a signal-rich, homogeneous, thin rim of tissue. Thus, OCT can confirm the absence of significant atherosclerosis or indicate the degree of subclinical atherosclerotic lesion formation. Serial measurements can be performed to monitor the structural changes that occur in the vessel wall over time, particularly fibrous cap thickness (FCT), lipid arc and macrophage arc in degrees. This information is key in the study of the natural history of coronary atherosclerosis and the effect of different therapies on the regression/progression of the incipient plaque , , , , , , , , .
These are typically rich in collagen or muscle cells and have a homogeneous OCT signal with high backscatter and low attenuation, resulting in a bright, signal-intense appearance.
These occur within plaques and are identified by the presence of well-delineated, low-backscattering, signal-poor heterogeneous regions. In general, superficial calcium deposits can be studied and measured by OCT unless their thickness is greater than 1.0-1.5 mm whereupon the penetration limit of OCT is reached. Signal-poor calcifications might be confused with signal-poor lipid-rich tissue , , , , .
Calcified nodules (CNs) are appreciated on OCT as intraluminal calcium protrusions with or without disruption of the intimal fibrous layer. CNs are categorised into two pathology varieties: without (smooth CN) and with disruption (disrupted CN). The latter is now an established feature of plaque vulnerability in the coronary region and is responsible for about 5% of ACS , .
These are less well delineated than calcifications, appearing as diffusely bordered, signal-poor regions with overlying signal-rich bands, corresponding to fibrous caps. Some authors have reported a higher sensitivity and specificity of OCT for lipid-rich plaque detection when comparing OCT, IVUS and IVUS-derived techniques for plaque composition analysis , , , , . In the majority of cases, the thickness of the lipid-rich plaque component cannot be measured by OCT because the penetration depth is insufficient. However, the thickness of the fibrous cap covering superficial lipid towards the lumen can be measured accurately , . Pathological studies of plaques leading to cardiac death and acute myocardial infarction have established 65 μm as the threshold of fibrous cap thickness which best identifies thin, vulnerable caps with a propensity to rupture and to cause coronary thrombosis. However, some studies of plaque vulnerability have applied different cut-offs . The thickness of the fibrous cap is not homogeneous throughout the plaque and its three-dimensional longitudinal distribution should not be ignored . The size of a lipid necrotic-rich plaque can be graded semi-quantitatively according to the number of involved quadrants on the cross-sectional OCT images; necrotic lipid pools can be classified as absent or subtending 1, 2, 3 or 4 quadrants , .
Lipid pools may be misclassified on OCT. Calcium deposits appear signal-poor on OCT, as do lipid-rich tissues; however, these two tissue types can be discriminated in most cases by the tissue borders. In fact, the outer borders of calcium are typically sharp and well-delineated, whereas lipid shows poorly defined borders with diffuse transition to the surrounding tissue. Furthermore, superficial cells (particularly macrophages) may cause a marked signal attenuation that may be confused with the fibrous cap fibroatheroma , , , , .
Past studies on the use of the optical attenuation coefficient (μt) have improved the OCT identification of different tissue types including necrotic core, calcium, macrophage presence and fibrous tissue , .
These are identified as masses protruding into the vessel lumen, frequently discontinuous from the surface of the vessel wall. Red thrombi consist mainly of red blood cells. OCT images are characterised as high-backscattering protrusions with signal-free shadowing. White thrombi consist mainly of platelets and white blood cells and are characterised by signal-rich, low-backscattering billowing projections protruding into the lumen , , , . In reality, pure white or red thrombi are rarely found. The aspect of thrombus on OCT changes over time. The irregular inner border of a thrombus in the acute phase evolves to a homogeneous and smooth profile in the following weeks . The identification of fresh thrombi is key for diagnosing acute coronary syndromes. Thrombi are frequently found within culprit lesions of patients with acute coronary syndromes , . A fresh or large thrombus may hamper the visualisation of plaque features such as ulceration beneath the thrombus itself. To solve this problem, when thrombus is present, OCT cross-sections acquired within the coronary segment with thrombus should be searched one by one for sites where vessel wall and plaque morphology can be seen.
Macrophages are seen by OCT as signal-rich, distinct or confluent punctate dots which exceed the intensity of background speckle noise. Macrophages may often be seen at the boundary between the bottom of the cap and the top of a necrotic core , . Cholesterol crystals on OCT may appear as thin, linear regions of high intensity, usually associated with a fibrous cap or necrotic core. Differential diagnosis with macrophages may be difficult . Generally, good inter- and intra-observer agreement for visual plaque characterisation have been reported . Recent studies have shown good reproducibility for measurements of OCT features, including macrophage circumferential extension and superficiality (distance to the lumen) . (Neo) vessels within the intima appear as signal-poor voids which are sharply delineated and usually contiguous and seen on multiple frames , , .
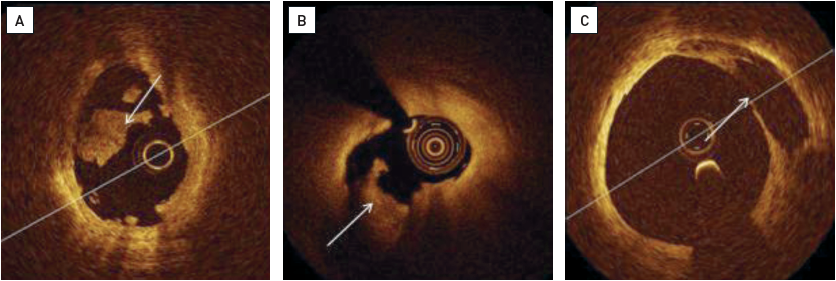
Acute coronary syndromes caused by the rupture of a coronary plaque and thrombosis are common initial, and often fatal, manifestations of coronary atherosclerosis in otherwise apparently healthy subjects. The detection of a lesion with high risk of rupture (the so-called “vulnerable plaque”) is of prime importance for the prevention of future ACS. OCT has emerged as one of the most promising tools to assess patients with ACS (Figure 7, Figure 8, Figure 9) and to detect key features of plaques at high risk of rupture.
Pathological data have shown differences in the characteristics of the underlying plaque in patients with stable and unstable coronary syndromes . Jang et al evaluated culprit lesion characteristics as assessed by OCT in patients with stable and unstable clinical presentations. The percentage of lipid-rich plaque in acute myocardial infarction, ACS and stable angina was 90%, 75%, and 59%, respectively (p=0.09). The authors also reported differences in the thickness of the fibrous cap, which was lower in the patients with unstable syndromes. Also, the frequency of thin-cap fibroatheroma (TCFA) was more common in patients with myocardial infarction (72%) and ACS (50%) than in the stable angina group (20%) . Consistently, Kubo et al showed a higher incidence of lipid-rich plaques (71% vs 42%; p=0.03), plaque rupture (42% vs 3%; p<0.001), intracoronary thrombus (67% vs 3%; p <0.001) and TCFA (46% vs 3%; p=0.001) in patients with unstable angina versus patients with a stable presentation . Fuji et al studied the location of TCFA in a 3-vessel OCT study conducted in 55 patients (165 coronary arteries). The authors identified 94 TCFA that were found to cluster in the proximal left anterior descending artery but had an even distribution in the left circumflex and right coronary arteries.
Tanaka et al suggested that morphologies of exertion-triggered and rest-onset ruptured plaques differ in patients with ACS who presented with a ruptured plaque at the culprit site. The culprit plaque tended to rupture at the fibrous cap shoulder more frequently in patients who had an ACS during exertion, whilst in the group with ACS developing at rest, the rupture of the fibrous cap was more commonly located in non-shoulder regions.
A study based on combined IntraVascular-Ultrasound Near-Infrared-Spectroscopy (IVUS-near-infrared spectroscopy [IVUS-NIRS]) and OCT assessment highlighted the role of superficial macrophages as a feature related to plaque vulnerability. Authors showed in almost all culprit sites of ACS lesions the co-presence of three features of vulnerability (minimum lumen area [MLA] <4 mm2, FCT<75µm and superficial macrophages). This finding set the basis for a new OCT vulnerability grading system including superficial macrophages that was applied later on in the prospective CLIMA study .
Uemura et al attempted to identify for the first time the lesions that exhibited rapid progression. TCFA and microchannel images were the plaque features more commonly present in plaques with progression at the univariate regression analysis. Based on another report, OCT-imaged coronary lesions exhibiting rapid progression showed a significantly higher prevalence of lipid-rich plaque (thin-cap fibroatheroma, layered plaque, macrophage accumulation, microvessel plaque rupture and thrombus) at baseline compared with those without rapid progression. Multivariate analysis identified lipid-rich plaque (odds ratio [OR] 2.17), TCFA (OR 5.85) and layered plaque (OR 2.19) as predictors of subsequent rapid lesion progression .
The thickness and structure of the fibrous cap, as well as the size and extent of the underlying necrotic core, are major determinants of plaque vulnerability. A proper assessment of FC thickness is central to both vulnerability and regression studies. OCT allows the diagnosis of TCFA with a sensitivity of 90% and a specificity of 79% when compared to histopathology , and is therefore suited for its in vivo detection , , . Moreover, good reproducibility (confidence intervals less than 0.04 mm) of the fibrous cap thickness has been demonstrated performing longitudinal measurements in multiple adjacent frames . In a study comparing OCT, IVUS and angioscopy in patients with acute myocardial infarction, OCT was the only imaging technology able to estimate fibrous cap thickness (mean 49±21 μm) . Angioscopy does not allow the measurement of the fibrous cap although a relation between the plaque colour by angioscopy and the thickness of the OCT-measured fibrous cap was shown , .
Over the years, large observational natural history studies have reportedly identified the OCT-derived atherosclerotic features associated with subsequent clinical events (Figure 10). Xing et al explored in 1,474 patients from the Massachusetts General Hospital (MGH) OCT Registry the clinical impact of plaques in non-culprit regions of target vessels . Major adverse cardiac events (MACE), defined as a composite of cardiac death, acute myocardial infarction, and ischaemia-driven revascularisation were significantly more common in patients with lipid-rich plaques (3.5% vs 1.8% at two years). In addition, lipid-rich plaques in patients with MACE had longer lipid lengths (p<0.001), wider maximal lipid arcs (p=0.023), and smaller minimal lumen areas (p=0.003). The CLIMA registry enrolled 1,003 patients undergoing OCT evaluation of an untreated proximal left anterior descending coronary artery. Overall, 1,776 lipid plaques were studied. Presence of MLA <3.5 mm2 (hazard ratio [HR] 2.1, 95% confidence interval [CI]: 1.1-4.0), FCT <75µm (HR 4.7, 95% CI: 2.4-9.0), lipid arc circumferential extension >180° (HR 2.4, 95% CI: 1.2-4.8), and macrophages (HR 2.7, 95% CI: 1.2-6.1) were all associated with an increased risk of clinical events. The simultaneous presence of the 4 OCT criteria in the same plaque was observed in 19.4% of patients experiencing the primary hard endpoint (death and or target segment myocardial infarction) and was an independent predictor of events (HR 7.54, 95% CI: 3.1-18.6). Consistent with the CLIMA registry, in the COMBINE trial , the presence of thin fibrous cap in functionally negative lesions was able to predict coronary events (primary endpoint incidence of 13.3% vs 3.1% in TCFA-positive vs TCFA-negative groups, respectively (hazard ratio 4.65; 95% CI: 1.99–10.89; p<0.001). More recently and on the same page, the PECTUS trial showed a worse outcome in STEMI patients with high-risk plaques (defined as a lesion with at least two of the following criteria: a lipid arc of at least 90°, a fibrous cap thickness less than 65 μm and either plaque rupture or thrombus presence). Patients with high-risk plaques had a higher 2-year incidence of the composite of all-cause mortality, non-fatal MI, or unplanned revascularisation at follow-up as compared to patients without a high-risk plaque (HR 1.93, 95% CI: 1.08-3.47; p=0.02). Pathology studies have highlighted other features related to the risk of ACS. In about 5% of cases, acute thrombosis occurs at the site of calcific nodules. In vivo OCT studies have identified two varieties of nodules (smooth and disrupted calcified nodules). The latter are characterised by loss of integrity of the intimal fibrous layer and possible superficial thrombus apposition and are associated with a higher one-year incidence of cardiac death and/or target lesion MI , , . Using OCT, Jiang et al studied all three main epicardial arteries in 883 patients with acute myocardial infarction. In a patient-level analysis, TCFA (adjusted HR 3.05, 95% CI: 1.67-5.57) and MLA <3.5 mm2 (adjusted HR 3.71, 95% CI: 1.22-11.34) were independent predictors of the primary endpoint (a composite of cardiac death, non-culprit lesion-related non-fatal MI, and unplanned coronary revascularisation) .
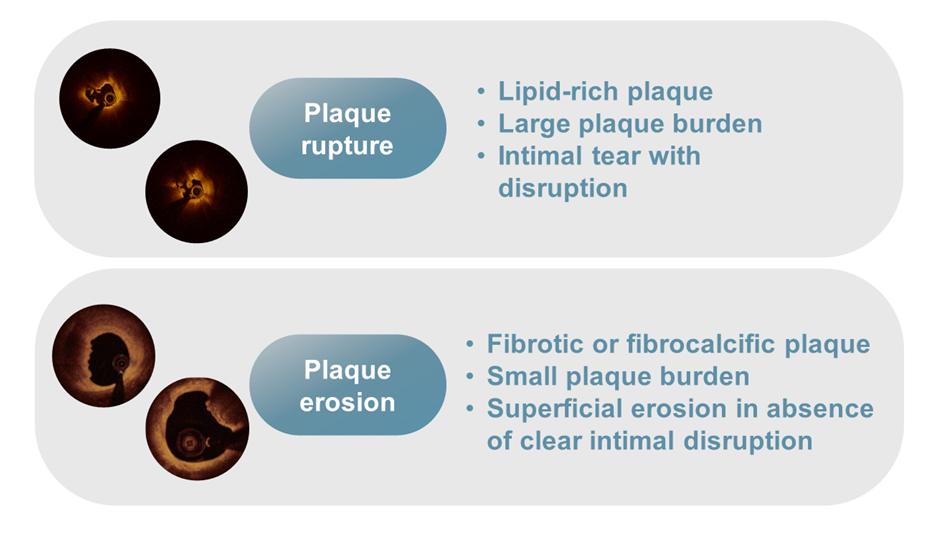
Plaque rupture versus plaque erosion as mechanism of acute coronary syndromes.
Unlike IVUS, OCT cannot be utilised to address serial changes in plaque burden due to its limited penetration. However, the high resolution of superficial components allows a precise assessment of variations of plaque morphology. Preliminary regression studies performed with the former time-domain OCT technique explored the plaque changes induced by statins. The EASY-FIT Study randomised 70 patients with unstable angina pectoris and untreated dyslipidaemia to a higher (20 mg/day) vs a low dosage (5 mg/day) of atorvastatin therapy. The group treated with atorvastatin 20 mg showed significantly higher FCT thickening (69% vs 17%; p <0.001) and lipid arc reduction . The ESCORT (Effect of Early Pitavastatin Therapy on Coronary Fibrous Cap Thickness Assessed by Optical Coherence Tomography in Patients with Acute Coro nary Syndrome) trial randomised patients to early or late pitavastatin. The early statin treatment group led to significant increases in FCT and a reduction of lipid pool arc . The small number of studied patients, the low statin dosage as compared to Western standards and the initially adopted time-domain OCT technology were the main limitations of these preliminary regression studies. The HUYGENS trial showed for the first time that proprotein convertase subtilisin/kexin type 9 (PCSK9) inhibitors can increase plaque stability, turning vulnerable plaques into quiescent plaques. Authors found that ACS lesions treated with evolocumab plus optimal medical therapy undergo a significant increase in FCT and a reduction in lipid arc degree as compared to patients with optimal medical therapy alone. Consistently in the OCT and NIRS-IVUS PACMAN-AMI study , alirocumab led to a significant reduction in the circumferential extension of OCT-detected macrophages in addition to the increase in FCT and reduction of lipid components.
In the PACMAN-AMI trial, Biccirè et al explored the clinical impact presence versus absence of plaque regression. A concomitant atheroma volume reduction, lipid content reduction, and an increase in fibrous cap thickness (there combined plaque features were identified as triple regression) were accompanied by a significant reduction in cardiovascular events. The study further highlighted the prognostic role of plaque vulnerability features and the potential role of drug therapy to passivate coronary lesions.
Suboptimal angiographic lesion visualisation may happen in the presence of intermediate lesions of uncertain severity, very short lesions, pre- or post-aneurysmal lesions, ostial or left main stenoses, disease at branching sites, sites with focal spasm, or angiographically hazy lesions.
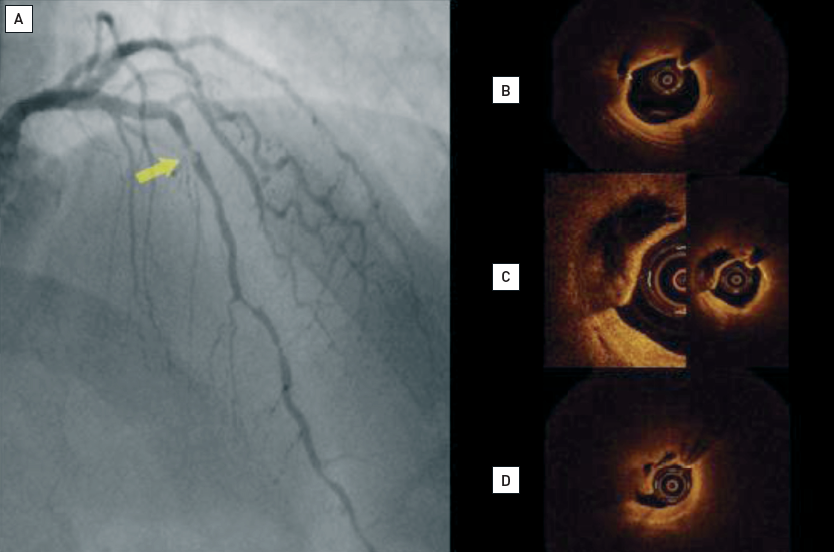
The identification of culprit lesions in patients with ACS can be challenging, especially in the presence of ambiguous coronary angiography and multivessel disease. In 15% of patients undergoing primary PCI, angiography shows a patent infarct-related vessel with Thrombolysis in Myocardial Infarction (TIMI) 3 flow . OCT can detail the superficial composition of the plaque and identify ruptured plaques with superimposed thromboses. In the presence of myocardial infarction with non-obstructive coronary arteries (MINOCA), OCT can identify the underlying mechanism of ACS. MINOCA may be due to acute non-significant thrombosis, secondary ischaemia, spontaneous cardiac dissections, variant angina and coronary embolism. These clinical entities subtend a specific pathophysiology and a dedicated treatment, and OCT can facilitate the difficult differential diagnosis. In a recent registry including 145 women with MINOCA undergoing OCT evaluation of coronary vessels without clear culprit lesion at coronary angiography, a definite or possible culprit lesion was identified by OCT in 46.2% (67/145) of participants . Similarly, in 40 MINOCA patients with mild coronary angiography findings, Gerbaud et al applied OCT to identify potential culprit lesions overseen by angiography . Plaque rupture, eruptive calcific nodules, plaque erosion, lone thrombus, and spontaneous coronary artery dissection were found in 35%, 2.5%, 30%, 7.5%, and 5% of patients, respectively. The concomitant use of OCT and cardiac magnetic resonance showed a MINOCA in 100% of cases.
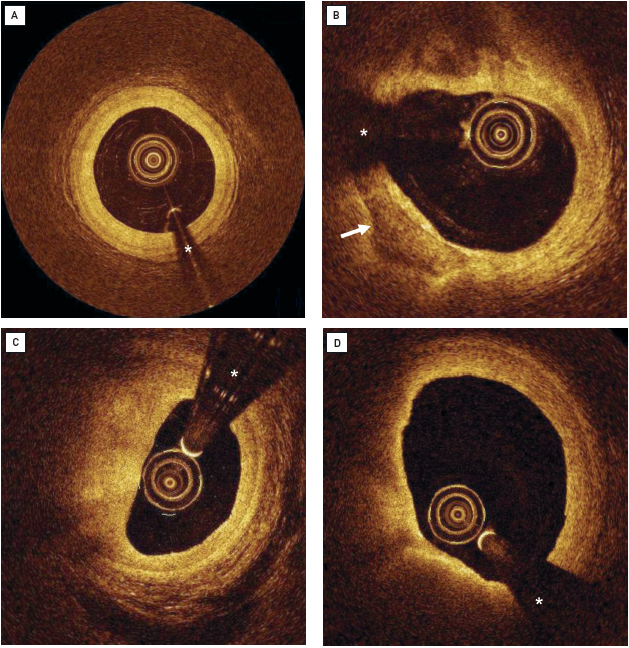
OCT can identify the mechanism of coronary thrombosis (Figure 11): 1) thrombosis with signs of plaque rupture as visualised by a dissection flap representing the remnant of a fibrous cap, or 2) thrombosis with an apparently normal endothelial lining underneath, which is likely to be indicative of erosion. In some cases, however, a massive thrombosis does not permit the assessment of vessel and plaque morphology , . Ruptured plaques may occur with or without a superimposed thrombus. When signs of ulceration are present without evidence of thrombosis, plaque ulceration is likely old, and the lesion cannot be defined as the “culprit” with certainty. Clinical criteria are needed to relate the lesion to the acute events , . Niccoli et al studied the mechanism of ACS (plaque rupture vs intact fibrous cap) in 139 consecutive ACS patients. Major adverse cardiac events occurred more frequently in patients with plaque rupture (39.0 vs 14.0%; p=0.001), which was an independent predictor of outcome at multivariable analysis.
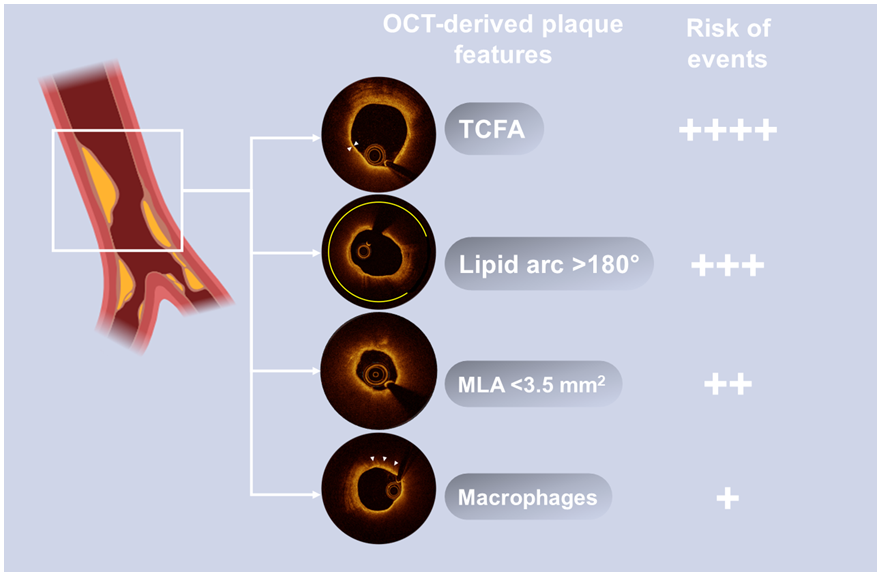
OCT-derived plaque features associated with clinical events at follow-up in prospective natural history studies.
The ability of OCT to identify ACS culprit lesions with an intact fibrous cap can be used to select lesions that can be treated with a less aggressive approach, without balloon dilatation or stenting. In a first pilot study, it was shown that such a strategy can be accomplished with a good clinical outcome at 2 years . These preliminary data were confirmed later on by two studies , . The EROSION study showed that a further decrease in thrombus volume occurs between 1-month and 1-year follow-up using a strategy of stenting deferral. These findings may have clinical implications, but more robust data are needed to confirm these preliminary studies.
Since its introduction into the clinical arena, OCT has emerged as an excellent tool to improve interventional procedures. There was a long clinical process that required the identification and validation of OCT metrics of optimal coronary intervention. Recently, the publication of large, multicentre, randomised trials have validated the superiority of OCT-guided over angio-guided interventions in reducing cardiovascular events.
Recent randomised trials have consistently demonstrated the prognostic benefits of intracoronary imaging in guiding PCI (Tables 1-3). In the past, IVUS trials (IVUS-XPL and ULTIMATE ) proved the effectiveness of IVUS for improving clinical outcome. On the same page, the RENOVATE-COMPLEX-PCI a (Randomized Controlled Trial of Intravascular Imaging Guidance versus Angiography-Guidance on Clinical Outcomes after Complex Percutaneous Coronary Intervention) trial addressed for the first time the role of intracoronary (IC) imaging procedures, including either IVUS or OCT in a complex lesion subset which included true bifurcations, chronic total occlusion, unprotected left main, long coronary lesions and severely calcified lesions. At 24-month follow-up, intracoronary imaging guidance was associated with a significant lower rate of target vessel failure (TVF, a composite of death from cardiac causes, target vessel-related MI, or clinically driven target vessel revascularisation). Importantly, imaging guidance was beneficial regardless of the imaging modality used. It was noteworthy that cardiac mortality (1.7% vs 3.8%, HR 0.47, 95% CI: 0.24-0.93) was significantly reduced in the imaging arm.
The OCTOBER trial was the first randomised trial to address the clinical impact of OCT guidance. The trial enrolled 1,201 patients with complex coronary bifurcation lesions. At 24-month follow-up, the rate of the composite of death from cardiac causes, target lesion MI or ischaemia-driven target lesion revascularisation (TVF) was statistically lower with OCT than with angiography guidance (10.1% vs 14.1%, HR 0.70, 95% CI: 0.50–0.98; p=0.035). Additionally, the OCT-guided intervention arm showed a 50% reduction in mortality.
The ILUMIEN IV trial randomised a total of 2,487 patients with medically treated diabetes mellitus or complex coronary artery lesions to OCT-guided or angio-guided coronary interventions. The 2-year rate of TVF (a composite of death from cardiac causes, target vessel MI or ischaemia-driven target vessel revascularisation) did not differ significantly between the two groups (7.4% vs 8.2%, HR 0.90, 95% CI: 0.67–1.19; p=0.45). Despite the achievement of a final larger minimum stent area (MSA) in the OCT group (5.72±2.04 mm2 vs 5.36±1.87 mm2; p<0.001), the incidence of target lesion revascularisation was similar in the two groups. However, the significant increase in MSA resulted in a lower incidence of stent thrombosis at follow-up (0.5% vs 1.4%, HR 0.36, 95% CI: 0.14-0.91). Furthermore, in line with other intracoronary imaging trials, OCT guidance led to a 45% lower cardiac mortality. The reason why ILUMIEN IV did not show a reduction in the primary clinical endpoint remains speculative. The COVID-19 pandemic may have had an impact on the conduct of the trial, by affecting the number of target vessel revascularisations in the trial, prompting patients not to undergo angiography despite the presence of symptoms. The lower complexity of the enrolled lesions, with respect to other randomised imaging trials, with diabetic patients possibly not exhibiting complex anatomies, is another aspect to be considered. Of note, ILUMIEN IV did not include lesions located in the left main and included a small number of calcific lesions (10%), chronic occlusions (7%) and bifurcations (3%).
A large recent meta-analysis reported that IC imaging-guided PCI was associated with a significantly reduced risk of TVF (relative risk [RR] 0.72), cardiovascular death (RR 0.56), MI (RR 0.81), stent thrombosis (RR 0.48), and target lesion revascularisation (RR 0.75) as compared to angiography alone-guided PCI.
Due to the available evidence provided by large, randomised trials and updated meta-analyses, intravascular imaging with either OCT or IVUS was endorsed with class IA indications in the latest ESC guidelines on chronic coronary syndromes to improve outcomes of patients undergoing PCI for anatomically complex lesions (left main, true bifurcations and long lesions). This recommendation is built upon substantial evidence and subanalyses demonstrating that intracoronary imaging guidance can reduce subsequent coronary events especially in complex settings where the risk of stent failure is higher , , . As direct comparisons between IVUS and OCT did not show a superiority of one technique over the other, the choice between the two imaging modalities should depend on operator expertise and particular anatomical settings. IVUS guidance may be helpful in specific settings such as aortic-ostial lesions (ostial left main or ostial right coronary artery), or in patients with chronic kidney disease as no contrast agent administration is needed. Conversely, OCT represents a key tool when morphological reconstruction of the coronary artery is needed (quantification and distribution of calcium, fibroatheromas and calcified nodules) and when precise identification of stent struts is useful (i.e., true bifurcation with 2-stent strategy and risk of severe malapposition).
The ILUMIEN observational OCT trial was the first study to focus on the role of pre-intervention OCT assessment. Based on pre-PCI OCT, the procedure was altered in 55% of patients leading to the selection of different stent lengths of which 25% were shorter and 43% were longer. Based on post-intervention OCT, further stent optimisation was performed in 25% of patients with further in-stent post-dilatation (81%) or placement of new stents (12%). MACE incidence at 30 days was low, with death occurring in 0.25%, myocardial infarction in 7.7%, repeat PCI in 1.7%, and stent thrombosis in 0.25%.
In the randomised controlled trial ILUMIEN III , Ali ZA et al proved the non-inferiority of OCT guidance versus IVUS guidance in term of final minimum stent area 5.79 mm2 (interquartile range 4.54–7.34) vs 5.89 mm2 (4.67–7.80), respectively. They applied a novel approach for stent sizing, based on a pre-intervention measurement of the media-to-media border. According to the core lab centralised analysis, a correct measurement was deemed possible in 95% of cases, despite the limited penetration of OCT. Such an approach was applied in the randomised ILUMIEN IV trial (ClinicalTrials.gov: NCT03507777), which evaluated OCT-guided compared to angio-guided PCI in terms of post-PCI lumen dimensions and clinical outcomes in patients with diabetes and/or with complex coronary lesions , .
OCT can be used to confirm the presence of atherosclerotic plaque and to characterise its composition. Assessment of plaque composition is key in many interventional procedures. In particular, heavily calcified lesions affect correct stent positioning and dilatations while components of plaques with large necrotic core may embolise distally.
Fujino et al developed an OCT-based calcium scoring system to predict stent underexpansion. The multivariable model showed that the maximum calcium angle per 180°, the maximum calcium thickness per 0.5 mm, and the calcium length per 5 mm are independent predictors of stent expansion. A calcium score was then defined as 2 points for a maximum angle >180°, 1 point for a maximum thickness >0.5 mm, and 1 point for a length >5 mm. Lesions with a score of 4 had poor stent expansion (96% vs 78%; p<0.01). Recently, several devices have become available, expanding the possibilities of treatment in calcified lesions through different mechanisms. OCT assessment of the calcification score enables the selection of the most effective technology for treating highly calcified lesions , , . Rotational, orbital and excimer laser atherectomy, cutting and scoring balloons and intravascular lithotripsy (IVL; Shockwave Medical, Inc. Coronary Lithoplasty® System) are valuable solutions to improve lesion preparation. Deep calcification or a score ≤2 may suggest the adoption of a non-compliant (high-pressure) scoring or cutting balloon. A score ≥3 favours a different approach with intravascular lithotripsy and orbital or rotational atherectomy. These last two technologies are particularly recommended in presence of nodular and uncrossable lesions .
The relation between the lipid content of the plaque and the presence of a no-reflow phenomenon after stent implantation has been shown in an IVUS-virtual histology study . This observation has been confirmed by OCT. According to Ohshima et al, the frequency of a no-reflow phenomenon increases according to the lipid content of the plaque . Consistent with these findings, Imola et al compared 15 patients with postprocedural myocardial infarctions with 15 control patients without infarctions and showed that incomplete stent coverage of coronary lipid pools is associated with an increased risk of postprocedural myocardial infarction .
Some features that may be missed by IVUS, such as malapposition, intra-stent plaque/thrombus protrusion, or dissections at the stent edges can be assessed with OCT. This aspect is instrumental to a better understanding of how to obtain optimal stenting. Yet OCT may offer interventionalists an excess of information that may lead to an overreaction to the findings. The CLI-OPCI studies , were specifically designed to answer this crucial point and to identify post-intervention OCT features that are related to worse outcome. The multicentre CLI-OPCI study aimed at verifying whether the use of OCT can improve the 1-year composite event of cardiac death or non-fatal myocardial infarction after PCI in a real-world population. Results from 335 patients who underwent an OCT-guided intervention were compared with those from a control group by means of propensity score adjustment. Conclusions were very promising; in fact, the OCT-guided interventions halved the rate of death and myocardial infarction from 13% to 6.6% (p=0.006). Limitations of the study were in its non-randomised design and the relatively small size. The CLI-OPCI II study corroborated the findings obtained in the CLI-OPCI registry, testing the role of OCT findings after PCI in a larger population comprising 832 patients and 1,002 lesions with a median follow-up of 319 days. Consistent with previous data, CLI-OPCI II showed that OCT-defined suboptimal stent deployment was a relatively common finding (31.0% of cases) with a significantly higher prevalence in patients experiencing MACE in the first year of follow-up (59.2% vs 26.9%; p<0.001) and was an independent predictor of worse outcome (HR 3.53; p<0.001).
The Pan-London PCI registry , conceived as an observational study including 123,764 patients, confirmed the data that emerged from the CLIO-PCI study. OCT guidance was used in 1,149 (1.3%) patients, IVUS in 10,971 (12.6%) and angiography alone in the remaining 75,046 patients. OCT-guided PCI was associated with improved procedural outcomes, in-hospital events, and long-term survival, compared with standard angiography-guided PCI. Other studies, performed with a randomised design and mainly exploring surrogate clinical endpoints, confirmed the effectiveness of an OCT guidance strategy for stent deployment.
The DOCTORS study was a multicentre, randomised study, carried out in 240 patients with non-ST-segment elevation ACS, for comparison of OCT-guided PCI versus fluoroscopy-guided PCI. In the OCT arm, pre- and post-PCI imaging were performed. OCT-guided PCI was found to be associated with higher postprocedural fractional flow reserve, which was the primary study endpoint.
The OPINION study was a prospective, multicentre, randomised (ratio 1:1), non-inferiority comparative study that allocated 829 patients to receive OCT-guided PCI or IVUS-guided PCI. Both OCT-guided and IVUS-guided PCI yielded excellent angiographic and clinical results at 12 months, with very low rates of 8-month angiographic binary restenosis and 12-month target vessel failure.
The ILUMIEN III study was designed as a randomised non-inferiority trial, like the OPINION trial. The trial proved the non-inferiority of OCT guidance versus IVUS guidance in terms of the final minimum stent area, 5.79 mm2 in the OCT group versus 5.89 mm2 in the IVUS group.
The criteria adopted for post-PCI evaluations in large, randomised OCT-guidance trials are shown in Table 3.
In line with IVUS studies, OCT papers have shown that incomplete lesion coverage and residual reference segment stenosis are associated with stent failure . In the CLIO-PCI II study , stented segments exhibiting a narrowing at the reference segment (lumen area <4.5 mm2 in the presence of significant plaque) experienced a worse outcome with a risk of MACE approximately five times higher regardless of the location (proximal or distal reference segment).
OCT with its high resolution can identify less extensive edge dissections which are missed by IVUS. Whilst minor edge dissections are unlikely to convey a worse outcome, large ones were found to be related to a higher incidence of MACE. In the CLI-OPCI II Study , dissections >200 µm at the distal (but not proximal) stent edge by OCT emerged as an independent predictor of MACE (HR 2.5). The same conclusion was reached by Bouki et a . According to authors who studied 74 patients with ACS, the presence of a residual dissection flap >0.31 mm carried an adverse long-term clinical impact. In contrast with these data, Soeda et al did not relate the presence of dissection to the clinical outcome. However, the authors included mild dissections in the study, which represent a common OCT finding after stenting. The negative clinical impact of stent edge dissection is detected in the early phase after intervention with the vast majority of MACE occurring during the first 3 months after the procedure . This finding does not contradict the findings of Radu et al , which showed a tendency of dissections to heal at late follow-up (over 90%). According to the ESC consensus document on the clinical use of intracoronary imaging , dissections with: 1) arc grade >60, 2) longitudinal extension >2 mm, 3) involvement of deeper layers (medial or adventitia) and 4) localisation distal to the stent are related to a higher risk for adverse events.
Stent underexpansion, using absolute dimensions expressed as in-stent MLA, is significantly related to clinical outcome. The CLI-OPCI II registries , identified an MLA of 4.5 mm2 as a threshold for discriminating patients at risk of MACE, while in the DOCTORS trial, the optimal luminal cut-off to predict postprocedural fractional flow reserve >0.90 was 5.44 mm2 by OCT . Underexpansion can be measured as percentage of MSA underexpansion. The ESC consensus document on clinical use of intracoronary imaging by Räber et al suggested a cut-off >80% for the MSA (relative to average reference lumen area). This seems a reasonable solution, keeping in mind that values of in-stent expansion greater than 90% are difficult to achieve , , .
For the past two decades, IVUS has been used to assess the acute result following stent implantation, giving valuable information on stent expansion, strut apposition and signs of vessel trauma including dissections and tissue prolapse. IVUS studies , have suggested that stent strut malapposition is a relatively uncommon finding, observed in approximately 7% of cases. By contrast, OCT can visualise in greater detail the complex coronary arterial wall structure after stenting. As a result, OCT studies in the acute post-stent setting have demonstrated a relatively high proportion of stent struts not completely apposed to the vessel wall even after high pressure post-dilatation, with this phenomenon being particularly evident in regions of stent overlap. Malapposed struts were found to be frequent in bifurcations despite the use dedicated stents (Figure 12). While these findings are impressive and helpful for the improvement of future stent design, the clinical relevance of malapposed struts today is questionable. In fact, IVUS and OCT studies [86–89] failed to relate acute stent vessel wall malapposition with clinical outcome. It is likely that the innovative technology adopted for the new drug-eluting stents (DES) minimises the consequences of acute malapposition.
Stent strut malapposition has been proposed as a cause of DES failure. Anecdotal cases shed light on the role of acute and late malapposition as a possible cause of first-generation DES thrombosis. Postulated causes of stent strut malapposition are numerous and include incomplete stent expansion, stent recoil or fracture, late outward vessel remodelling or the dissolution of thrombus compressed during PCI between the stent strut and the vessel wall. Regardless of the pathophysiological mechanism, the major concern in stent malapposition remains the assumption that areas of strut malapposition cause non-laminar and turbulent blood flow characteristics, which in turn can trigger platelet activation and thrombosis.
Tissue prolapse after stent implantation has been identified as an OCT predictor of early stent thrombosis and has been related to adverse short-term prognosis following PCI .
The detection of tissue prolapse at OCT analysis is rather common in ACS patients. In the CLI-OPCI ACS registry including 780 patients (50% with ACS), irregular protrusion was more common in patients treated for MI and was an independent predictor of 1-year clinical outcomes.
Occasionally, ambiguous angiographic images can be observed after stent implantation and can create doubts about the need for further interventions. OCT may be helpful in clarifying the origin of these findings. Hazy regions at the borders of the stent can correspond to edge dissections, thrombus or residual uncovered plaque. When they are located inside the stent, they can be associated with the presence of intracoronary thrombus or intra-stent dissections .
Recent multicentre randomised studies have proved the effectiveness of OCT guidance in complex anatomical scenarios, including treatment of left main, ostial left anterior descending or left circumflex artery lesions and bifurcations. One technical drawback is that plaque located at the very ostium of the left or right coronaries cannot be imaged by OCT as it is difficult to obtain blood clearance with a non-selective guide catheter in the attempt to visualise the ostium. Recent studies have addressed the role of OCT guidance for left main lesions. Systematic OCT guidance during left main PCI enabled the detection of acute stent underexpansion (7.2%) and malapposition (10.9%) and led to reduced late lumen loss at follow-up .
The LEMON study proved the effectiveness of OCT-guided PCI for middle or distal left main according to a pre-specified protocol. The main study endpoint (residual angiographic stenosis <50% + TIMI 3 flow in all branches + adequate OCT stent expansion) was achieved in 86% of cases and the one-year survival free from major clinical adverse events was observed in 98.6% of cases .
Bifurcations represent a subset of coronary lesions with higher rates of stent failure, including thrombosis, with no general consensus about the optimal treatment strategy for these lesions . The OCTOBER trial showed that the ability of OCT to characterise atherosclerotic plaques in this complex setting is key to significantly improving patient outcomes.
Chronic total occlusions (CTO) are a complex scenario where IVUS has proved to be highly instrumental. The high image resolution of OCT could be useful; for this reason preliminary ex vivo experiences tested the use of forward-looking OCT catheters . OCT was able to differentiate between occluded lumen and different layers of the arterial wall, showed potential to identify microchannels and could differentiate true from false lumen (Figure 13).
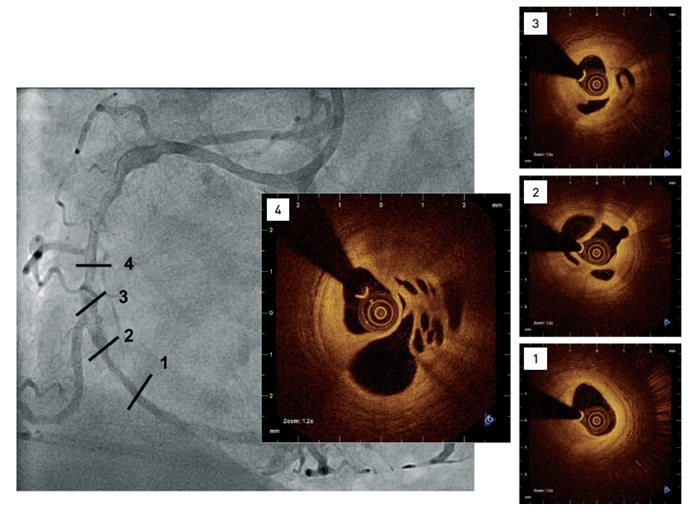
Coronary angiogram showing diffuse disease including a complex hazy lesion(1-4) Intracoronary OCT confirming small lumen size, the presence of predominantly signal-rich, fibrous tissue and multiple channels.[OCT image source: St. Jude/LightLab Imaging C7XR]
Lastly, the use of OCT has largely been corroborated in the setting of severely calcified lesions, where the use of angiography alone does not allow for a proper identification of proximal and distal landing zones, as well as the exact amount of calcium , . OCT metrics of severe calcification, such as large calcium arc >180, calcium depth and length, have been consistently associated with stent underexpansion . According to OCT findings, different calcium debulking techniques to properly modify the calcified lesion before stent implantation have been proposed, such as cutting or scoring balloons, atherectomy, or intravascular lithotripsy .
Several OCT studies have been published that address stent tissue coverage at follow-up. This approach was driven by the need to reduce the unacceptable rate of first-generation DES thrombosis. Neointimal coverage on OCT, albeit not necessarily indicative of presence of functional endothelial cells, was accepted as an indicator of vessel healing (Figure 14, Figure 15).
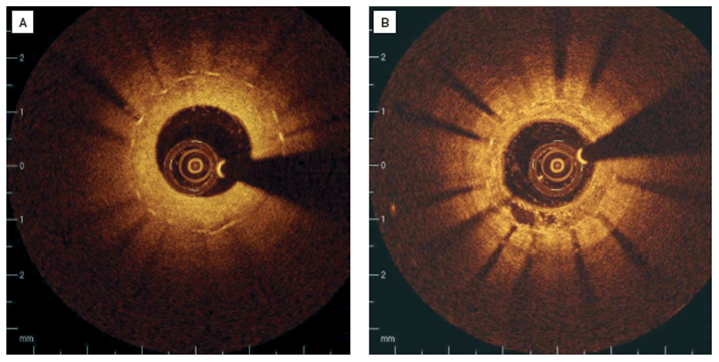
Clinical examples of intracoronary OCT in patients with restenosis(A) Stent struts are covered with relatively thick, homogenous, signal rich tissue. (B) Covering of the stent struts is seen to be inhomogeneous, suggesting neovascularisation in 7 o’clock position.
[OCT image source: St. Jude/LightLab Imaging C7XR]
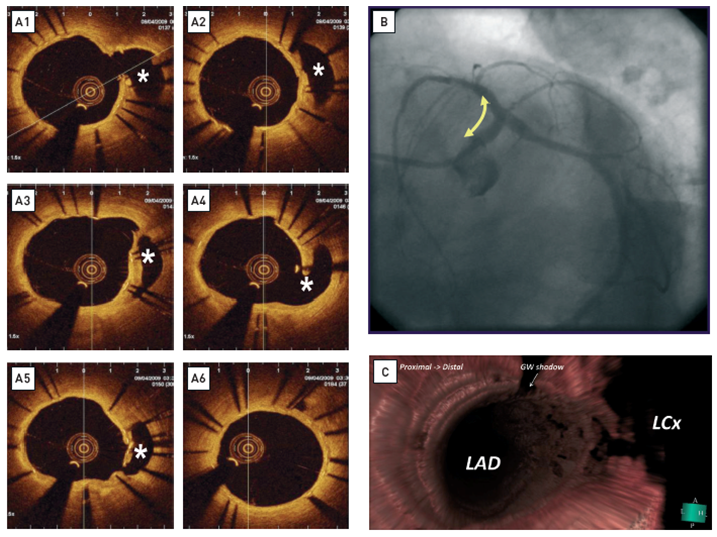
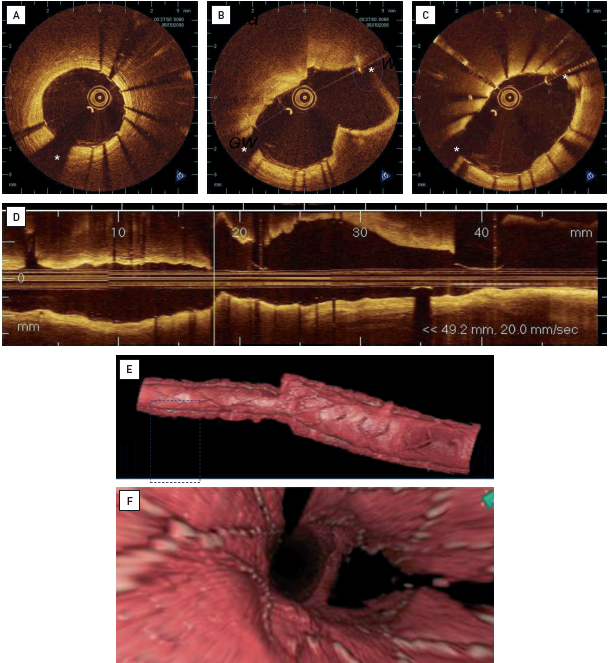
Long-term follow-up (1 year) after treatment of the left main bifurcation by stenting from the left anterior descending artery into the left main stem across the left circumflex artery(A) OCT reveals rather uniform, homogeneous, signal-rich tissue coverage of the stent and visualises the struts across the ostium of the left circumflex artery (asterix). All non-apposed side branch struts show tissue coverage. The ostium of the left circumflex is patent. [OCT image source: St. Jude/LightLab C7XR]. (B) Coronary angiogram at 1-year follow-up. (C) 3D rendering of the OCT data. En face view from proximal to distal demonstratesthe strut’s geometry at the carina.
Based on past follow-up studies following sirolimus-eluting stent (SES) implantation, the prevalence of struts covered by thin neointima undetectable by IVUS was 64% . According to Takano et al the rates of exposed and malapposed struts were 15% and 6%, respectively at 3 months and were more frequent in the presence of ACS . Other studies have shown a significantly smaller number of uncovered stent struts in patients receiving bare metal stents (BMS) as compared to drug-eluting stents (DES) .
The LEADERS trial was a multicentre, randomised trial with a durable polymer sirolimus-eluting stent (SES) used in 1,707 patients . An OCT substudy of the LEADERS trial (comparison of a biolimus-eluting stent [BES] with a biodegradable polymer) showed, at 9 months, more complete strut coverage in patients allocated to BES as compared to SES. Interestingly, at 4-year follow-up, the BES showed a reduction in the risk of very late stent thrombosis (risk ratio 0.20, 95% CI: 0.06-0.67; p=0.004) . In an OCT substudy of the Harmonizing Outcomes With Revascularization and Stents in Acute Myocardial Infarction (HORIZONS-AMI) trial, patients with STEMI were randomised to paclitaxel-eluting stents (PES) vs BMS implantation . PES struts had a significantly reduced neointimal hyperplasia as compared with BMS but resulted in higher rates of uncovered and malapposed stent struts at 13-month follow-up (1.1±2.5% in BMS lesions versus 5.7±7.0% in PES lesions; p<0.0001). These observations have been important to understanding the differences in stent design, however, no threshold for significant coverage has as of yet been established.
Iannaccone et al performed a systematic review and meta-analysis to evaluate the frequency and clinical correlations of strut malapposition, uncovered struts and degree of neointimal thickness by OCT according to stent type. Eleven full-text studies (280,652 analysed struts, 921 patients) were assessed. The malapposition rates were the highest for BES and bioresorbable vascular scaffolds (BVS) (2.7 and 3.8%, respectively), and the lowest for everolimus-eluting stents (EES) and fast-release zotarolimus-eluting stents (ZES) (0.9 and 0.1%, respectively). The uncoverage rates were the highest for BES and SES (7.7 and 8.8%, respectively) and the lowest for BMS and ZES (0.3 and 0.3%, respectively). BMS had the greatest neointima thickness (340 mm), while SES, EES, and BES had the least neointima thickness. Second-generation DES therefore showed a better intermediate-term strut apposition and coverage than first-generation DES, BVS and BMS. EES demonstrated the overall best combination of healing with suppression of neointimal hyperplasia at 6–12 months.
OCT can characterise neointimal tissue . Neointimal tissue shows a variety of morphologies ranging from homogenous, bright, uniform tissue to optically heterogeneous tissue or eccentric tissue of varying thickness. Furthermore, structural details within the tissue can be observed such as intimal neovascularisation or a layered appearance , often observed in restenotic regions. Variations in the appearance of strut coverage can be seen within an individual patient, within an individual stent or within stents of different design. OCT findings, such as dark, signal-poor halos around stent struts, may reflect fibrin deposition and incomplete healing, as described in pathologic and animal experimental series . However, there is a paucity of data directly demonstrating the OCT appearance of different components in neointimal tissue as defined by histology. The neointima can develop atherosclerotic lesions over time, a phenomenon dubbed “neoatherosclerosis”. OCT can visualise these lesions and add to our understanding of the incidence and role of neoatherosclerosis in relation to stent failure. Accelerated neoatherosclerosis has been described in DES , .
Stent thrombosis tended to occur at a yearly rate >0.5% after deployment of first-generation DES. However, acute and late thrombosis represent a rare finding after the positioning of new DES. The mechanism of DES thrombosis is multifactorial, with premature discontinuation of dual antiplatelet therapy, stent underexpansion, hypersensitivity (e.g., to the polymer), and lack of endothelial tissue coverage and strut malapposition all being implicated. The results of small observational OCT studies, as described above, are compatible with evidence from animal and human post-mortem series showing that DES cause impairment in arterial healing, with some suggesting incomplete re-endothelialisation and persistence of fibrin possibly triggering late stent thrombosis , . Pathological data in humans suggest that neointimal coverage of stent struts could be used as a surrogate marker of endothelialisation due to the correlation between strut coverage and endothelialisation. However, OCT observations need to be interpreted with caution. OCT is limited by its resolution of 15 μm which is less than the thickness of an individual layer of endothelial cells. Furthermore, the presence of tissue coverage does not necessarily imply the presence of a functionally intact endothelium . Early experimental stent data have shown that endothelial function can vary considerably and can show evidence of damage when subjected to the Evan’s blue dye exclusion test, even in the presence of a well-structured neointimal layer . However, OCT is the only imaging modality to date which offers, within the discussed limits, the possibility to understand tissue coverage and neointima formation in DES over time.
OCT can be useful in the evaluation of the causes that contribute to restenosis after DES implantation, such as incomplete lesion coverage or gaps between stents. Neointimal tissue shows great optical variability, most probably reflecting a pathophysiology such as incomplete healing. The clinical significance of these findings has not been fully understood , . Stent fracture has also been related to restenosis in DES and can be visualised with OCT . Non-uniform distribution of stent struts can affect the drug concentration within the arterial wall and may therefore play a role in restenosis in DES , . OCT follow-up assessment after crush stenting with PES at bifurcation sites showed that crush stenting resulted in three layers of metal in the segment of the main vessel proximal to the stented side branch. This raised some concern due to the higher dose of drug locally released and the consequently delayed endothelialisation. The ODESSA trial was specifically designed to assess by OCT sites with drug-eluting stent overlap. A complex interaction between strut overlap, underlying plaque and tissue coverage was found . Overlapping drug-eluting stents in normal-appearing coronary segments showed a higher incidence of uncovered or malapposed struts.
The applied energies in intravascular OCT are relatively low (output power in the range of 5.0-8.0 mW) and are not considered to cause functional or structural damage to the tissue. Therefore, safety issues seem mainly dependent on the need for blood displacement for image acquisition. One recently published study evaluated the safety and feasibility of time-domain OCT in 76 patients in the clinical setting using the occlusive technique. Vessel occlusion time was 48.3 ±13.5 seconds. The most frequent complications were transient events, such as chest discomfort, bradycardia or tachycardia, and ST-T changes on the electrocardiogram, all of which resolved immediately after the procedure. There were no major complications, including myocardial infarction, emergency revascularisation, or death. The authors reported that acute procedural complications such as acute vessel occlusion, dissection, thrombus formation, embolism, or vasospasm along the procedure-related artery, were not observed . The introduction of the non-occlusive technique in clinical practice has led to an important reduction in the procedural time and in the incidence of chest pain and ECG changes during image acquisition. These side effects are expected to be reduced further by the introduction of Fourier-domain OCT. In Fourier-domain OCT, high pullback speeds of up to 40 mm/sec allow data acquisition of a long coronary segment within a few seconds and without introducing relevant ischaemia. Imola et al addressed the safety of Fourier-domain OCT in 114 OCT acquisitions, performed in 90 patients. In 99% of cases the procedure was successful. No patients suffered renal damage, and no major complications were recorded. Only one patient had a transient vessel spasm which was resolved with intracoronary administration of nitrates. During Fourier-domain OCT image acquisition, no ischaemic ECG changes occurred. Ventricular ectopic beats were found in only 3 patients while other major arrhythmias (ventricular tachycardia or fibrillation) were not observed.
After decades of research and evidence on its safety and usefulness, intravascular imaging by OCT is now an increasingly used tool with wide indications in routine clinical practice and strong recommendation by international guidelines. It represents an established method to characterise plaque before intervention, facilitate the choice of interventional devices and guide stent deployment. Recent randomised trials have documented the effectiveness of an OCT-guided approach versus angiography only in guiding coronary intervention. Furthermore, with its unique ability to characterise the superficial plaque components in great detail, OCT has emerged as a useful method for plaque regression studies and has proven to be ideal for precisely identifying mechanisms of plaque instability in culprit lesions and morphological features of plaques at high risk of rapid progression and destabilisation. In conclusion, in a cardiovascular care system that requires increasingly personalised approaches, the use of intravascular imaging, particularly OCT, is a key tool for improving patient prognosis and therefore can no longer be neglected.
MOVING IMAGE 1
“090793 OCT acute post stent”: OCT (St. Jude/LightLab Imaging) immediately after coronary stent implantation. Strut malapposition as well as tissue prolapse can be observed.
Moving image 2
“Animation of C7 deployment”: schematic (courtesy of St. Jude/LightLab Imaging) illustrating the practical application of Fourier domain OCT in the cath lab. A guidewire is introduced into the coronary, the OCT imaging catheter is advanced distally to the region of interest and then withdrawn during simultaneous flush delivery through the guide catheter.
“Animation of C7 deployment”: schematic (courtesy of St. Jude/LightLab Imaging) illustrating the practical application of Fourier domain OCT in the cath lab. A guidewire is introduced into the coronary, the OCT imaging catheter is advanced distally to the region of interest and then withdrawn during simultaneous flush delivery through the guide catheter.
Moving image 3
“C7 pullback real time”: example of an intracoronary Fourier domain OCT pullback (St. Jude/LightLab Imaging). The pullback speed is 20 mm/sec. Therefore, the pullback does not cause ischaemia and shows few motion artifacts.
“C7 pullback real time”: example of an intracoronary Fourier domain OCT pullback (St. Jude/LightLab Imaging). The pullback speed is 20 mm/sec. Therefore, the pullback does not cause ischaemia and shows few motion artifacts.
Moving image 4
“NCLCx OCT fuo post stent”: OCT (St. Jude/LightLab Imaging) at long-term after coronary stent implantation. Note the relatively thin tissue coverage and bifurcation region. The stent struts located at the side branch ostium are clearly visible.
“NCLCx OCT fuo post stent”: OCT (St. Jude/LightLab Imaging) at long-term after coronary stent implantation. Note the relatively thin tissue coverage and bifurcation region. The stent struts located at the side branch ostium are clearly visible.
Moving image 5
“St. Jude C7XR” is a self-explanatory video on the OCT catheter with voice-over.
“St. Jude C7XR” is a self-explanatory video on the OCT catheter with voice-over.
Table 1. OCT guidance in PCI: trial characteristics
| ILUMIEN IV | OCTOBER | RENOVATE | ||||
|---|---|---|---|---|---|---|
| ICI group | Angio group | ICI group | Angio group | ICI group | Angio group | |
| Year of publication | 2023 | 2023 | 2022 | |||
| ICI group | OCT | OCT | IVUS or OCT | |||
| Angio group | OCT | OCT | IVUS or OCT | |||
| Sample size | 2,690 | 1,201 | 1,639 | |||
| Treatment groups | 1,233 | 1,254 | 600 | 601 | 1,092 | 547 |
| Region | North America (USA and Canada), Europe, Middle East, and Asia-Pacific | Europe | South Korea | |||
| Setting | Medication-treated diabetes mellitus, and/or one or more complex lesions* | Bifurcations | Complex lesions* | |||
| Follow-up (months) | 24 | 24 | 24 | |||
| Primary endpoint | Cardiac death, TV-MI, or ID-TVR | Cardiac death, TL-MI, or ID-TLR | Cardiac death, TV-MI, or CD-TVR | |||
| Results | Primary endpoint occurred in 7.4% of patients in the OCT group and in 8.2% patients in the angiography group (HR 0.90, 95% CI: 0.67-1.19; p=0.45). | Primary endpoint occurred 10.1% of patients after OCT-guided PCI and in 14.1% of patients after angiography-guided PCI (HR 0.70, 95% CI: 0.5-0.98; p=0.035). | Primary endpoint occurred in 7.7% of patients in the ICI group and in 12.3% of patients in the angiography group (HR 0.64, 95% CI: 0.45 to 0.89; p=0.008). | |||
|
ꭞintravascular ultrasound assessment was implemented in 92 cases (15.3%) of the angiography-guided group. *complex lesions: ILUMIEN IV: 1) A target lesion responsible for either – Non–ST-segment myocardial infarction, defined as a clinical syndrome consistent with an acute coronary syndrome and a minimum troponin of 1 ng/dL (may or may not have returned to normal), or – ST-segment myocardial infarction >24 hours from the onset of ischaemic symptom. 2) Long or multiple lesions, defined as intended total stent length (continuous or separated) in any single target vessel ≥28 mm. 3) A bifurcation lesion intended for treatment with a stent in both the main branch and side branch wherein the side branch stent is ≥2.5 mm in diameter by angiographic visual estimation. 4) Angiographic severe calcification, defined as visible calcification on both sides of the vessel wall in the absence of cardiac motion. 5) A chronic total occlusion; randomisation is permitted only after successful crossing with antegrade wire escalation and pre-dilatation. 6) Diffuse or multifocal pattern in-stent restenosis with lesion at or within the existing stent margin(s). RENOVATE: 1) True bifurcation lesion (Medina 1,1,1/1,0,1/0,1,1) with side branch ≥2.5mm size; 2) Chronic total occlusion (≥3 months) as target lesion; 3) PCI for unprotected left main (LM) disease (LM ostium, body, distal LM bifurcation including non-true bifurcation); 4) Long coronary lesions (implanted stent ≥38 mm in length); 5) Multivessel PCI (≥2 major epicardial coronary arteries treated at one PCI session); 6) Multiple stents needed (≥3 more stent per patient); 7) In-stent restenosis lesion as target lesion Severely calcified lesion (encircling calcium in angiography). |
||||||
Table 2. Outcomes in OCT- versus angio-guided PCI trials according to the treatment group.
| ILUMIEN IV | OCTOBER | RENOVATE | ||||
|---|---|---|---|---|---|---|
| ICI group | Angio group | ICI group | Angio group | ICI group | Angio group | |
| Target vessel failure, (%) | 7.4 | 8.2 | 10.1 | 14.1 | 7.7 | 12.3 |
| HR (95% CI) | 0.90 (0.67 to 1.19) | 0.70 (0.50-0.98) | 0.64 (0.45–0.89) | |||
| Cardiac death, (%) | 0.8 | 1.3 | 1.4 | 2.6 | 1.7 | 3.8 |
| HR (95% CI) | 0.57 (0.25 to 1.29) | 0.53 (0.22-1.25) | 0.47 (0.24–0.93) | |||
| TV-MI, (%) | 2.5 | 3.3 | 6.6 | 8.2 | 3.7 | 5.6 |
| HR (95% CI) | 0.77 (0.48-1.22) | 0.79 (0.51-1.21) | 0.74 (0.45–1.22) | |||
| Spontaneous MI¥, (%) | 2.5 | 3.3 | 2.5 | 1.52 | 0.9 | 1.8 |
| HR (95% CI) | 0.77 (0.48-1.22) | 1.54 (0.66-3.56) | 0.66 (0.23–1.90) | |||
| TVR, (%) | 5.6 | 5.6 | 3.0 | 4.8 | 3.4 | 5.5 |
| HR (95% CI) | 0.99 (0.71-1.40) | 0.62 (0.34-1.13) | 0.69 (0.40–1.18) | |||
| TLR, (%) | 4.5 | 4.3 | 2.8 | 4.6 | 2.6 | 4.4 |
| HR (95% CI) | 1.05 (0.71-1.54) | 0.60 (0.32-1.13) | 0.66 (0.36–1.22) | |||
| Stent thrombosis**, (%) | 0.5 | 1.4 | 2.1 | 3.0 | 0.1 | 0.7 |
| HR (95% CI) | 0.36 (0.14-0.91) | 0.70 (0.34–1.47) | 0.25 (0.02–2.75) | |||
|
NR: not reported. *Target vessel/lesion revascularisation: ILUMIEN IV: ischaemia-driven; OCTOBER: ischaemia driven; RENOVATE: clinically driven. ¥Spontaneous myocardial infarction: ILUMIEN IV: target vessel; OCTOBER: target lesion; RENOVATE: target-vessel. **Stent thrombosis: ILUMIEN IV: definite or probable; OCTOBER: definite or probable; RENOVATE: definite. |
||||||
Table 3. Guidance trials: indications for OCT pullbacks and adopted definitions.
| ILUMIEN IV | OCTOBER | RENOVATE | |
|---|---|---|---|
| Expansion criteria | MSA of the proximal segment ≥90% of the proximal reference lumen area and MSA of the distal segment ≥90% of the distal reference lumen area). If both the proximal and distal reference segments have a minimal lumen area (MLA) ≥4.5 mm2, no further treatment is deemed necessary. | Stent expansion ≥90% of reference size in all treated segments | Visually assess that the residual angiographic diameter stenosis is <10% “and”: Non-LMCA lesions with MSA >80% of the average reference lumen area “OR” a MSA > 4.5 mm2 by OCT imaging. |
| Geographic miss criteria | Proximal and distal reference segment lumens (within 5 mm of the stent edge) each have an MLA of ≥4.5 mm2 | No residual edge disease or major lipid plaque. Residual stenosis less than 30% diameter. No major lipid plaque >180° arc degree in the edge segment | No untreated (residual) stenosis (defined as MLA ≥60% of adjacent reference segment lumen area) within 10 mm from proximal or distal stent edges |
| Edge dissection criteria | ≥60 degrees of the circumference of the vessel at site of dissection and ≥3 mm in length. i. Major (%): ≥60° of the circumference of the vessel at site of dissection and ≥3 mm in length. ii. Minor (%): any visible edge dissection <60° of the circumference of the vessel or <3 mm in length. | No edge dissections: 1) visible by angiography, or 2) located in residual edge stenosis of more than 30% DS or a lumen smaller than 4.5 mm2. (described in the Appendix of main paper) | No major edge dissection in the proximal or distal reference segments, defined as a location that is 5mm from the edge of the stent, extends to medial layer with potential to provoke flow disturbances (defined as ≥60° of the circumference of the vessel at the site of dissection and/or ≥3 mm in length of a dissection flap). |
| Malapposition criteria | Stent malapposition: frequency (%) of incompletely apposed stent struts, defined as stent struts clearly separated from the vessel wall without any tissue behind the struts with a distance from the adjacent intima of ≥0.2 mm and not associated with any side branch. Malapposition is classified as: Major: if associated with unacceptable stent expansion (as defined above). Minor: if associated with acceptable stent expansion (as defined above). If major malapposition is detected during the procedure in the OCT arm, further stent expansion must be performed. | Malapposition yes/no | No major malapposition (defined as an acute stent malapposition of ≥0.4 mm with longitudinal extension >1 mm) of the stent over its entire length against the vessel wall |
Francesco Prati, Flavio Giuseppe Biccirè
Updated on May 13, 2021
Bruno Scheller, Saarraaken Kulenthiran, Davor Vukadinović
Updated on August 29, 2024
Soo-Teik Lim, Tian-Hai Koh
Updated on February 1, 2018
Scot Garg, Sharmaine Thirunavukarasu, Raffaele Piccolo, Patrick W. Serruys, Stephan Windecker
Updated on January 23, 2018