Bruno Scheller, Saarraaken Kulenthiran, Davor Vukadinović
Stents and scaffolds
Updated on August 29, 2024
Non-hyperaemic pressure indices (NHPI), also known as resting pressure indices, allow the evaluation of the functional impact of coronary stenosis using intracoronary pressure guidewires without the need for dedicated drug administration. The instantaneous wave free ratio (iFR) was the first NHPI developed to circumvent the dependence of fractional flow reserve (FFR) on maximal coronary hyperaemia, which may be associated with patient discomfort and increased procedural costs and time. Upon demonstration of the efficacy of iFR, other NHPI have been developed. In this chapter we will review the basic principles behind iFR, as well as the validation studies and the results of clinical outcome studies that have established iFR as an evidence-based tool for the assessment of intermediate coronary stenoses recognised in the revascularisation guidelines. Data about the use of iFR in special clinical indications such as tandem stenosis, multivessel disease, left main stenosis location, acute coronary syndromes and aortic stenosis will be discussed. Further, we will review the value of iFR to assess disease pattern within a vessel and guide interventions, the co-registration of iFR with coronary angiography, and the assessment of functional PCI results. Other NHPI developed after IFR introduction will be also discussed.
Over the last decades, the evidence supporting the value of functional assessment of stenosis severity using pressure guidewires culminated in guideline-based recommendations for clinical use in European clinical practice guidelines . The use of pressure guidewires for this purpose has been further advanced by the introduction of instantaneous wave free ratio (iFR), an index that is both simpler than and equally effective as fractional flow reserve (FFR) in assessing stenosis severity. Further developments, facilitated by the fact that iFR is an adenosine-free index, contributed to modifying how intracoronary physiology is used in the catheterisation laboratory, going from being predominately a method to confirm the indication of revascularisation to a valuable way to guide revascularisation and make decisions in complex anatomical subsets. The following sections of this chapter will review the theory behind the use of iFR and other non-hyperaemic pressure indices (NHPI), available evidence supporting their value and practical aspects regarding their use in different anatomical and clinical settings.
As discussed in a previous chapter of this book, one of the prerequisites of FFR is that coronary pressure measurements must be obtained during maximal hyperaemia. The cornerstone of FFR is using a proportional relationship between the drop in intracoronary pressure across the stenosis and the decrease in maximal myocardial perfusion caused by that stenosis, and that proportionality is derived from the lineal coronary pressure-flow relationship that only takes place during maximal hyperaemia.
This requirement for adenosine or other potent vasodilators led to the quest of non-hyperaemic pressure indices. Around the time iFR was developed, it was widely accepted that the low adoption of FFR in clinical practice was related at least in part to the inconveniences resulting from the use of adenosine, ranging from patient discomfort to the cost and availability of the drug, to disruption of the routine established workflow in the catheterisation laboratory.
The advent of iFR was also facilitated by advances in intracoronary wire and computer technology that enabled on-line, instantaneous measurements of the translesional pressure ratio, eliminating the need for averaged coronary pressures, which had been used for the calculation of FFR since its inception.
How is it possible to use non-hyperaemic pressure measurements to characterise stenosis severity? The rationale of this alternative approach to FFR can be better understood when we examine the relationship between coronary flow and translesional pressure gradients. The mathematical relationship connecting both variables, shown in Figure 1, applies to both hyperaemic and non-hyperaemic indices and constitutes a fingerprint of the functional relevance of a coronary stenosis. Figure 1, shows the curvilineal, or non-lineal relationship between coronary flow and translesional pressure gradient. This is due to the fact that the contribution of friction (F) and separation or turbulence (S) associated with flow (Q) in generating a translesional pressure gradient (DP) is markedly different, as shown in the equation DP = FQ + SQ2. The functional severity of a coronary stenosis is thus reflected in a characteristic curve of the pressure gradient/flow relationship (Figure 1). The pressure gradient generated by a given stenosis will be part of the same curve, either at rest or after increasing myocardial flow by administering adenosine.
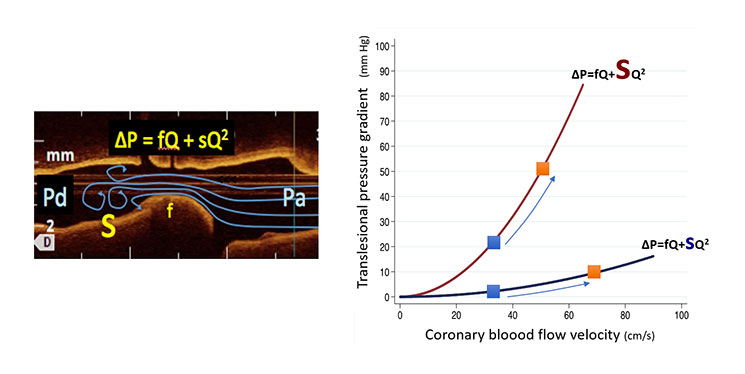
Relationship between trans-stenotic pressure gradient and coronary flow. The non-lineal character of the equation relating trans-stenotic pressure gradient (DeltaP) is a result of the interaction between friction (f) and separation or turbulent (s) components of the haemodynamic effect of the stenosis and coronary flow. The figure depicts the curves of a mild and a severe coronary stenosis (the size of the letter “s” denotes the turbulence-generating ability of the coronary stenosis). Blue squares denote flow in non-hyperaemic conditions, while orange squares indicate measurements during maximal hyperaemia. In other words, the modification of resting translesional pressure gradient by adenosine is a result of an increase in coronary flow occurring during hyperaemia.
It is important at this point to highlight several relevant facts related to the measurement of pressure gradients:
1) The pressure gradient versus flow curve applies to both hyperaemic and non-hyperaemic indices. In fact, the effect of hyperaemia is to displace the gradient value over the curve until the corresponding hyperaemic flow value (Figure 1).
2) In the coronary arteries, the pressure gradient varies over the cardiac cycle. At variance with hydraulic constant flow, coronary flow changes significantly over the cardiac cycle. As a result, the pressure gradient waveform mirrors that of coronary flow (Figure 2).
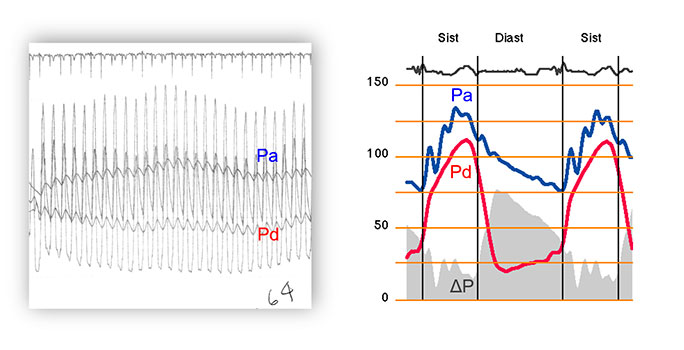
Average versus instantaneous pressure gradient in pressure-guidewire interrogation. The left panel in the figure shows how FFR was measured before the availability of dedicated FFR consoles. Averaged pressure measurements, obtained over several cardiac cycles, were used. This approach was subsequently continued with the arrival of dedicated FFR consoles. The right panel shows how, on the contrary, translesional pressure gradient varies instantaneously over the cardiac cycle, mirroring the waveform of phasic coronary flow. As a result of this, during diastole instantaneous pressure gradient has a much larger magnitude than that derived from the FFR-based technology described in left panel.
3) The magnitude of a translesional pressure measurement is determined by the time window over which it is obtained. As a legacy of the limited technology used at the time FFR was first proposed (i.e. saline-filled hollow guidewires only capable of transmitting dampened pressure signals), translesional pressure gradients based on averaged pressure measurements obtained over several heartbeats are used for both FFR and Pd/Pa. Alternatively, with current wire and computational technology, translesional pressure gradients can be selectively measured within a specific time window and within a single cardiac cycle. (Figure 3)
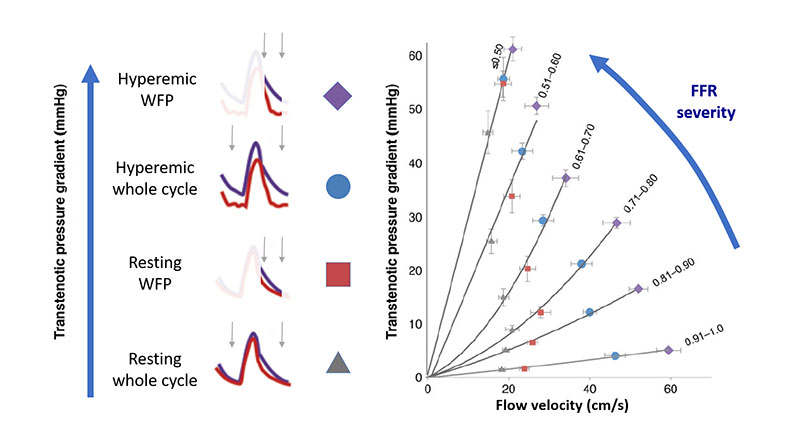
Translesional gradient modality with different sampling methodologies. Based on all discussed in Figures 1 and 2, the diagnostic efficiency of a pressure-based intracoronary index can be improved by either increasing flow with vasodilators or using specific sampling windows within the cardiac cycle. The graphic shows a family of curves depicting increasing functional stenosis severity and the location within each curve of measurements obtained with Pd/Pa, iFR, FFR or hyperaemic WFP measurements (i.e. measurements within the WFP during maximal hyperaemia). The data obtained to generate the figures was derived from the large European IDEAL registry, based on pressure and flow velocity interrogation of coronary stenoses in stable patients.
4) Under non-hyperaemic conditions, the microcirculation vasodilates in order to keep resting flow constant (Figure 4) .
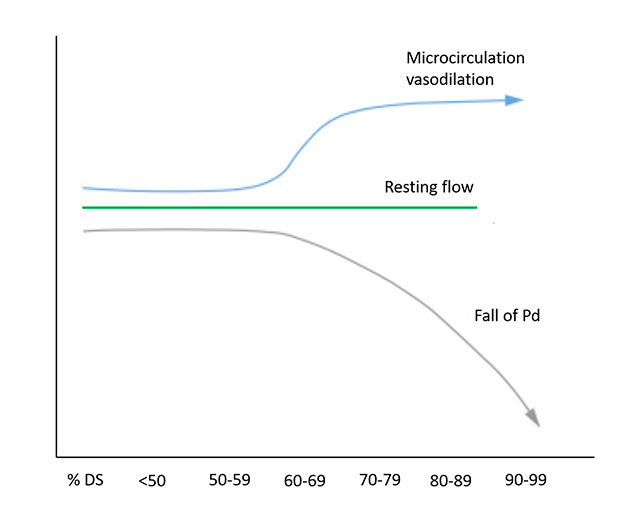
Non-hyperaemic coronary physiology in the context of increasing stenosis severity. The physiological impact of a coronary stenosis on the distal coronary bed can be quantified by a falling distal coronary pressure (Pd) in the resting state. %DS (% diameter stenosis). Modified from Nijjer et al (2).
These observations are important for appreciating how non-hyperaemic pressure measurements can unravel the haemodynamic effect of a stenosis. Increasing coronary flow facilitates differentiating functionally mild and severe stenoses. (Figure 1 and Figure 3). In that regard, FFR is better than Pd/Pa as a diagnostic tool. Yet, translesional pressure measurements obtained during the high-flow diastolic interval have a much higher discriminative power than Pd/Pa. Finally, the most powerful index in generating a pressure gradient through a stenosis is the hyperaemic wave free period (WFP) pressure ratio, a selective measurement within diastole associated with the administration of adenosine (an index close to the previously described diastolic FFR) (Figure 3).
FFR was developed following a model of coronary physiology in which, for the sake of simplicity, relevant aspects like collateral support and central venous pressure were removed from the initial FFRmyo model. Yet FFR retained the characteristic of being able to describe, in physiological terms, how a stenosis contributed to decreased myocardial blood flow. An FFR value of 0.75 somehow indicated that the interrogated stenosis caused a 25% impairment in blood supply to the subtended myocardium. The approach to validate iFR was different. The aim of iFR validation studies was to establish an iFR cut-off value with an ability similar to that of FFR to classify stenoses in terms of haemodynamic severity.
The diastolic window chosen for iFR interrogation was based on wave intensity analysis. Using this technique, a diastolic window free of waves, which was named the wave free period (WFP), was identified. Within the WFP, which started immediately after the backward decompression wave, there was a cessation of pressure waves originating either from the aorta or the microcirculation. The WFP window was calculated beginning 25% of the way into diastole (identified from the dicrotic notch) and ending 5 ms before the end of diastole (identified from ECG). During the WFP, microcirculatory resistance presented the lowest and more stable value documented over the whole cardiac cycle under resting conditions. Interestingly, microcirculatory resistance values measured at rest within the WFP were virtually identical to those obtained with whole-cycle, averaged measurements of pressure and flow during maximal hyperaemia (in other words, with a whole-cycle averaged approach similar to FFR). iFR was then calculated as the mean pressure distal to the stenosis during the diastolic wave-free period, divided by mean aortic pressure during the diastolic wave-free period.
Thus, in this first approach and in contrast to FFR, calculation of iFR relied on the analysis of both pressure waveforms and ECG signals. Furthermore, as time delay in Pa- and Pd-based waveforms occurring as a result of different wave of transmission (hydraulic and electric, respectively) might lead to an artefactual diastolic pressure gradient, in iFR, both pressure waveforms were aligned at the time of pressure equalisation to ensure that any difference in pressure over the WFP truly reflected a haemodynamic effect of the interrogated stenosis. Further versions of the iFR algorithm allowed automatic detection of the WFP based solely on the pressure waveform. In the following sections we will discuss the validation of iFR in different study designs. (Figure 5)
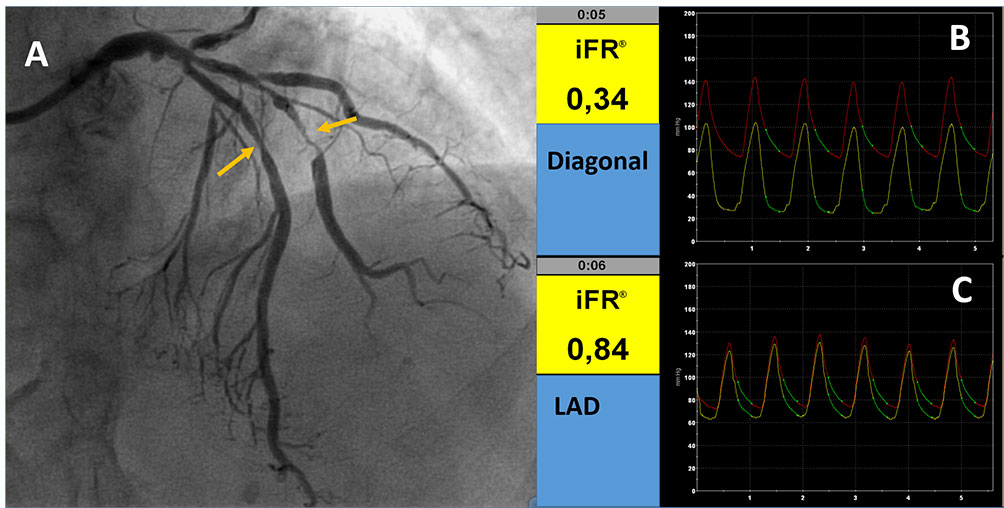
Examples of iFR evaluation. A: Angiographic image showing stenoses in LAD and diagonal (yellow arrows) iFR in the diagonal branch (B) and LAD (C) indicating the functional impact of the 2 stenoses. The green line in B and C indicates the wave free period in which the index is calculated.
The iFR concept has been tested in a number of validation studies with different designs, ranging from a direct comparison with FFR, to head-to-head comparison with FFR against non-invasive test of myocardial ischemia and, finally, to non-inferiority randomised clinical trials using FFR as comparator. In the next sections, these studies will be analysed in detail.
(Table 1)
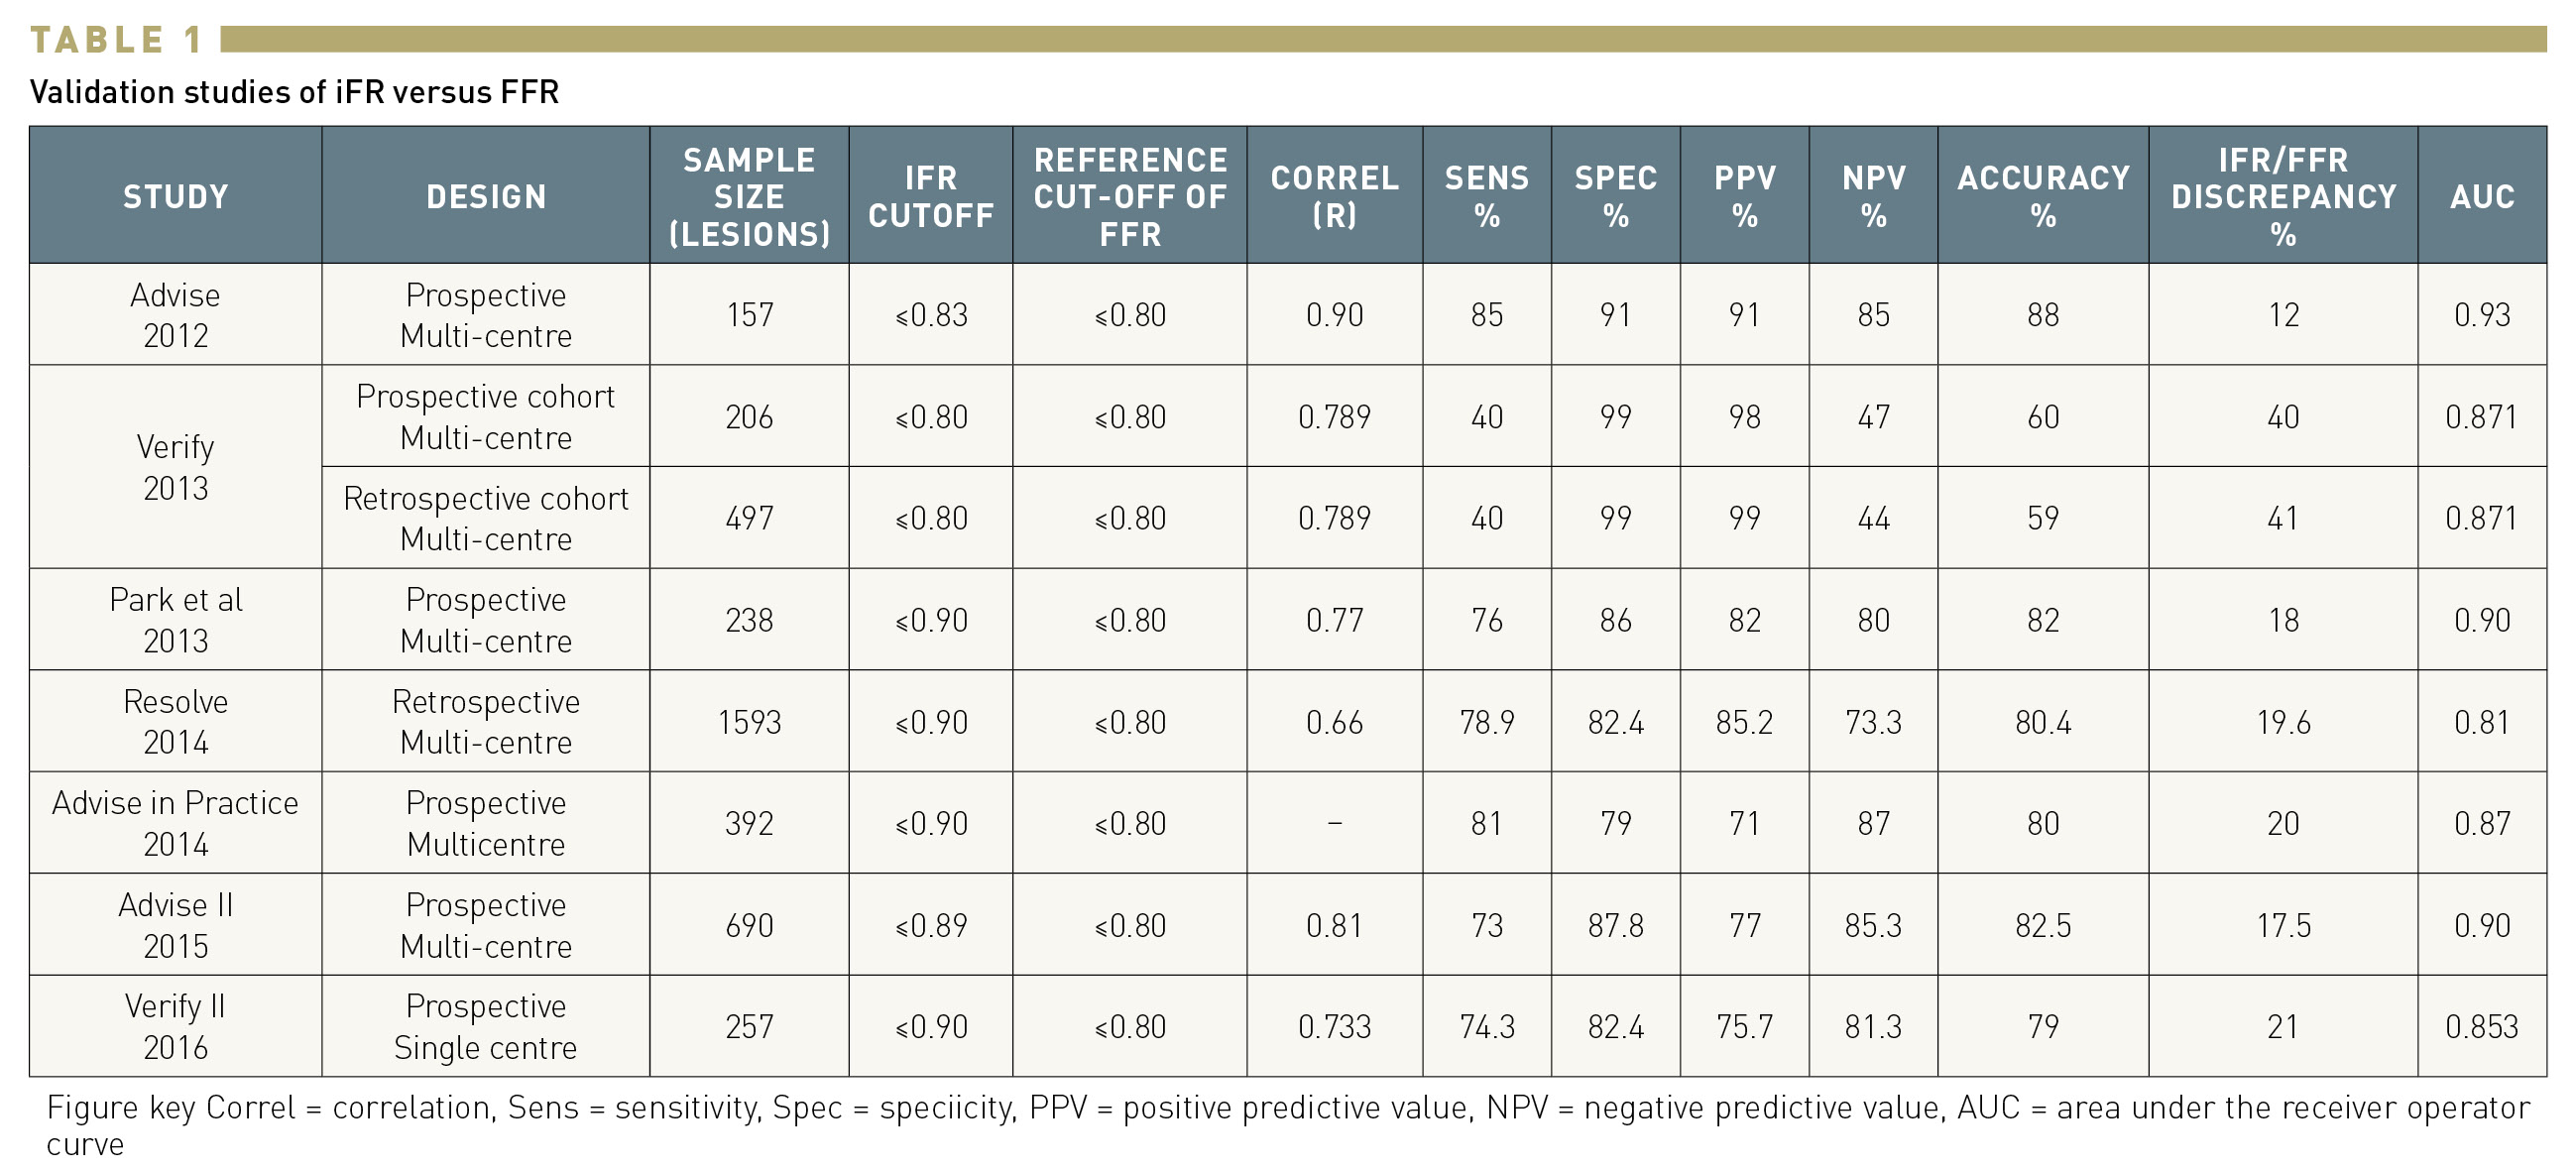
ADVISE (Adenosine Vasodilator Independent Stenosis Evaluation) was the first study assessing the diagnostic performance of iFR against FFR. In a series of 157 coronary stenoses, iFR was significantly and closely correlated with FFR (r=0.9, p <0.001). A cut-off value of iFR ≤0.83 was used in this study, showing good diagnostic accuracy. The receiver operating characteristics (ROC) area under the curve (AUC) of iFR to predict an FFR<0.8 was 0.93 with specificity, sensitivity, and negative and positive predictive values of 91%, 85%, 85%, and 91%, respectively. The article reporting the results of the ADVISE study was also the first to include the rationale and technique of iFR.
Soon after the publication of ADVISE, a collaborative study (VERIFY) showed that lower cut-off points of iFR (0.80 and 0.83) had lower diagnostic accuracy. These results were discouraging, but were soon outdated by several new comparisons of iFR with FFR in different clinical scenarios (Figure 6). The ADVISE multicentre international registry evaluated the classification agreement of iFR and FFR in 339 intermediate coronary stenoses, reporting an area under the curve of 0.86 (for an FFR<0.80). The iFR value of 0.89 was determined as the best cut-off value to predict an FFR below 0.80. A registry in an Asian population with 238 lesions showed a significant iFR-FFR correlation with an r =0.77. The AUC of iFR to predict an FFR<0.80 was 0.9 and the best cut-off value for iFR was ≤0.90 with sensitivity, specificity, positive and negative predictive values, and diagnostic accuracy of 76%, 86%, 82% and 80%, and 82%, respectively.
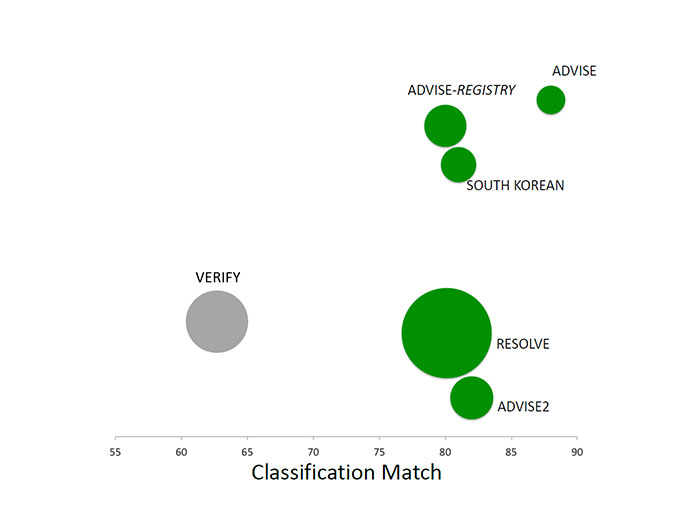
Classification match in studies comparing iFR versus FFR as a reference standard.
The ADVISE in Clinical Practice registry assessed 392 intermediate stenoses and demonstrated that iFR maintained a high level of agreement with FFR when measured in clinical practice with commercially available systems (0.87 AUC for FFR<0.80, classification match 80%, and optimal iFR cut-off of ≤0.90).
While the number of studies on iFR was increasing, one of the major limitations was that the algorithm used to calculate iFR varied from study to study. In order to provide an independent validation, the investigators of the RESOLVE study pooled data from 1,593 lesions included in prior studies at 15 clinical sites. A comparison of iFR and FFR was then performed using a single algorithm in a central core laboratory. Of note, the pooled data included the VERIFY study. The optimal iFR cut point for FFR<0.80 was ≤0.90 with an overall accuracy of 80.4%.
One of the limitations of a retrospective registry like RESOLVE is that the pressure tracings used in the central core laboratory had been obtained without concomitant ECG, which was used to determine the wave free period. To outline the diagnostic value of the iFR algorithm to be implemented in the first commercially available system, the investigators of the ADVISE II international multicentre study prospectively interrogated 690 lesions with a pressure guidewire in an strictly standardised fashion. The results of the study demonstrated a strong correlation between FFR and iFR (r = 0.81, 95% CI: 0.78 to 0.83, p < 0.001). The AUC in ROC analysis was 0.90 (95% CI: 0.88 to 0.92, p < 0.001) and the optimal cut-off value was ≤0.89. Using this cut-off, iFR correctly classified 82.5% of total stenoses (primary endpoint of the study), with a sensitivity of 73.0% and specificity of 87.8%. ADVISE II also demonstrated that the use of a hybrid FFR/iFR algorithm, in which FFR was selectively used to interrogate stenoses with iFR values around its cut-off value, had a very high diagnostic accuracy (94.2% CI: 92.2% to 95.8%). These findings were subsequently translated to the design of the SYNTAX II trial, the first prospective study using iFR for decision-making. The VERIFY II registry evaluated 257 stenoses and used a cut-off value of ≤0.90 for iFR. Diagnostic accuracy versus FFR≤0.80 was calculated with a misclassification rate of 21%. Similar accuracy (79.9%) of an iFR value of <0.90 to predict and FFR≤0.80 was reported in a registry of 763 patients comparing iFR with FFR and contrast FFR (AUC 0.88). A small study evaluated the diagnostic performance of iFR in the setting of non-culprit artery stenosis in patients with ST-elevation myocardial infarction (STEMI). FFR and iFR measurements were obtained at the time of primary PCI and at a staged procedure in 66 non-culprit lesions in 50 patients. ROC analysis showed a high accuracy of iFR to identify an FFR≤0.80 with an AUC of 0.95. For an iFR cut-off value of 0.89, the sensitivity, specificity, and positive and negative predictive values were 95%, 90%, 86% and 97%, respectively.
In summary, validation studies demonstrated that iFR and FFR values are closely correlated and that iFR has a good diagnostic accuracy to predict an FFR<0.80.
(Table 2)
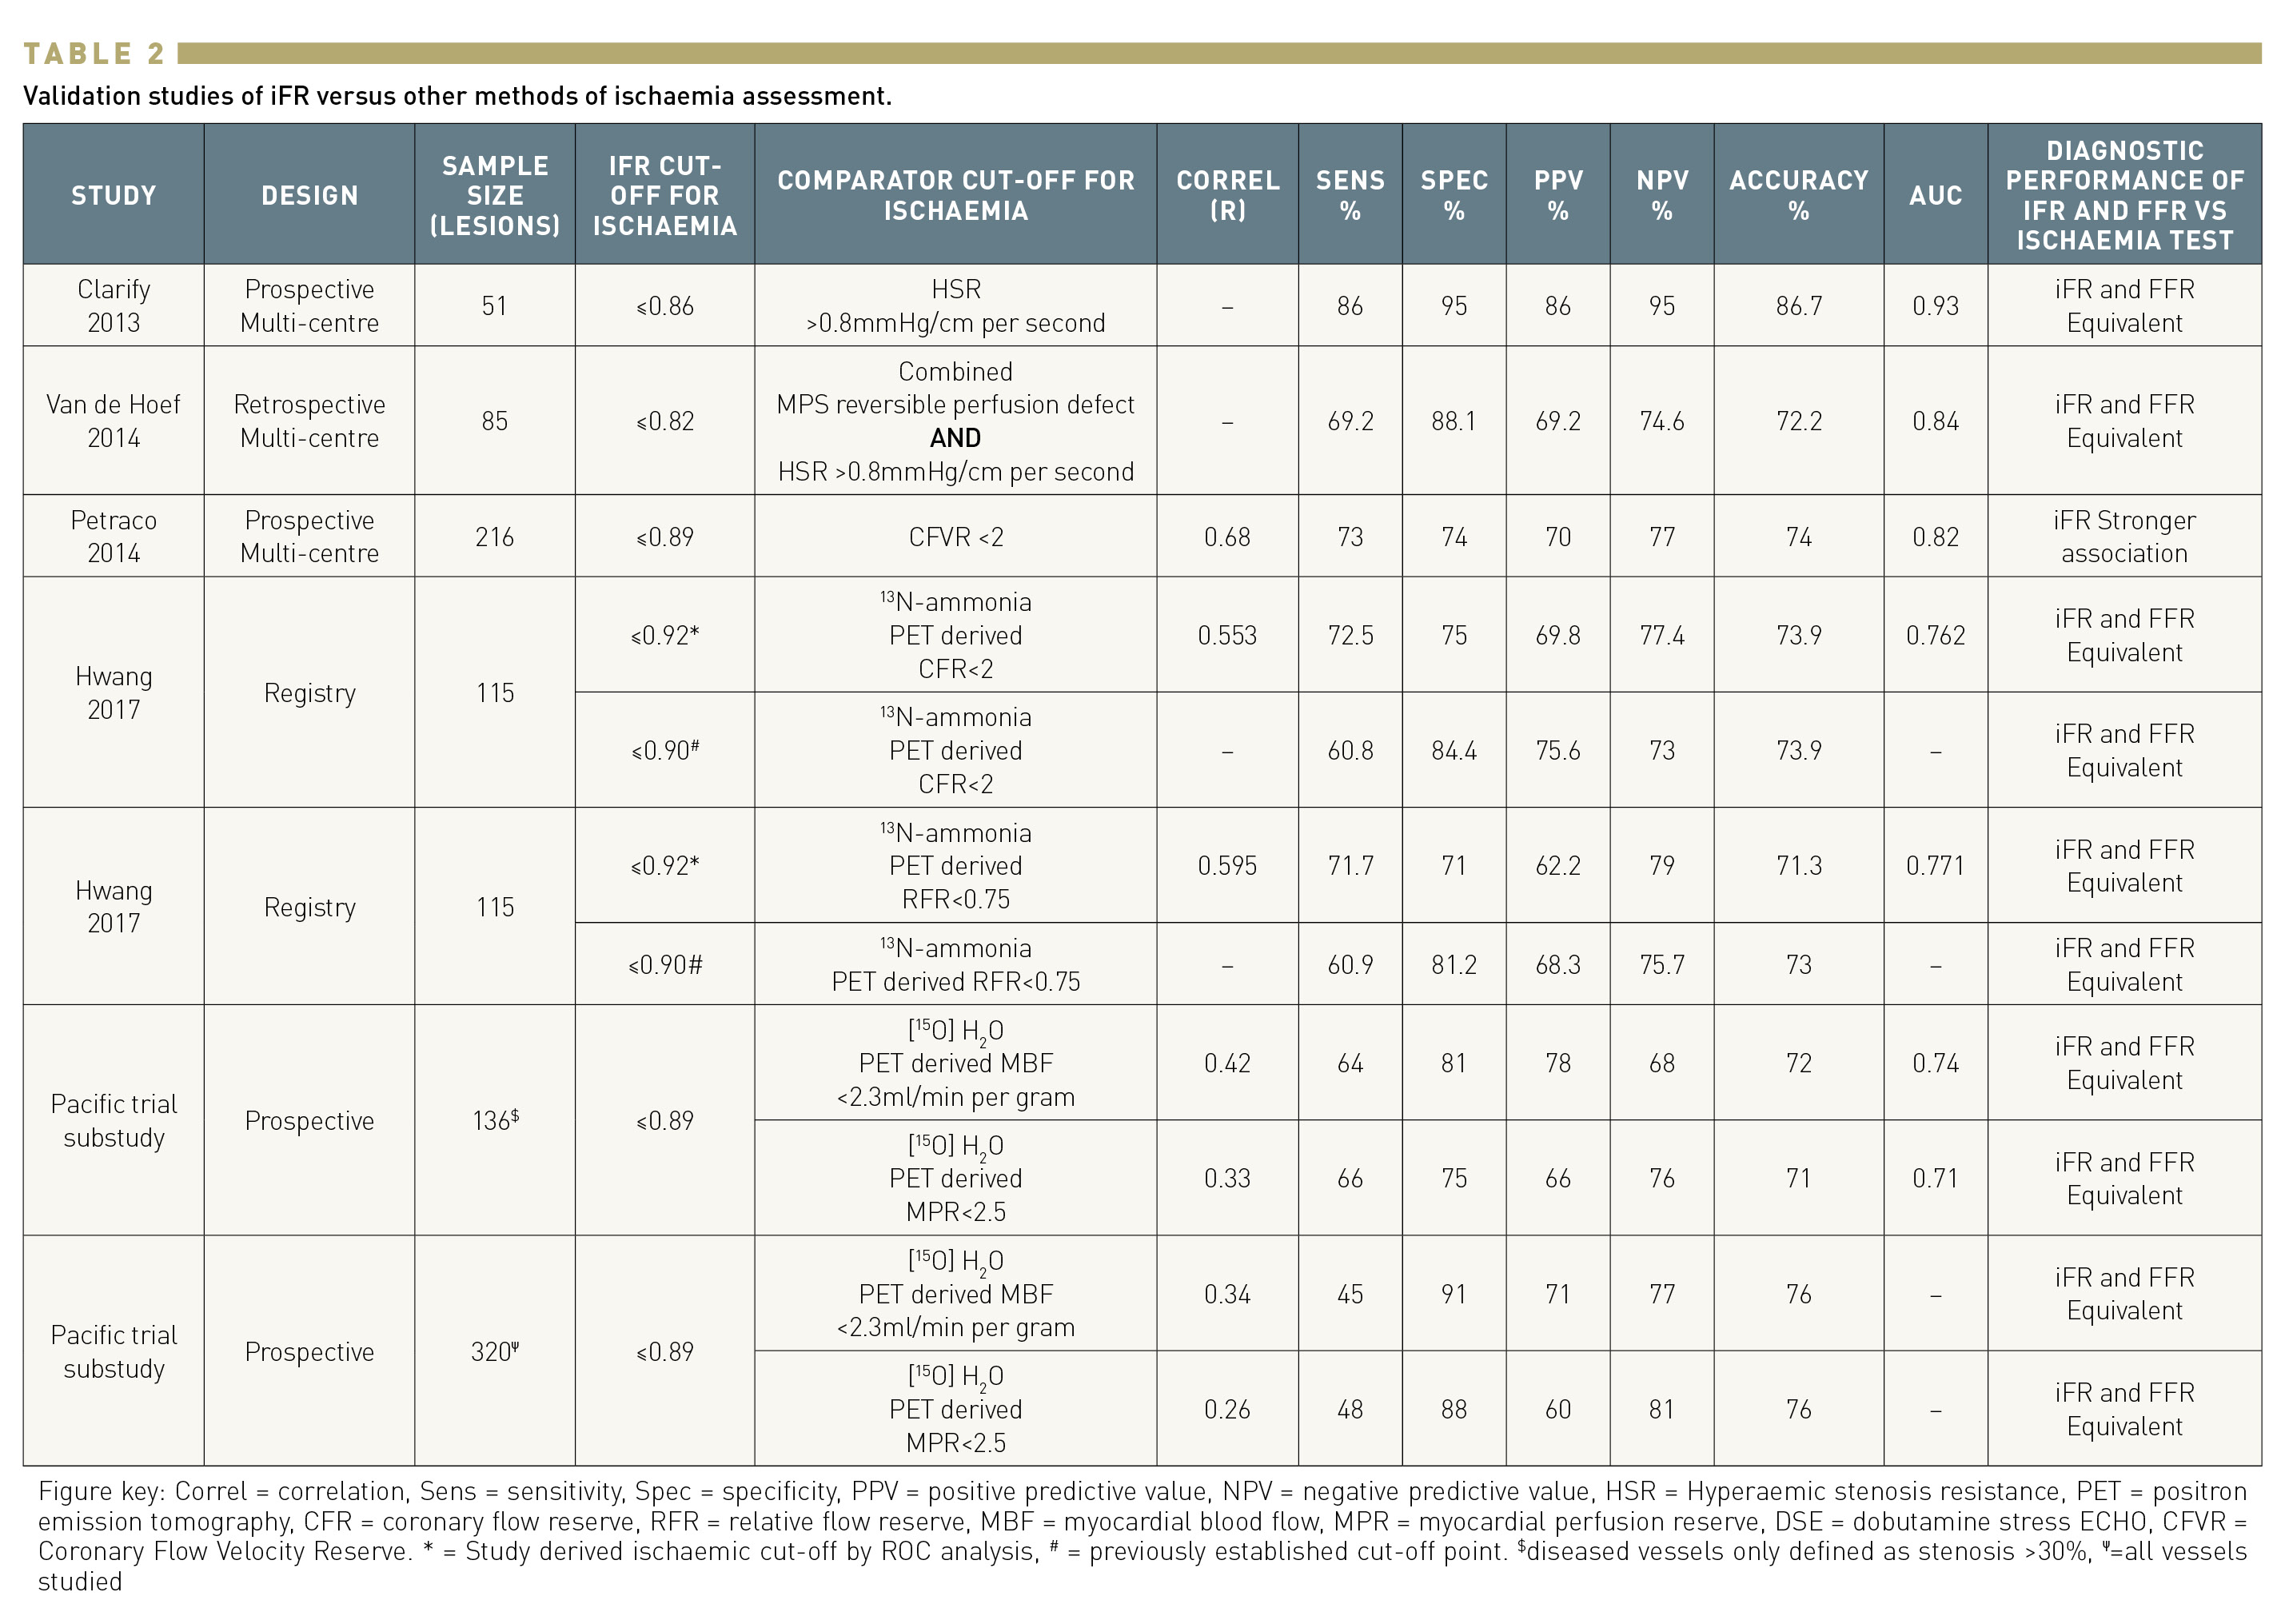
All previous studies had the common limitation of using FFR as the standard of reference. To circumvent this shortcoming, IFR was validated against different invasive and non-invasive tests of ischaemia, in most cases following a head-to-head comparison with FFR. The CLARIFY study evaluated the iFR and FFR agreement with hyperaemic stenosis resistance (HSR), a combined pressure and flow index that calculates the resistance of the stenosis, therefore circumventing limitations of pressure-only indices. Fifty-one stenoses were evaluated, showing similar diagnostic performance of iFR and FFR with HSR giving an AUC of 0.93 for iFR versus 0.96 for FFR, p = 0.48. Another study by Van de Hoef et al. used HSR and myocardial perfusion scintigraphy as the reference to determine the presence of ischaemia. Their results demonstrated similar diagnostic value of iFR and FFR with similar AUC (0.84, and 0.88, respectively; p≥0.20) . Two studies evaluated the diagnostic performance of iFR against PET as the gold standard for ischaemia detection. A first study assessed a total of 115 consecutive patients with left anterior descending artery stenosis. The optimal cut-off values and diagnostic performance of FFR and iFR against 13N-ammonia PET-derived coronary flow reserve (CFR) and relative flow reserve (RFR) were tested. iFR and FFR showed similar diagnostic accuracies to predict a CFR <2.0 (FFR 69.6%, iFR 73.9%) and RFR <0.75 (FFR 73.9%, iFR 71.3%). De Waard et al. tested the diagnostic performance of iFR and FFR against [15O]H2 PET hyperaemic myocardial blood flow (MBF) in 320 coronary arteries (136 stenoses). Both indices showed similar AUC (0.78 [95% confidence interval (CI): 0.70–0.85] for FFR, 0.74 (95% CI: 0.66–0.81) for iFR). In coronary stenoses, the diagnostic accuracy compared with impaired PET MBF was 72% (95% CI: 64–79%, К: 0.44) for FFR ≤0.80, 72% (95% CI: 64–80%, К: 0.44) for iFR≤ 0.89.
Finally, one study evaluated the performance of iFR and FFR against invasive coronary flow reserve (CFR) in 216 stenoses and reported a significantly stronger correlation and higher diagnostic performance for iFR (iFR AUC 0.82 versus FFR AUC 0.72; P<0.001, for a CFVR of 2).
In summary, head-to-head comparisons of iFR and FFR against other indices of stenosis severity or myocardial ischaemia demonstrated a similar diagnostic precision for both techniques. Interestingly, iFR was found to correlate better with CFR than FFR.
The ultimate proof to demonstrate the value of iFR in clinical practice was the conduct of randomised clinical trials using clinical outcomes comparing iFR- and FFR-based revascularisation. Two large randomised clinical trials evaluated whether iFR was a safe and feasible alternative to FFR to guide revascularisation. Both studies used a single cut-off point of ≤0.89 for iFR.
DEFINE-FLAIR (Functional lesion assessment of intermediate stenosis to guide revascularisation) was a prospective, multicentre, international, non-inferiority, double blinded trial in which 2,492 patients with intermediate-severity coronary artery lesions were randomised in a 1:1 ratio to undergo either iFR-guided or FFR-guided coronary revascularisation. Both patients with stable angina and non-culprit lesions in patients with acute coronary syndromes (ACS) were included. The primary endpoint was the one-year risk of major adverse cardiac events (MACE), a composite of death from any cause, nonfatal myocardial infarction, or unplanned revascularisation. The non-inferiority margin was 3.4%. The results demonstrated that iFR was noninferior to FFR to guide revascularisation with similar outcomes in both groups at one year (MACE occurred in 78 of 1,148 patients (6.8%) in the iFR group and in 83 of 1,182 patients (7.0%) in the FFR group (difference in risk, −0.2 percentage points; 95% CI −2.3 to 1.8; P<0.001 for noninferiority; HR 0.95; 95% CI, 0.68 to 1.33; P = 0.78)). No differences were observed in death and the individual components of MACE. The study also demonstrated a shorter procedural time (40.5 minutes vs 45.0 minutes, P = 0.001) and a lower occurrence of adverse symptoms during the procedure (39 patients [3.1%] vs 385 patients [30.8%], P<0.001) for patients who underwent iFR.
iFR SWEDEHEART (Evaluation of iFR vs FFR in Stable Angina or Acute Coronary Syndromes) had a different study design. It was an open-label, multicentre, registry-based randomised clinical trial using the Swedish Coronary Angiography and Angioplasty Registry (SCAR) for enrolment. The study population (2,037 patients) was similar to DEFINE-FLAIR, evaluating intermediate coronary stenoses in stable angina and in non-culprit vessels in ACS patients that were randomised 1:1 to iFR- or FFR-guided revascularisation. The primary endpoint was similar to the one described for DEFINE-FLAIR (one-year risk of MACE defined as a composite of death from any cause, nonfatal myocardial infarction, or unplanned revascularisation) with a noninferiority margin of 3.2%. Concordantly with DEFINE-FLAIR, the results confirmed noninferiority of the iFR guided revascularisation strategy with an occurrence of the primary endpoint event at one year in 68 of 1,012 patients (6.7%) in the iFR group and in 61 of 1,007 (6.1%) in the FFR group (difference in event rates, 0.7 percentage points; 95% CI, −1.5 to 2.8; p = 0.007 for noninferiority; HR 1.12; 95% CI 0.79 to 1.58; p = 0.53). Also in concordance with DEFINE FLAIR, more patients in the FFR group had chest discomfort during the procedure (68.3% vs 3.0% , p<0.001).
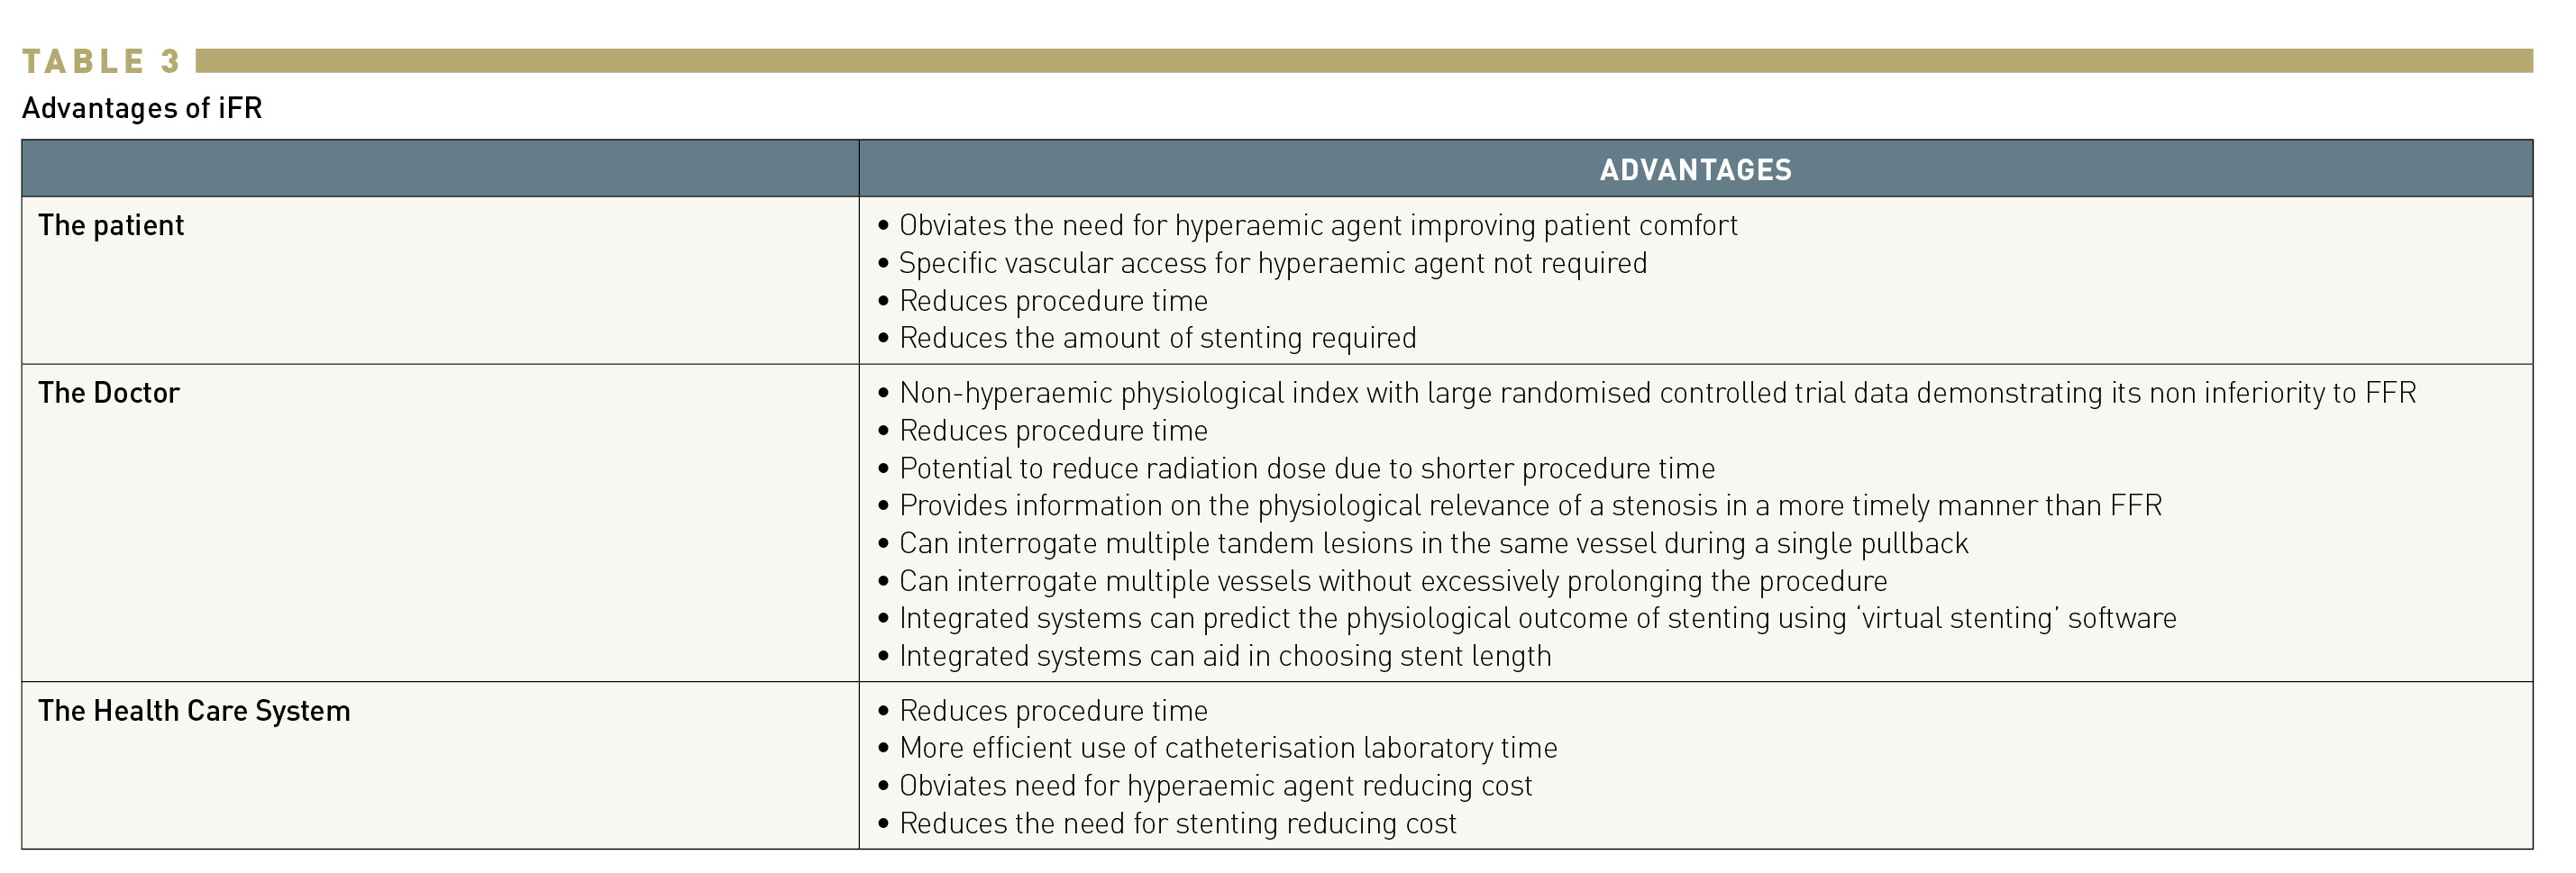
A pooled patient-level analysis of these two studies at one year of follow-up demonstrated that a significantly higher proportion of patients were deferred in the iFR-guided than in the FFR-guided strategy (1,117 patients (50%) vs 1,013 patients (45%) (p < 0.01)). However, the one-year MACE rate in the deferred population in the iFR and FFR groups was similar (4.12% vs 4.05%; HR: 1.13; 95% confidence interval: 0.72 to 1.79; p = 0.60). Reasons for lower deferral with FFR might be related to the higher correlation between iFR and subtended myocardial flow, demonstrated in previous head-to-head comparisons of iFR and FFR against CFR and in studies investigating the causes behind the discrepancy between iFR and FFR in some cases, . (Table 3)
A pre-specified subanalysis of the IFR SWEDEHEART trial reporting five-year follow-up has been published, showing no differences between iFR- and FFR- guided revascularisation strategies in terms of MACE (21.5% vs 19.9%, HR 1.09; 95% CI 0.90-1.33), all cause death (9.4% vs 7.9%, HR 1.20; 95% CI 0.92-1.62), nonfatal myocardial infarction (5.7% vs 5.8%, HR 1.00; 95% CI 0.70-1.44), unplanned revascularisation (11.6% vs 11.3%, HR 1.02; 95% CI 0.76-1.32) and cardiovascular death (2.8% vs 3.2%, HR 0.85; 95% CI 0.51-1.40)22. A similar analysis reporting the five-year follow-up of DEFINE FLAIR showed no significant difference in MACE between iFR- and FFR-guided groups (21.1% vs 18.4% HR 1.18 (95%CI 0.99-1.41 p=0.07)). Similar non-fatal MI or unplanned revascularisation rates were documented in both study arms (MI 6.3 for iFR vs 6.2 for FFR, HR 1.04 95%CI 0.76-1.42 p=0.80; unplanned revascularisation 11.9% for iFR vs 12.2% for FFR, HR 1.01 95%CI 0.80-1.29 p=0.96), while all-cause mortality occurred more frequently in the iFR arm (iFR 9.0% vs FFR 6.2% HR 1.51 (95% CI 1.22-2.90 p=0.01). The significant difference in all-cause death between study arms noted in the DEFINE FLAIR five-year follow-up is counterintuitive not only because of the difference with the results of the five-year subanalysis of IFR SWEDEHEART, but also because other endpoints more likely to be affected by inadequate decision-making, like non-fatal MI and unplanned revascularisation, show similar rates in the FFR and IFR arms. A potential explanation for the difference in mortality rates between the iFR SWEDEHEART and the DEFINE-FLAIR trials is that the extended 5-year follow-up took place during the COVID-19 pandemic, which influenced the outcome evaluation of several major studies between 2019 and 2021 . At variance with iFR SWEDEHEART, which was conducted in Northern European countries with a universal patient follow-up system, DEFINE FLAIR was conducted in 19 countries in 4 different continents, leading to more heterogeneous event reporting. Supporting this hypothesis is the fact that more than half of the events classified as cardiovascular deaths were deaths of unknown origin. Along with the fact that DEFINE FLAIR was not powered for the detection of all-cause mortality as an individual endpoint, a play of chance appears as a plausible option to explain the significant difference in all-cause death noted in this trial.
Before publication of the five-year subanalysis of DEFINE FLAIR, two study-level meta-analyses on the five-year follow-up of both trials were published, reporting an increased risk of all-cause mortality (driving an increased risk of MACE) in the iFR arms, . As these study-level metanalyses are based on only two trials with heterogeneity regarding mortality, the results are difficult to interpret.
Currently, both iFR and FFR have a class IA recommendation for indicating revascularization in patients with chronic coronary syndromes according to European guidelines . Upcoming pooled patient-level analyses of those trials and large registries comparing iFR and FFR guided revascularization will shed further light on this topic.
The five-year follow-up of iFR SWEDEHEART confirmed no differences in MACE or its individual components between FFR and iFR. The five-year follow-up analysis of DEFINE FLAIR showed no difference in MACE between the 2 arms with similar MI and revascularisation rates but a higher rate of all-cause mortality in the iFR arm. Two study-level metanalyses based on these 2 studies have shown an increased all cause-mortality in the iFR group at five-year follow-up without differences in MI or revascularisation. These findings are derived from only 2 studies with heterogeneous results in terms of all-cause mortality and the results should be interpreted with caution.
Several studies have addressed the possible mechanisms of discordance between FFR and iFR. Cook et al. evaluated baseline and hyperaemic coronary flow velocity and CFR measured with Doppler in patients with disagreement in stenosis severity classification between iFR and FFR. In FFR+/iFR– discordants, hyperaemic flow velocity and CFR were similar to both FFR–/iFR– and unobstructed groups; In FFR–/iFR+ discordants, hyperaemic flow velocity, and CFR were similar to the FFR+/iFR+ group. These results suggest that i) differences between FFR and iFR can be explained by differences in hyperaemic flow and ii) iFR correlates with coronary hyperaemic flow and CFR better than FFR. These results have been confirmed in a separate study involving 647 lesions derived from the DEFINE-FLOW and IDEAL registries, which showed that flow parameters of FFR-/iFR+ stenoses are similar to those of FFR+/ iFR+ stenoses, suggesting that coronary revascularisation could be indicated when this type of mismatch is found. The mechanisms of iFR/FFR discrepancy have been further tested in a study using PET that included 113 patients. PET-derived indices such as myocardial blood flow (MBF), CFR, microvascular resistance, and trans-stenosis resistance were compared between patients with discordant results (FFR≤ 0.80/ iFR≥0.90) and those with concordant abnormal results (FFR≤ 0.80 and iFR<0.90). Resting MBF was similar in the two groups, but patients with discordant FFR and iFR results showed higher hyperaemic MBF and CFR, compared with the concordant abnormal group (p = 0.003 and p < 0.001, respectively).
Warisawa et al. sought to determine if the pattern of stenosis was a factor influencing discordance between iFR and FFR. In concordance with previous findings, most discordances occurred around the cut-off points of iFR and FFR. Using pullback assessment, they found that iFR+/FFR- was more frequently found in diffuse pattern of disease, while iFR-/FFR+ was more common in focal stenosis. The explanation for these findings is that in the context of diffuse disease, frictional losses along the whole length of the vessel would be the predominant mechanism of pressure loss, with minimal change during hyperaemia resulting in an iFR+/FFR-, while in the context of focal stenosis, a large change in pressure loss could be expected during hyperaemia resulting in iFR-/FFR+.
Lee et al. evaluated the differences in clinical and angiographic characteristics in patients with iFR and FFR discordance. This substudy from the 3V FFR-FRIENDS study evaluated 975 vessels (393 patients) with available pre-intervention FFR and iFR. In a multivariate analysis the authors found that female sex, diabetes mellitus, smaller reference vessel diameter, and higher %DS were significant predictors of low iFR and high FFR. Some of these factors, such as diabetes and female sex, are also associated with microvascular dysfunction, and this could be one of the mechanisms explaining the discordance in this group. Conversely, male sex, absence of diabetes mellitus and lower %DS were significantly associated with high iFR and low FFR. In this group, the disagreement between the 2 indices might be mediated by the presence of a high CFR (the low prevalence of predictors of microvascular dysfunction in this group would support this hypothesis).
All of the above reinforces the concept that the discrepancy of iFR and FFR values is largely modulated by differences in subtended myocardial flow. The main question is whether this discrepancy may result in different patient outcomes. A substudy of 3V-FFR-FRIENDS evaluated the influence of discordance between FFR and iFR on clinical outcomes. Patients (n=374) with deferred lesions (n=827) were included and MACE (a composite of cardiac death, myocardial infarction, and ischaemia-driven revascularisation) at two years was assessed. The study showed that discordance between FFR and iFR was not associated with an increased risk of MACE. The only group with an increased risk of MACE at two years was the one with abnormal values of both FFR and iFR.
The lack of clinical relevance of iFR and FFR disagreement can be explained because most of the disagreements occur in the FFR grey zone (between 0.75 and 0.80). Studies that evaluated FFR against test of myocardial ischaemia identified FFR 0.75 as the optimal FFR cut-off and the DEFER study demonstrated the safety of this “ischaemic” cut-off for deferral. Later, the FFR≤0.80 “clinical cut-off” was implemented in large clinical trials to improve the negative predictive value of FFR in order to avoid leaving significant lesions untreated. Clinical outcome studies using FFR support the finding that in the FFR grey zone, it is equally safe to defer or treat the stenosis. Most of the disagreements between iFR and FFR fall in the FFR grey zone and it is therefore unlikely that they will have prognostic impact.
In summary, discordance between resting and hyperaemic pressure-derived indices is the result of a complex interaction of clinical, anatomical and physiological characteristics of the patient and the lesion. All these aspects should be considered in the revascularisation decisions in the population with discordant measurements. From an overall perspective, discrepant iFR/FFR values typically occur close to the iFR cut-off value, and do not have a detectable influence on the safety of decision-making with either of the two indices.
The use of physiology guidance in the revascularisation of left main (LM) stem stenosis has long been controversial, particularly because left main stenosis has often been an exclusion criterion in clinical studies. Evidence supporting the safety of FFR to defer revascularisation in LM is typically based on studies comparing outcomes of deferred revascularisation patients based on non-ischaemic FFR with those undergoing revascularisation on the grounds of ischaemic FFR values. Applying the same study design, Warisawa examined this issue using iFR to guide revascularisation in a multicentre registry study. In the DEFINE-LM registry, patients were included if they had a moderate LMS stenosis (40-70%), regardless of whether the stenosis extended to the bifurcation and/or to the ostial LAD or LCx arteries. The iFR reading was taken just distal to the stenosis in the LMS or, in the presence of ostial LAD or LCx disease, iFR testing in both vessels could be performed using the lower iFR value obtained for decision-making. The outcome assessed was MACE (composite of death, non-fatal MI, ischaemia-driven target lesion revascularisation). From a total of 314 patients, 163 were deferred and 151 were revascularized (using either CABG (43.7%) or PCI (56.3%)). No differences were observed in survival estimates at four years between groups: 90.8% versus 85.4% in the deferred versus revascularized groups respectively (HR 1.45, 95% CI 0.75-2.81, p=0.26). Likewise, there were no differences in the individual components of the primary endpoint. Although better outcomes were not seen in the deferral group, these results are consistent with other observational studies using FFR to determine revascularisation decisions in the context of left main stenosis. However, no evidence of increased harm was noted using iFR to defer revascularisation in this cohort, suggesting that decision-making based on iFR is safe. A subsequent analysis of this registry evaluated the outcomes of patients with iFR ≤0.89 that were deferred versus those revascularized. At three-year follow-up, the primary endpoint was significantly reduced in the interventional arm (HR 0.42, 95% 0.20-0.89). For what concerns the relationship between iFR and FFR in LM stenoses, data have showed a moderate concordance rate between those two indexes. In the iLITRO-EPIC07 study, 300 patients with LM intermediate stenoses underwent both iFR and FFR evaluation and, in case of discordance, minimal lumen area (MLA) measurement with intravascular ultra sound (IVUS). Overall, an agreement of 80% was found, with similar rates of positive (FFR-/iFR+, 31 lesions) and negative (FFR+/ iFR-, 29 lesions) mismatches. The rates of not-significant MLA values (> 6 mm) were numerically lower in FFR negative lesions (8.7%) compared to iFR negative ones (14.6%). Overall, an hybrid approach involving IVUS assessment of discordant lesions was effective, with comparable MACE rates between the deferred and the revascularized groups (HR 0.71, 95%CI (0.30-1.72),p= 0.45). Considering that in the DEFINE-FLAIR trial LM stenoses were excluded and that in the iFR SWEDEHEART only a very limited number of these patients were enrolled, there are currently no randomized data comparing the effectiveness of these two indexes in this setting. Both iFR and FFR have a class IA recommendation for indicating revascularization in patients with chronic coronary syndromes according to European guidelines, no specific recommendations about the different indices are provided for LM evaluation, .
A published analysis of DEFINE FLAIR has addressed the issue of the safety of physiology-based deferral in stenosis located in the LAD. A previous study using FFR as the reference standard had suggested that resting indices were less accurate in evaluating stenosis severity in the LAD than in other vessels with higher incidence of false negatives in this territory. However, the LAD analysis of DEFINE-FLAIR including 872 deferred LAD lesions (421 guided by FFR, 451 guided by iFR) demonstrated a significantly lower event rate when iFR was used in comparison with FFR (2.44% vs 5.26%; adjusted HR: 0.46; 95% confidence interval [CI]: 0.22 to 0.95; p=0.04). This difference was mainly driven by the lower incidence of unplanned revascularisations in LAD lesions deferred with iFR (2.22% iFR vs 4.99% FFR; adjusted HR: 0.44; 95% CI: 0.21 to 0.93; p=0.03). This could be explained by the discordance between FFR and CFR in a subgroup of LAD stenosis. Patients with normal FFR but abnormal CFR have a higher event rate. Additionally, as it has been previously shown, the agreement between FFR and CFR is lower than that between iFR and CFR. Therefore, a discordant result with CFR is more likely when FFR is used to assess a stenosis.
Diabetic patients are a well-known subgroup of high-risk patients. In particular, diabetic patients have a greater risk of restenosis after PCI and have poorer outcomes in terms of MACE in many large clinical trials. A subgroup analysis of the DEFINE-FLAIR trial aimed to determine the outcome of diabetic patients undergoing physiology-guided revascularisation at one year. Overall, 758 diabetics were compared with 1,707 non-diabetics. Significantly higher rates of MACE were seen among the diabetic population in comparison to the non-diabetic one (8.5% vs 5.6% respectively, adjusted HR 1.88,95% CI 1.28-2.64). Among diabetic patients specifically, no difference was found in MACE rates when revascularisation was guided by iFR versus FFR (10.0% vs 7.2%, adjusted HR 1.33, 95% CI 0.78-2.25) and no difference was found in those deferred based on iFR or FFR assessment (with MACE in the deferred population (6.8% vs 5.1%; adjusted HR 0.98,95% CI 0.38-2.55) confirming that iFR is safe to use as a physiological index in this population). The safety of iFR-guided revascularisation in this setting has been further confirmed in the extended follow-up of the iFR-SWEDEHEART study, where subgroup analysis showed no differences in the primary endpoint between diabetic and non-diabetic subjects at five-year follow-up.
One of the main benefits of guiding coronary revascularisation using functional stenosis assessment in the presence of multivessel disease (MVD) is the opportunity to reclassify stenosis severity and to improve decision-making on revascularisation strategies. . Notably, by removing the need for hyperaemic agents, iFR simplifies functional stenosis assessment in terms of time consumption, adverse side effects and costs, which is especially attractive in the setting of MVD. Data from the iFR-SWEDEHEART trial showed a significantly higher number of lesions evaluated per patient in the iFR arm compared with the FFR arm (1.55±0.86 vs 1.43±0.70; p=0.002). Furthermore, in both the DEFINE-FLAIR and iFR-SWEDEHEART trials, there was a strong trend towards a lower number of stents implanted per patient when PCI was guided by iFR as compared with FFR (DEFINE FLAIR: 0.66±0.92 vs 0.72±0.96, p = 0.09; iFR-SWEDEHEART: 1.58±1.08 vs 1.73±1.19, p = 0.05).
The second advantage of iFR when assessing MVD relies on the opportunity to change the revascularisation strategy. The value of coronary artery bypass grafting (CABG) on hard clinical outcomes over percutaneous intervention has been historically proven by angiographic assessment of stenosis severity without the use of intracoronary physiology, . However, it is possible that many native coronary vessels surgically grafted may not have had truly ischaemic lesions, and therefore may not have received a true benefit from bypass surgery. Furthermore, in many cases, graft occlusion has an asymptomatic clinical course if the native vessel has no-flow limiting stenosis. In this regard, physiological assessment can transform angiographic three-vessel severe disease into one or two vessels with physiologically severe stenoses, potentially modifying the therapeutic strategy. In the FFR-R3F registry (Registre Français de la FFR), changes in therapeutic strategies (medical therapy versus revascularisation either by PCI or CABG) were investigated in 1,075 patients that underwent diagnostic angiography with FFR assessment. The authors reported changes of the revascularisation decision in about half of the patients after FFR evaluation, in comparison with the initial angiography-based strategies. Interestingly, the final FFR-based strategies that disagreed with the angiography-based a priori decision were similarly safe at one year of follow-up compared with the patients in whom FFR-based strategies matched initial angiography-based decisions. The SYNTAX II trial demonstrated the value of iFR to guide coronary revascularisation in patients with MVD. In this multicentre, all-comers, single arm study, 454 patients with de novo threevessel coronary artery disease with equipoise four-year mortality risk between a percutaneous or surgical approach underwent multivessel iFR/FFR assessment using a hybrid approach combined with contemporary high-quality standards of PCI as ultrasound guidance, third generation thin-struts stents, chronic total occlusion revascularisation and optimal medical therapy. The outcomes were compared with the historical cohort of the original SYNTAX I trial. Importantly, out of 1,559 lesions initially intended to be treated according to angiographic appearance, only 75% were found to be functionally significant. In the majority of target lesions (77%), the physiology-based revascularisation was only guided by iFR, whereas in the remaining cases (23% of lesions with iFR values between 0.86-0.93), the decision was made based on FFR. Notably, after physiological evaluation of the three coronary vessels, only 37.2% of the patients required three-vessel interventions. Physiological guidance decreased the initial angiography-based 3.5 target lesions per patient to 2.6 lesions per patient, and PCI was deferred in 25% of the lesions. In addition, the benefit of the SYNTAX II strategy was maintained at two years of follow-up, with repeat revascularisation occurring in only 1% of deferred lesions. As iFR was used as the sole technique for deciding whether to treat or defer a stenosis in around 75% of lesions in SYNTAX II, this evidence supports the value of iFR to guide clinical decision-making pertaining to revascularisation strategies in patients with MVD. The extremely low incidence of repeat revascularisation in lesions with deferred revascularisation at two-year follow-up in the SYNTAX II trial is reassuring regarding the use of iFR in the high risk anatomical subset of three-vessel disease. Overall, the SYNTAX II study suggests that implementing iFR together with protocols of high-quality contemporary PCI is effective in improving composite endpoints by reducing myocardial infarction and further revascularisation at one and five years of follow-up, as compared with the PCI arm of SYNTAX I, . Interestingly, this strategy was not inferior compared to the historical surgical cohort of the SYNTAX I trial, .
Despite the benefits of complete revascularisation in STEMI patients having been clearly defined , , , the role of physiological lesion assessment in this setting is still a matter of debate. To date, studies on this topic can be divided in two categories: one comparing physiology-guided complete revascularisation versus IRA-only strategy and one comparing physiology-guided versus angiography-guided complete revascularisation. As to the former, the use of intracoronary physiology to guide complete revascularisation has shown to improve outcomes. The DANAMI-3—PRIMULTI trial demonstrated a reduction of repeat revascularisation at long-term follow up in the FFR-guided complete revascularisation arm of non-IRA as compared with no further revascularisation after primary PCI of the culprit vessel; however, all-cause death and non-fatal reinfarction were similar between groups. The results of this study have been reproduced in the COMPARE-ACUTE and FIRE trials, . However, in patients undergoing routine complete revascularisation, the effectiveness of coronary physiology has been questioned. In the FLOWER-MI trial, FFR guidance of non-IRA PCI failed to show benefit compared to isolated angiography in reducing the composite outcome of death, non-fatal MI and urgent revascularization at one year of follow up (FFR: 5.5% vs angiography: 4.2%, HR 1.52 95%CI 0.78-2.23), as well as its isolated composers . On the contrary, the FRAME-AMI study suggested significant improvement in terms of death, myocardial infarction or repeat revascularisation in this setting . In this case, the same outcome was effectively improved by a physiology-guided strategy at a median follow-up of 3.5 years (FFR: 7.4% vs angiography: 19.7%, HR 0.43 95% 0.25-0.75). This was mainly driven by a significant reduction in the rates of all-cause death (FFR: 2.1% vs angiography: 8.5%, HR 0.30 95%CI 0.11-0.83) and procedure-related MI (FFR: 1.1% vs angiography: 4.0%, HR 0.26 95%CI 0.07-0.94). Against this background, the most recent ESC guidelines on ACS recommend using angiographic stenosis severity to evaluate the need of PCI of the non infarct related artery (non-IRA) in STEMI (Class IB). For NSTEMI functional evaluation of the non-IRA severity during the index procedure may be considered (IIb B) . Larger studies such as the COMPLETE 2 trial (NCT05701358) are currently ongoing and will provide further evidence on this topic.
To date, data on the role of iFR in guiding complete revascularisation of non-IRA lesions are limited. In the aforementioned meta-analysis of DEFINE-FLAIR and iFR SWEDEHEART, the authors reported an excess of events at one year in patients with ACS, in whom deferral of revascularisation of non-IRA was based on physiology as compared to patients with stable angina. This analysis included physiological evaluation of non-IRA in 440 patients presenting with ACS. Overall, ACS as a clinical presentation was associated with a higher MACE rate compared with SA in deferred patients (5.91% vs 3.64% in ACS and SAP, respectively; fully adjusted hazard ratio: 0.61 in favour of SAP; 95% confidence interval: 0.38 to 0.99; p= 0.04). Interestingly, in the FFR group, deferred patients with ACS had more events than deferred patients with stable angina (HR: 0.52; 95% CI:0.27 to 1; p<0.05), while in the iFR group there were no differences in outcome in deferred patients depending on the clinical presentation (HR:0.74; 95%CI:0.38 to 1.43 p=0.37). The potential advantages of one of the indices in the evaluation of non-culprit stenoses in patients with ACS deserves further research. The currently recruiting iMODERN trial may contribute to addressing this question by comparing iFR-guided revascularisation at the time of STEMI versus a delayed perfusion cardiac MRI-guided strategy (NCT03298659).
In the AMI clinical subset, factors related to time consumption, technical issues, contrast-associated nephropathy and haemodynamically fragile conditions raise concerns for defining the optimal timing (during the index procedure, at another time before discharge, or afterwards) and best method to guide a complete revascularisation of non-IRA. The concerns about equivocal decision-making with FFR and iFR in the context of AMI stem from theoretical reasons and clinical evidence. Given the completely different physiological framework in AMI patients as compared with SA patients, the widely demonstrated safety of FFR or iFR in patients with SA cannot be easily transferred to AMI patients. Thim et al. compared acute iFR values in non-IRA (obtained immediately after successful primary PCI of the culprit vessel) with repeated iFR measurements obtained at a staged follow-up procedure in 120 STEMI patients (157 non-IRA). Through a median time of 16 days (IQR: 5 to 32 days) between acute and follow-up assessment, authors found a classification agreement of 78% between acute and follow-up iFR values in non-IRA, with acute iFR values in general being lower than follow-up iFR values. However, the overall negative predictive value of acute iFR was high (89%), which means that one of the main benefits of the resting iFR index in the acute clinical subset of STEMI patients would be ruling out ischaemia-causing lesions. From a physiological framework, the demonstrated increase in resting coronary flow that occurs in both IRA and non-IRA in AMI patients may partially explain the lower, acute iFR values compared with staged iFR repeated measurements. However, a study by Choi et al. contradicts these findings. These authors evaluated FFR, iFR, CFR and IMR in non-IRA from 100 AMI patients and performed a comparative analysis with 203 SA patients across different groups of angiographic severity (i.e. 40% to 80% diameter stenosis). Despite the fact that non-IRA had lower CFR values than SA patients, the authors found that FFR and iFR values were not significantly different between non-IRA and SA-target vessels across all %DS groups, and that there was no significant interaction between the type of clinical presentation and the changes observed. Although this is still a topic of debate, there is evidence suggesting that iFR could provide higher diagnostic accuracy in the periprocedural phase compared to FFR. In a study by van der Hoeven et al. investigating non-IRA lesions in 73 patients with STEMI and MVD during the index procedures and at one month, the authors demonstrated that mean iFR values were stable (0.93 [±0.07] vs 0.94 [±0.06]; P = .12), while FFR significantly decreased at the time of the staged evaluation (0.88 [±0.07] vs 0.86 [±0.09]; P = .001). These findings suggest an increased risk of false negatives when FFR is used to determine the relevance of non-IRA lesions in the periprocedural phase, this being one of the potential explanations for the absence of benefits observed with this strategy in some clinical studies.
The results of the few studies carried out heretofore on the clinical benefit of pressure wire measurements in AMI are encouraging. However, there is a need for randomised studies aimed at specifically evaluating the best strategy (guided only by angiography, by FFR or iFR) and ideal time to perform the physiological assessment of the non-IRA in AMI patients.
The concomitant presence of coronary artery disease in patients with symptomatic severe aortic valve stenosis (SAS) is highly frequent and represents a challenge for clinical decision-making and therapeutic strategies. Current clinical guidelines recommend simultaneous revascularisation of severe coronary lesions involving proximal segments of main branches in patients with clinical indication for aortic valve treatment. However, such assessment of coronary stenosis severity is based on angiographic appearance, despite the well-known inaccuracy of this method in determining true functional stenosis relevance, even in the presence of SAS. On the other hand, the singular pathophysiological framework triggered by aortic valve disease, which includes left ventricle hypertrophy, increased afterload and microvascular dysfunction, generates uncertainty about the possibility of translating the well-demonstrated accuracy and clinical benefit of pressure wire-guided coronary revascularisation in patients with aortic stenosis. Wiegerinck et al. evaluated the effect of aortic valve stenosis on coronary haemodynamics, demonstrating a decreased coronary flow reserve (CFR) and increased hyperaemic microvascular resistance in the presence of aortic stenosis, and an immediate improvement in the CFR and decrease in hyperaemic microvascular resistance after transcatheter aortic valve replacement (TAVI). Despite thechanges in coronary haemodynamics caused by aortic valve disease, several efforts have been made in evaluating the feasibility and reliability of using trans-stenotic pressure gradient indices to assess the functional relevance of concomitant coronary lesions in SAS patients. Some studies have demonstrated an overall high reproducibility of FFR when comparing values obtained before and after TAVI, and a good overall diagnostic performance of FFR compared with myocardial perfusion scintigraphy, . However, the available evidence of FFR in SAS patients is still scarce, and the haemodynamic adverse effects derived from adenosine use can potentially be more pronounced in this fragile population. In this regard, adenosine-free resting indices are very attractive to overcome the aforementioned limitations of FFR and have the potential to increase the use of invasive physiology to guide coronary revascularisation in SAS patients. The effects of TAVI on iFR values and its reproducibility have been evaluated by Scarsini et al.. Although a significant individual iFR variation was found in post with respect to pre-TAVI iFR values, authors reported an overall high diagnostic performance of both iFR pre-TAVI and iFR post-TAVI using FFR post-TAVI as the reference standard (AUC 0.90 [0.84-0.96] pre- and 0.93 [0.88-0.97] post-TAVI). In addition, by using the iFR cut-off ≤0.89, the authors found a high negative predictive value of both iFR pre-TAVI and iFR post-TAVI in ruling out ischaemic lesions as determined by FFR ≤0.80 (98.9% and 97.5%, respectively), whereas positive predictive value was modest (44.1% and 60.1%, respectively). This finding could be related to the intrinsic haemodynamic changes caused by aortic valve disease, such as a compensatory increased baseline flow and low CFR that can decrease the positive predictive value of pre-TAVI iFR. Yamanaka et al. evaluated the diagnostic performance of iFR in 95 SAS patients with intermediate coronary lesions. The authors found an optimal iFR cut-off value of 0.82 to demonstrate myocardial ischaemia using both FFR<0.75 and myocardial perfusion scintigraphy as the reference methods, with a high diagnostic performance for iFR (AUC 0.89 and 0.84, respectively). In addition, Ahmad et al. evaluated the effect of aortic valve disease on coronary pressure, flow, iFR and FFR values, obtaining Doppler-derived flow and pressure intracoronary measurements at rest and during hyperaemia, immediately before and after TAVI. The authors found that iFR post-TAVI did not change (0.88±0.09 pre- vs 0.88±0.09 post-TAVI, p=0.73), whereas FFR post-TAVI significantly decreased (0.87±0.08 pre- vs 0.85±0.09 post-TAVI; p=0.001). These findings were further confirmed in a small study by Vendrik et al., in which thirteen patients underwent pre-TAVI, post-TAVI and six-month physiological assessment of intermediate stenosis. Again, FFR was found to be significantly lower post-TAVI, both immediately thereafter and at six-month follow-up, while iFR did not significantly change. These results indicate that FFR could underestimate the severity of coronary stenoses in patients with SAS, similar to what has been proposed in the periprocedural phase of STEMI. The results of these studies are opposed to those reported by Scarsini et al., in which iFR showed a non-homogeneous behaviour after TAVI. Notably, in this latter study, a significant proportion of iFR measurements that crossed the iFR threshold after TAVI had pre-TAVI iFR values very close to the cut-off of 0.89, which certainly increases the probability of variations.
In summary, the few invasive physiological studies carried out to date in patients with SAS have shown that pressure wire-based assessment of coronary stenoses, with both FFR and iFR, is feasible and technically safe in this clinical subset. However, the underlying pathophysiological framework of aortic stenosis requires caution in interpreting invasive physiological measurements before aortic stenosis treatment. At the time of writing this chapter, outcomes studies assessing the long-term clinical benefit of pressure wire-guided coronary revascularisation specifically in aortic stenosis patients are pending.
Kim et al. examined the differences in outcomes between men and women included in the DEFINE FLAIR study. In this subanalysis, 601 women and 1,891 men were included with the primary endpoint being MACE (a composite of all-cause death, non-fatal myocardial infarction or unplanned revascularisation). There was an even distribution of stenosis location across both groups, with the LAD being the most commonly interrogated vessel. No differences in mean iFR values across the sexes were noted, while FFR values were statistically lower in men than in women. Women had a lower number of functionally significant lesions per patient (0.31 ± 0.51 in women versus 0.43 ± 0.59 in men p<0.001) and were therefore less likely to undergo revascularisation (42.1% versus 53.1% for women and men respectively, p<0.001). Revascularisation rates in women did not differ regardless of the physiological index used (iFR or FFR), while men who had FFR-guided procedures more commonly underwent subsequent revascularisation, in keeping with their lower FFR values. Despite these differences, there was no difference in one-year MACE between men and women in the overall population (5.49% versus 6.77% for women versus men, adjusted hazard ratio 0.82, 95% CI 0.53-1.28, p=0.380). Similar to the overall findings of DEFINE FLAIR, both iFR- and FFR- guided revascularisation strategies had similar one-year MACE when stratified by sex.
Physiology-guided revascularisation and PCI strategies become challenging in the presence of tandem lesions or diffuse coronary artery disease. FFR was validated for isolated stenosis, and its real value for a given lesion can be masked by the presence of downstream serial stenoses. In other words, FFR assessment tends to underestimate the real contribution of each stenosis to the ischaemic burden in the presence of tandem disease. In this subset, the fluid dynamic interaction under hyperaemic conditions between two serial stenoses alters the true value of FFR for any of the two lesions (so called “cross-talk”): if the sensor of the pressure wire is placed between both stenoses, the distal stenosis attenuates the pressure-drop of the circuit in a way that decreases the pressure gradient and underestimates FFR for the proximal lesion. If the sensor of the pressure wire is placed distally to both stenoses, the obtained FFR value represents the sum of both serial stenoses, and the distal lesion cannot be separately evaluated. To overcome this FFR limitation, De Bruyne et al. developed a mathematical equation to predict the FFR value of each stenosis separately, as if the other stenoses were absent. However, as such an approach was non-operative due to its complexity (requiring coronary wedge pressure measurements, and not being valid if coronary branches exist between tandem stenoses) it never became adopted in clinical practice. In clinical practice, most operators perform a careful pullback FFR assessment to determine the most relevant stenosis by visual detection of the largest pressure drop and, after treating the most severe stenosis, they repeat the FFR measurement to determine the true relevance of the residual stenosis.
Non-hyperaemic measurements offer a unique opportunity to perform separate analysis of stenosis severity in this context. While under hyperaemic conditions, coronary flow decreases and becomes unpredictable as it passes through a ≥40% diameter stenosis; in non-hyperaemic conditions, coronary flow remains relatively constant and stable, regardless of the severity of coronary artery stenosis, due to the compensatory effect of microcirculation (Figure 4), . Consequently, after removal of a given epicardial stenosis, coronary flow remains more stable at rest than under hyperaemic conditions, which theoretically means that trans-stenotic pressure changes across serial stenoses become more predictable, leaving pressure gradient in residual lesions largely unchanged.The reliability of iFR in this setting has been investigated by Warisawa et al., who showed that there is at least a 20% rate of vessel level ischaemia misclassification when hyperaemic pullbacks were compared to non-hyperaemic ones in 88 vessels with serial tandem lesions.
Despite this data, the striking differences between pullback results obtained with FFR or iFR do not automatically mean that non-hyperaemic indexes are immune to the cross-talk phenomenon. In an elegant study on animal models, Ahn and colleagues simulated two tandem lesions in the LAD vessel and, by contemporarily generating a “fixed” and a “variable” stenosis with coronary balloons, the authors measured the amount of cross-talk as a function of the ∆pressure ratio downstream the fixed one (∆= 0 equivalent to absence of cross-talk). Overall, they were able to demonstrate that, similarly to FFR, both iFR and Pd/Pa ratio show haemodynamic interdependence. In particular, the cross-talk phenomenon was less pronounced when non-hyperaemic indexes were used in serial moderate lesions, while for severe stenoses this partial benefit was entirely lost and the results were comparable between all indexes. This is probably related to the fact that, in severely tight lesions, there is no real difference between hyperaemic and non-hyperaemic conditions due to the lack of microcirculatory reserve.
Non-hyperaemic pullbacks have been used to generate offline automated physiological maps derived from continuous beat-by-beat iFR measurements. In a pioneer study by Nijeer et al., the physiological map was used to determine the iFR pressure drop at every millimetre (∆iFR/mm) along the interrogated vessel, quantify the contribution of each individual stenosis, and predict the post-PCI iFR outcome after stenting a given stenosis. Authors reported a high accuracy of the pre-PCI physiology map to predict post-PCI iFR outcome, with a mean difference between predicted iFR and actual observed post-PCI iFR of 0.016 ± 0.004. Notably, the reliability of pullback-derived maps in predicting post-PCI results seems to be a class feature of all non-hyperaemic indexes, with similar correlations between predicted and actual post-PCI values for iFR, resting flow ratio (RFR) and diastolic pressure ratio (dPR).
Currently, the most advanced iFR-pullback system (iFR angiography co-registration, Philips BV, the Netherlands) plots, aligns and overlays the physiological map onto the angiogram using the time-stamp data recorded during a manual pullback in order to provide a rapid visualisation of areas of iFR loss and an easy evaluation of which lesions cause the highest physiological impact on the ischaemic burden in the presence of tandem or diffuse disease. This physiological map permits an accurate assessment of the relevance of each individual lesion in tandem stenoses, and the pattern of iFR loss allows the operator to determine whether the disease is predominantly focal or diffuse (Figure 7 and Figure 8). In addition, the software facilitates PCI strategies by allowing operators to perform virtual PCI: once the more physiologically relevant stenosis has been identified using the physiological map, it can be manually selected for virtual removal in order to predict the best possible post-PCI physiological result, as well as the functional relevance of residual disease. In addition, by integrating the variations in apparent length of the radiopaque pressure guidewire tip (which result from vessel foreshortening), the algorithm behind iFR angiography co-registration allows an accurate assessment of lesion length and virtual stent length. Of note, the accuracy of the system persists with manual pullback, avoiding the need for a cumbersome mechanical pullback device. (Figure 9)
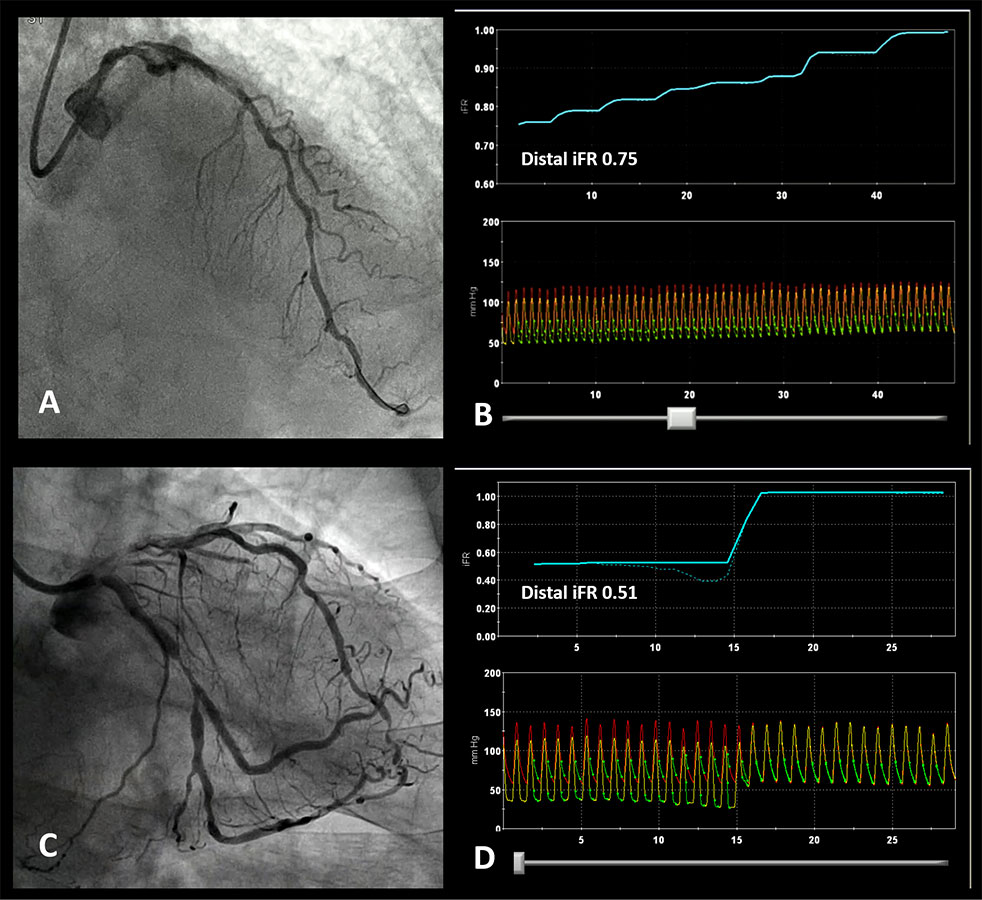
Patterns of disease based on iFR pullback. A. Diffusely diseased LAD with several stenoses in its mid and proximal segment. B iFR pullback trace confirming diffuse disease with a gradual increase in iFR as the pressure sensor is pulled back to the catheter without a focal ‘step up’ in pressures. C. Angiogram showing a focal LCX stenosis. D. iFR pullback demonstrated a physiologically positive result (0.51) with a focal pattern (all the pressure drop was located at the level of the mid-LCX stenosis).
Online co-registration of iFR pullback and angiogram
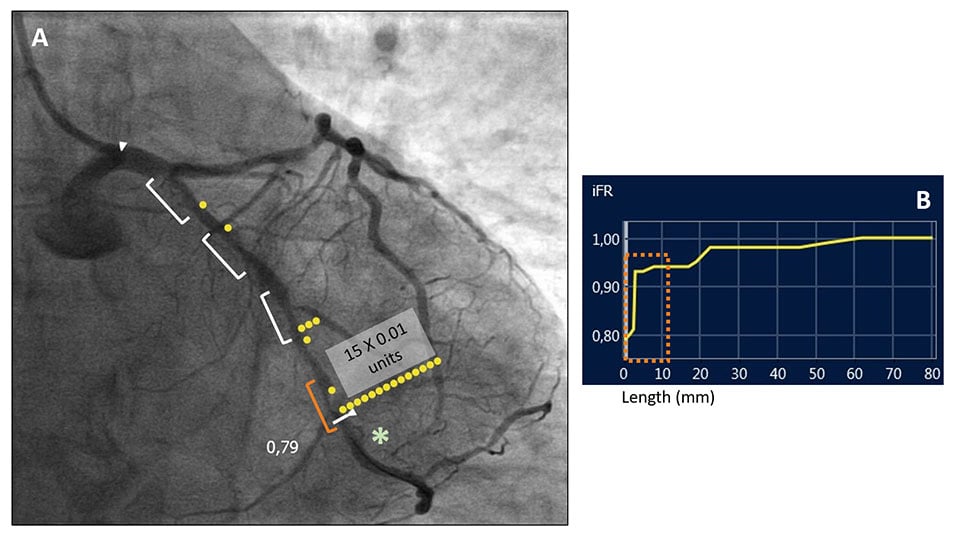
IFR physiological assessment of a left circumflex coronary artery with several tandem intermediate coronary stenoses (white markers) (A). The pressure-wire sensor was placed distally (*) obtaining an iFR value of 0.79, indicating physiologically significant disease. In order to determine the functional relevance of each stenosis, an iFR pullback with angiography co-registration was performed (B). The physiological map (A) allowed the identification of the more distal stenosis (orange marker in pictures A and B) as the most functionally relevant, with an iFR pressure-drop of 0.15 units. On the contrary, the other proximal three coronary stenoses did not contribute significantly to the pressure drop. (SyncVision System,Philips BV, The Netherlands).
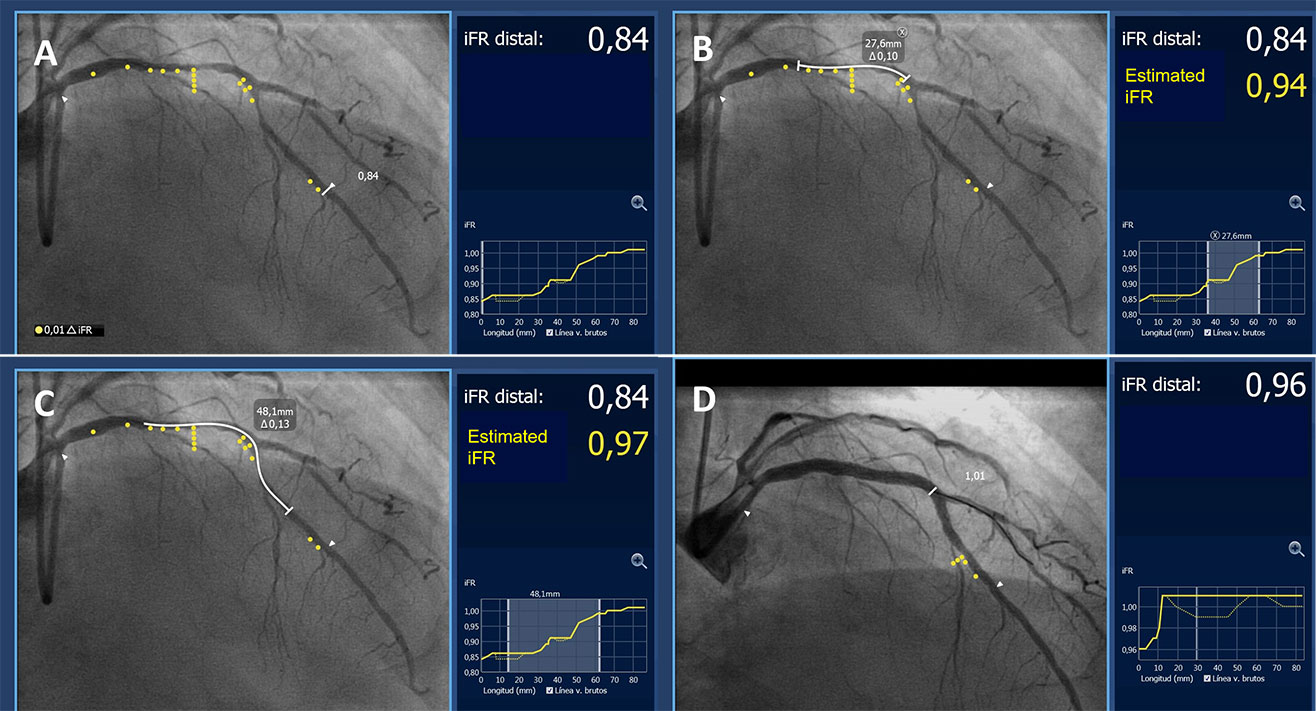
Procedural guidance based on iFR pullback and angiography co-registration. A. iFR pullback and angiography co-registration demonstrating functionally significant disease (iFR 0.84) in a long segment of the LAD with 2 major areas of pressure-drop located in the proximal LAD and in the area around the first diagonal. B and C show different stenting options (white line, stent length required indicated in the box) and the estimated iFR result. D. Based on these findings the lesion was treated with 2 overlapping stents covering both areas of pressure drop. The final iFR result after PCI (0.96) demonstrated a good functional result that correlated well with the estimated iFR. (SyncVision System,Philips BV, The Netherlands).
Overall, the relevance of this information for PCI guidance is notable, as prediction of the final haemodynamic effect can be performed before stent implantation. The online feasibility of this approach (virtual PCI) has been validated in the iFR GRADIENT Registry. In this prospective multicentre study, Kikuta et al. reported a high accuracy of iFR-pullback measurements to predict post-PCI physiological outcomes in patients with angiographically intermediate tandem or diffuse disease: the expected iFR value after stenting a given stenosis predicted the actual post-PCI iFR result with 1.4 ± 0.5% error in paired pre- and post-PCI iFR measurements performed in 128 patients (134 vessels). In addition, online iFR-pullback changed operator procedural planning in 31% of cases as compared with initial angiography-based strategies with a reduction in lesion number (-0.18 ± 0.05 lesion/vessel; p = 0.0001) and length (-4.4 ± 1.0 mm/vessel; p < 0.0001). Algorithmic interpretation (AI) of pressure wire pullbacks has been shown to be non-inferior to human interpretation and may greatly assist in the application of this technology by operators who may not be as familiar with the interpretation of iFR physiological pullbacks and virtual PCI . Since post-PCI physiological result is a strong predictor of long-term clinical outcomes, the online tools provided by the iFR-pullback system are very attractive in the setting of tandem or diffuse disease and may facilitate decision-making regarding PCI strategies , , , . The DEFINE-GPS trial (NCT04451044), which is currently ongoing, will define if the routine use of co-registration in order to plan and optimise PCI is associated with a significant clinical benefit compared to standard practice.
Interest in the assessment of residual ischaemia using pressure wires has increased in recent years. Heretofore pressure wire assessment of an intermediate stenosis has mainly been employed to confirm the indication for revascularisation or to justify the deferral of a lesion. Many operators do not assess post-PCI physiology for numerous reasons, including time, resources and, in the context of FFR, additional costs and patient discomfort pertaining to repeated adenosine administration. Furthermore, despite the clear evidence suggesting the correlation between post-PCI physiological values and the risk of adverse events, there is no definitive consensus on the best thresholds of FFR or iFR following PCI and whether a physiology-driven optimisation strategy of PCI results is actually associated with improved outcomes. However, with the advent of iFR pullback systems capable of locating the site of pressure loss within the vessel, analysis of post-PCI physiological results becomes a quick and attractive option. The DEFINE PCI study (Blinded Physiological Assessment of Residual Ischaemia After Successful Angiographic Percutaneous Coronary Intervention) by Jeremias et al. was a multicentre prospective registry examining the functional result of PCI in 562 vessels with pressure tracings being assessed independently by a core laboratory. Despite operator-assessed, angiographically successful PCI, residual ischaemia was found in 24% of patients based on an iFR cut-off of ≤0.89. Using iFR pullback, the residual ischaemia was identified as being focal in >80% of patients and, in the vast majority, as either related to the stented area or just proximal or distal to the stented area. When tailored on clinical outcomes, the authors found that a post-PCI iFR value ≥0.95 was associated with improved anginal status and a lower unadjusted risk of MACE. This highlights the potential for targeted post-PCI optimisation based on physiological assessment using iFR pullback. Nevertheless, this cut-off has not been externally validated and it should be noted that, in clinical practice, it can be difficult to reach similarly high values of post-PCI physiological results. Further studies are therefore needed on this topic. In particular, the aforementioned DEFINE-GPS (NCT04451044) study recommends performing routine post-PCI iFR estimation in the experimental arm. Surely, future analyses of this study will provide external validation of the post-PCI cut-off iFR of 0.95 proposed in the DEFINE-PCI study, as well as new insights regarding the relationship between optimal physiological results and adverse events during follow-up.
After the clinical outcome studies demonstrating the non-inferiority of iFR to guide revascularisation, a wide variety of new NHPI indices have been developed. Their main characteristics are specified in Table 4 and Figure 11 are discussed in brief in the following section.
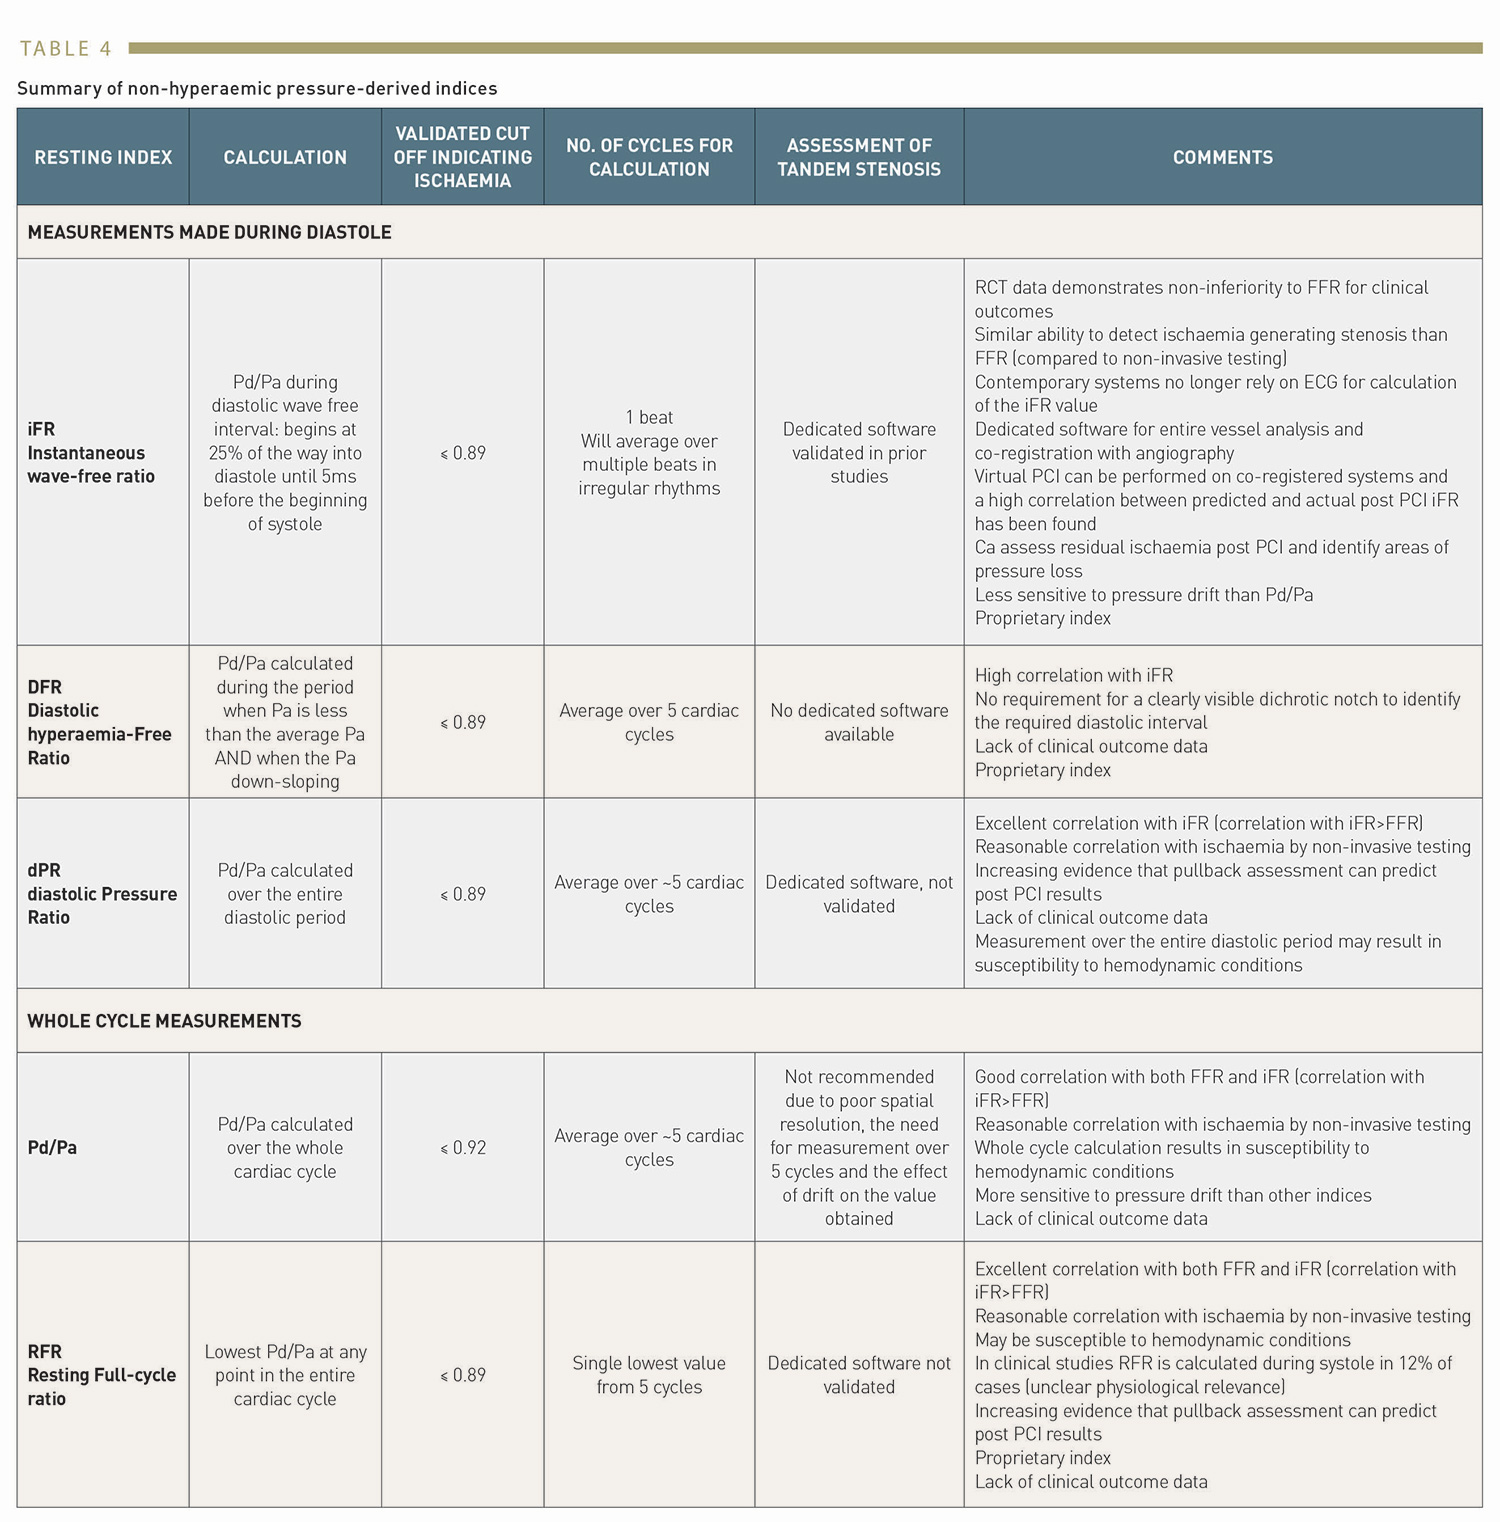
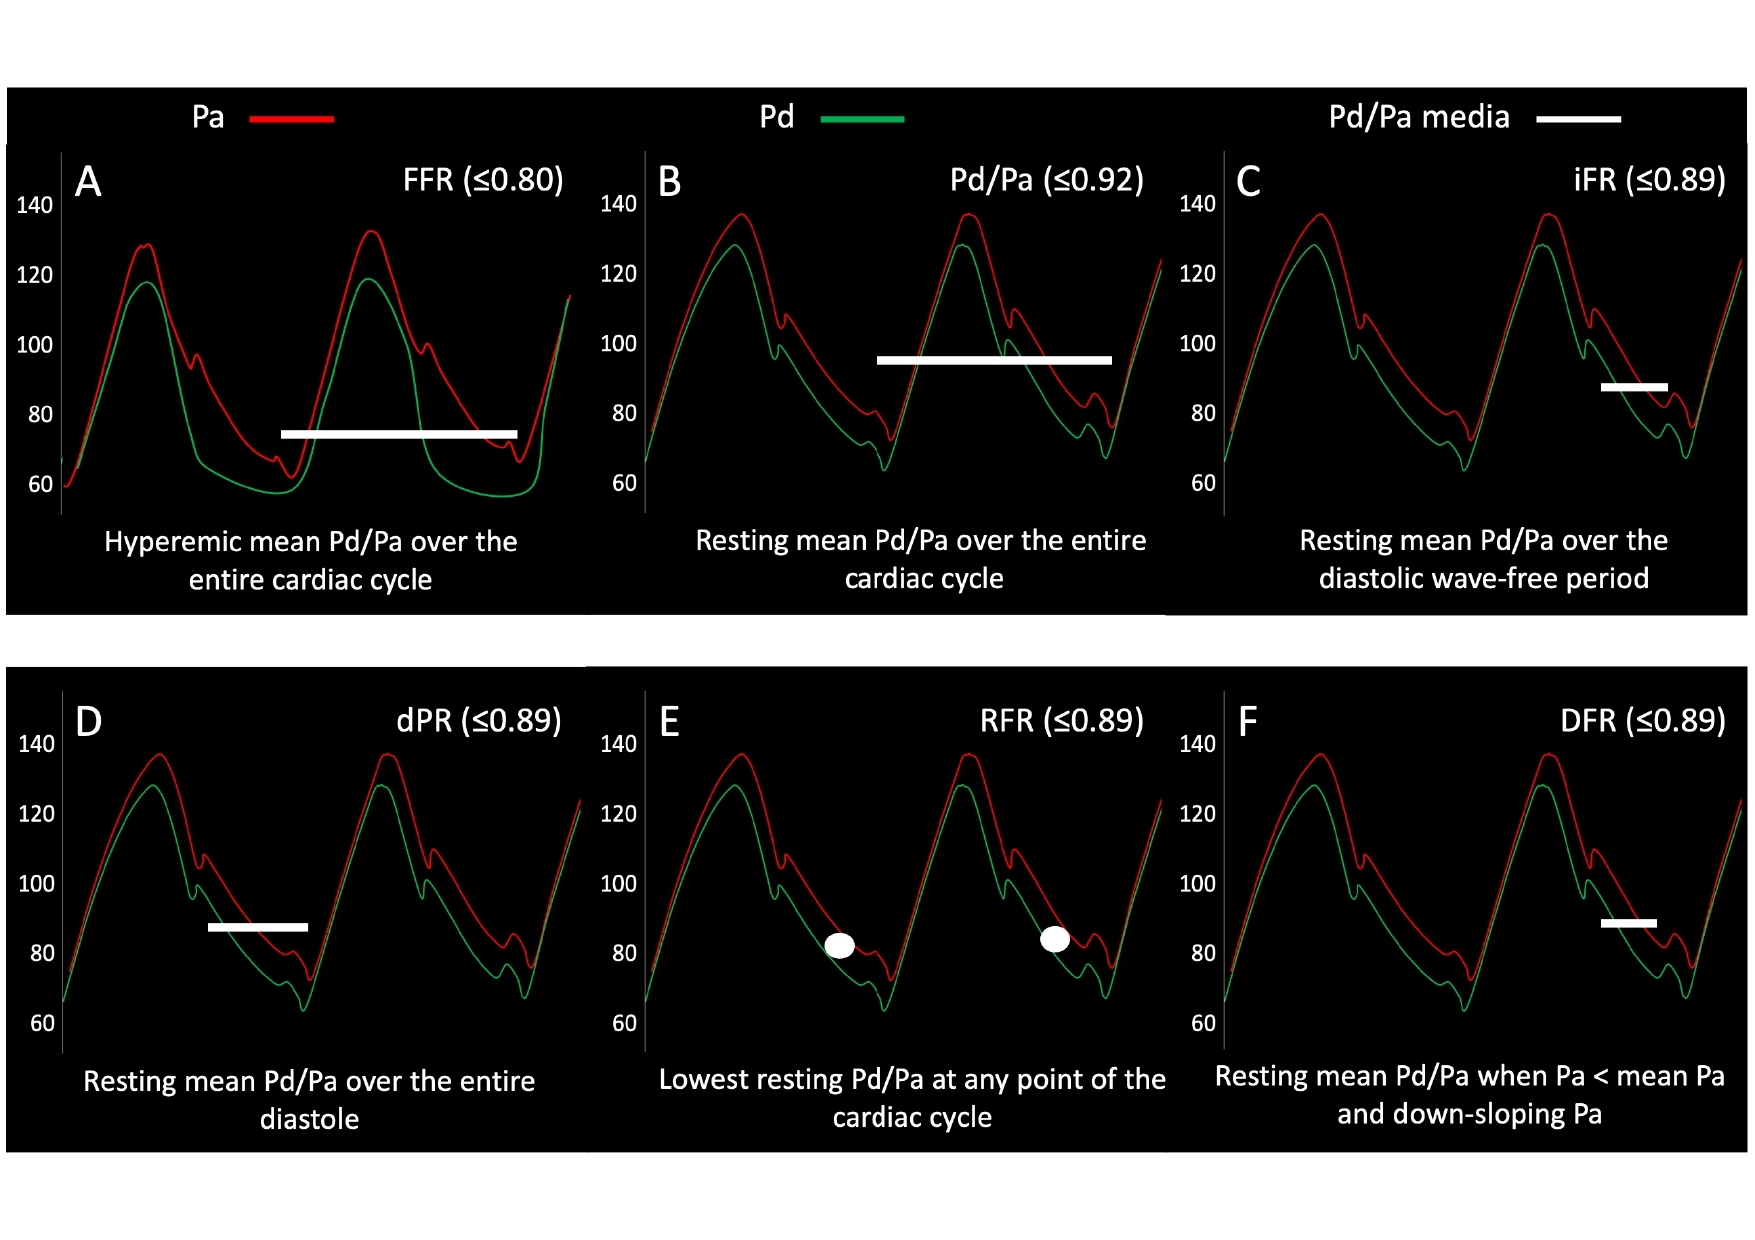
Figure representing the period of the cardiac cycle during which each measurement is taken. (A): FFR is a hyperaemic index calculated over the entire cardiac cycle. (B): resting Pd/Pa is calculated over the entire cardiac cycle. (C): iFR is calculated over the diastolic wave free period. (D): dPR is calculated over the entire diastolic period. (E): RFR is the lowest Pd/Pa calculated at any point of the cardiac cycle. (F): DFR is calculated when Pa is less than the mean Pa and Pa is downsloping.
Pd/Pa is calculated over the whole cardiac cycle, with the final value being an average of five cardiac cycles. Several studies have evaluated the agreement between Pd/Pa and iFR. Kobayashi et al. prospectively enrolled 763 patients and demonstrated a high and significant correlation between the two indices. Pd/Pa showed a good diagnostic accuracy to predict an iFR<0.89 with an AUC of 0.98 and a best cut-off value of Pd/Pa≤0.91. The diagnostic accuracy, sensitivity, specificity, positive predictive value, and negative predictive value were 93.0%, 91.4%, 94.4%, 93.3%, and 92.7%, respectively. A post-hoc analysis of the ADVISE II trial showed no significant differences in AUC to predict an FFR≤0.80 between iFR and Pd/Pa (difference in C statistic, 0.00 [95% CI: 0.01 to 0.00], p= 0.350).
Another study including data from the 3V FFR-FRIENDS and the IRIS-FFR studies evaluated the relationship between Pd/Pa and iFR in 1,024 vessels. Both Pd/Pa and iFR showed similar associations with anatomic and haemodynamic stenosis severity, but the percent change of iFR according to the increase in severity was higher than that of resting Pd/Pa, indicating a higher sensitivity of this index. Similarly, both indices were significantly associated with the two-year risk of MACE, but iFR showed a lower maximum difference in estimated MACE rates. This was due to the lower iFR measurement variability in comparison with Pd/Pa. This may be explained by the fact that Pd/Pa, being a whole cycle index, may be more susceptible to haemodynamic conditions and the obtained value may be less inaccurate in the presence of pressure drift.
The dPR, diastolic pressure ratio, is an index calculated over the whole diastolic period. This index was retrospectively validated against iFR and FFR showing a high correlation between iFR and dPR values (R=0.997; P<0.001), although with a lower correlation with FFR (R=0.77, p<0.001). Using FFR as a reference, the optimal cut-off point to predict an FFR of ≤0.80 was 0.91, giving good diagnostic accuracy (AUC 0.86, 95% CI 0.78-0.93). However, subsequent studies have validated a cut-off of ≤0.89, showing good agreement of dPR and iFR with mutual differences of 0.006 ± 0.011, .
The RFR, or resting whole cycle ratio, is an index whose numerical value is the lowest calculated Pd/Pa anywhere in the cardiac cycle. The VALIDATE RFR study published in 2018 was a retrospective study where RFR was determined from 651 pressure waveforms. The optimal cut-off for RFR to detect an FFR≤0.80 was ≤0.89. Using this cut-off, correlation with iFR was high (R2=0.99, p<0.001) with diagnostic accuracy of 97.4%, sensitivity of 98.2%, specificity of 96.9%, a positive predictive value of 94.5%, a negative predictive value 99.0%, and an AUC of 0.996. Interestingly, in this study, RFR was calculated outside of diastole in 12.2% of cases. The same group prospectively validated RFR against iFR in 501 pressure recordings from 431 patients. Pressure tracings were assessed in a blinded fashion by a core laboratory. RFR was tested for equivalence with iFR using a prespecified 1% margin. RFR demonstrated equivalence to iFR with diagnostic accuracy of 97.8%, sensitivity of 97.8%, specificity of 97.8%, a positive predictive value of 96.2%, a negative predictive value of 98.7% and an AUC of 0.96 (0.94-0.97, p<0.001). While both of these studies demonstrate promise using the RFR index, neither examine clinical outcomes when revascularisation decisions are based on RFR.
Lee et al. therefore evaluated the agreement between RFR and dPR with iFR, also examining their correlation with myocardial ischaemia as defined by PET imaging, and finally assessed their association with outcomes. In 1,024 vessels (435 patients), RFR and dPR were significantly correlated with iFR, and this correlation was higher than with FFR. Both indices showed a high agreement with iFR (c-index 0.987 and 0.993). In the subgroup assessing correlation with myocardial ischaemia, 115 patients who had also PET imaging were included, and no differences in diagnostic performance for the prediction of PET-determined myocardial ischaemia between iFR, RFR, and dPR were found. A composite outcome of cardiac death, vessel-related myocardial infarction and vessel-related ischaemia-driven revascularisation in 864 deferred vessels showed that the three indices were significantly associated with the risk of events at two years (iFR per 0.1 increase: HR 0.514 [95% CI 0.370-0.715], p<0.001; RFR per 0.1 increase: HR 0.524 [95% CI 0.378-0.725], p<0.001; dPR per 0.1 increase: HR 0.587 [95% CI 0.436-0.791], p<0.001). In a further study by this research group assessing vessel-orientated outcomes in deferred lesions, Lee et al. found that discordance between resting indices (iFR, RFR and dPR) and FFR did not result in increased VOCO in deferred lesions at two years. At five years, however, concordant normal lesions had the best outcome in terms of VOCO, while discordant lesions had outcomes worse than concordant normal lesions but similar to revascularised lesions, suggesting the long term safety of deferring revascularisation when either the FFR or non-hyperaemic index is negative.
Considering the progressively increasing role of pre-procedural planning and virtual PCI derived by non-hyperaemic pullback, there is growing interest in investigating the reliability of new NHPI. In the aforementioned REFINE RPG study, Omori et al. randomised 150 vessels from 140 patients on a 1:1:1 basis to undergo iFR, RFR or dFR pullback assessment. PCI was then performed on physiologically significant lesions (using intracoronary imaging guidance) followed by repeat physiological assessment. The aim was to determine the agreement between post-PCI physiological assessment with pre-PCI predicted physiology. A strong correlation between predicted and actual post- PCI physiology was found for all three indices (iFR r=0.83 [95% CI 0.72-0.90, p<0.001], RFR r=0.84 [95% CI 0.73-0.91, p<0.001], and dPR r=0.84 [95% CI 0.73-0.91, p<0.001]). Furthermore, across all three indices, no differences were found between the predicted post-PCI physiological result and the actual post-PCI physiological result (p=0.550). These results highlight the potential for vessel mapping using RFR and dPR, allowing precision stenting and accurate prediction of results.
The strong agreement of these non-hyperaemic indices calculated in diastole with iFR make it possible to predict similar results from the clinical point of view. For whole cycle indices, there are some concerns about the impact of haemodynamic conditions, sensitivity to drift and physiological relevance of gradients detected during systole. (Figure 10). While clinical correlations such as the study by Lee et al. are encouraging, they do not replace randomised controlled data such as that available for iFR.
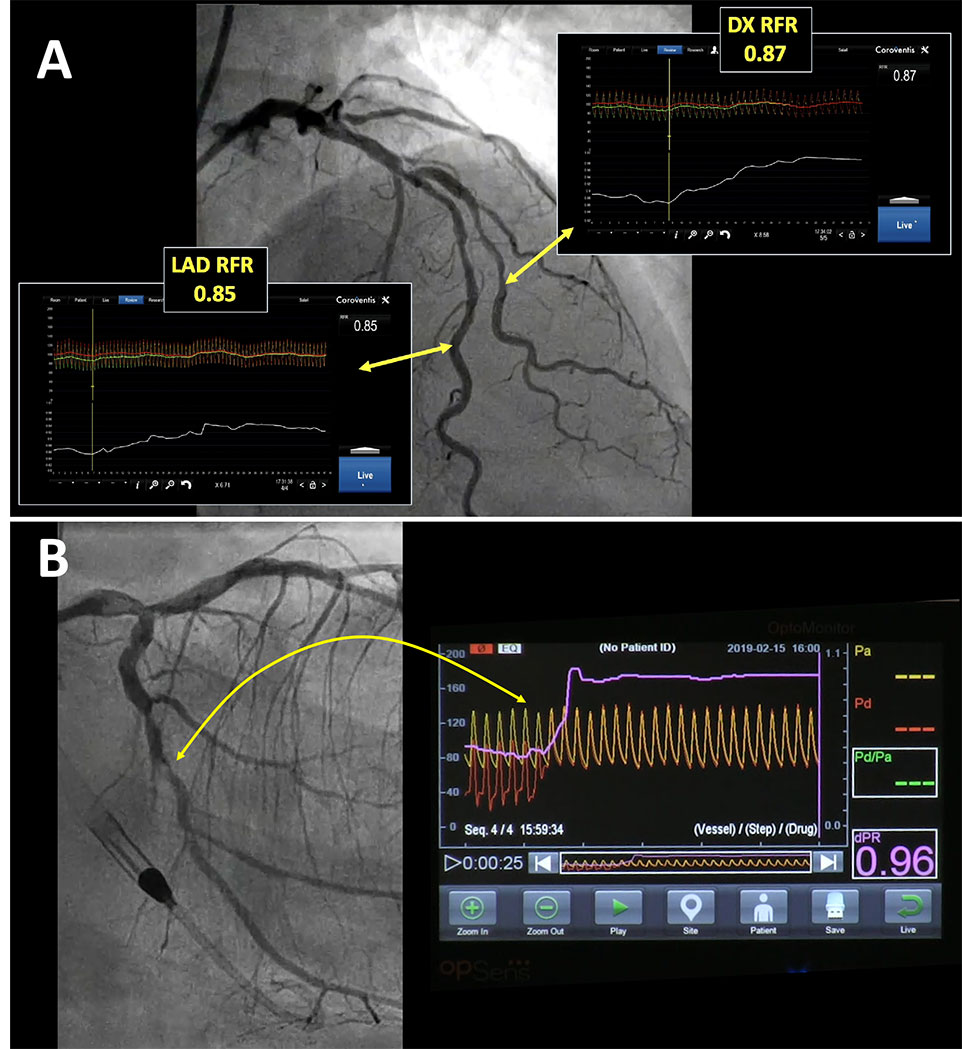
Other NHPI. A: Longitudinal vessel mapping performed with resting whole cycle Pd/Pa (RFR) in the left anterior descending (LAD) and diagonal (DX) branches, allowing identification of the segments that account for haemodynamic impairment in both vessels. (Coroventis™, Abbot, US) B: Longitudinal vessel mapping performed with diastolic pressure ratio (dPR) in the left circumflex branch after left main stenting, allowing identification of a focal stenosis that accounts for haemodynamic impairment in that vessel. (dPR, OPSENS Inc)
The use of coronary physiology to guide revascularisation has been found to improve patient outcomes as compared with angiographic assessment. The use of FFR, however, has remained low in catheter laboratories worldwide. Among the potential reasons to explain its low adoption could be the need for adenosine, which involves cost and increased procedural time, along with some potential discomfort for the patient. This has led to the development of resting pressure-based indices capable of providing information about the functional impact of stenosis without the need for inducing hyperaemia. iFR is a non-hyperaemic index which evaluates the ratio of distal and aortic pressure during the wave-free period of diastole. The two largest clinical randomised trials using physiology performed to date have validated iFR as an evidence-based tool for the evaluation of intermediate coronary stenosis. In comparison with FFR, the use of iFR reduced procedural time and patient discomfort without differences in MACE at one year of follow-up. Data also indicate that the use of this resting index could improve the evaluation of serial stenosis and could determine patterns of disease (focal or diffuse) using pressure pullbacks. This can be relevant to decide not only whether or not treatment is needed, but also to guide the intervention. In this regard, co-registration of iFR with angiography offers a powerful tool to generate a physiological map of the vessel and determine the areas amenable to interventional treatment, with the additional possibility of predicting the result of treatment. A new era in the use of physiology in the catheterisation lab has begun, with this tool used not only to justify but also to guide interventions and assess their results.
Pressure guidewire interrogation has become an indispensable way to improve the outcomes of patients in whom coronary revascularisation is being considered. While the evidence supporting this fact over the last 20 years was largely derived from FFR-based studies, adoption of its use in clinical practice lagged over years. The arrival of iFR truly revolutionised the field of physiological assessment of coronary stenoses. Once initial reservations on whether iFR might be non-inferior to FFR were cleared by the results of large randomised trials, it became evident that the use of a NHPI had much to offer to the interventionalist and patients, even beyond the critical aspects of reduced discomfort, lower costs and faster procedures. As dedicated software for iFR analysis was developed, studies demonstrated the improved capabilities of iFR for longitudinal vessel analysis and multiple stenoses, prediction of the haemodynamic result of the intervention, and co-registration of iFR with angiography, the latter being a true game-changer that virtually transformed physiology in an imaging technique. The best proof of the value of these developments are the many NHPI developed and commercialised in recent years, including DPR, RFR and dFR. While further testing of these new NHPI will be needed, the strong correlation with iFR values demonstrated in the thus far limited number of studies available anticipates that many of them will be surely used in the catheterisation laboratory along iFR and FFR. Today, the interventional cardiologist has a much richer toolbox for making decisions on functional stenosis severity in different scenarios by using both hyperaemic and non-hyperaemic pressure indices.