Evangelos Giannitsis, Christian W. Hamm, Holger M. Nef, Hugo A. Katus
Stable CAD
Updated on May 14, 2022
Revascularisation by percutaneous coronary intervention (PCI) with stent placement or coronary bypass surgery, should be targeted at relieving myocardial ischaemia. However, non-invasive stress testing and coronary angiography will not always provide adequate or complete information about the functional importance of coronary artery stenoses.
The index Fractional Flow Reserve (FFR) is considered the gold standard for the detection of myocardial ischaemia, related to a particular stenosis. By using FFR in patients with coronary artery disease, the interventional cardiologist is able to accurately distinguish between coronary stenoses that induce myocardial ischaemia and those that do not. Its invasive nature is balanced by some unique and advantageous features, such as its unequalled spatial resolution and its linear relation to maximum blood flow. Moreover, FFR has an unequivocal normal value, takes into account collateral blood flow and amount of viable myocardial mass, is independent of haemodynamic variations, and has a high reproducibility. Clinical outcome data of patients in whom the revascularisation strategy has been based on FFR measurements are convincing across many different lesion subsets. Based on the available clinical evidence and the current guidelines on revascularisation, FFR evaluation is indicated for all coronary artery stenoses of 50-90%, including left main stenosis, side branch stenosis and serial stenoses, when functional information from non-invasive tests is lacking. Moreover, in patients with multivessel coronary artery disease, PCI guided by FFR results in an improved outcome irrespective of available non-invasive functional test results. In the last decade, assessment of coronary stenosis severity by non-hyperemic indices like 'Pd/Pa at rest', 'iFR', dPR and RPR have been proposed. However, the accuracy of these interchangeable indices to correctly distinguish myocardial ischemia is only 80% and less extensive outcome data are available for these resting indices, which have mainly been obtained in relatively low-risk patient populations. Therefore, for the time being, maximum hyperaemia still remains recommendable for optimal decision making about revascularisation.
In patients with coronary artery disease, the presence of inducible myocardial ischaemia is an important risk factor for an adverse clinical outcome , , , . The extent and severity of myocardial ischaemia can be used to risk stratify patients .
The more inducible is the myocardial ischaemia, the higher the risk of death or myocardial infarction. Medical treatment can relieve symptoms and improve a patient’s prognosis by reducing myocardial ischaemia, inhibiting progression of disease (secondary prevention), or avoiding complications of existing plaques. However, in patients with a substantial amount of ischaemic myocardium, restoring myocardial blood flow by coronary artery revascularisation results in a greater reduction of myocardial ischaemia than medical therapy alone . Because it is more effective in reducing myocardial ischaemia than medical therapy, coronary artery revascularisation results in complete relief of anginal symptoms in a higher percentage of patients , , , . Furthermore, in patients with myocardial ischaemia, several studies have shown better clinical outcome results for revascularisation when compared to medical therapy alone , , , .
However, for patients with stenotic coronary arteries that do not induce myocardial ischaemia, the benefit of revascularisation is less clear. Even after 15 years of follow-up in patients with a single non-ischaemic (FFR-negative) stenosis, in such patients there is no advantage of revascularisation by PCI over medical therapy (Figure 1) .
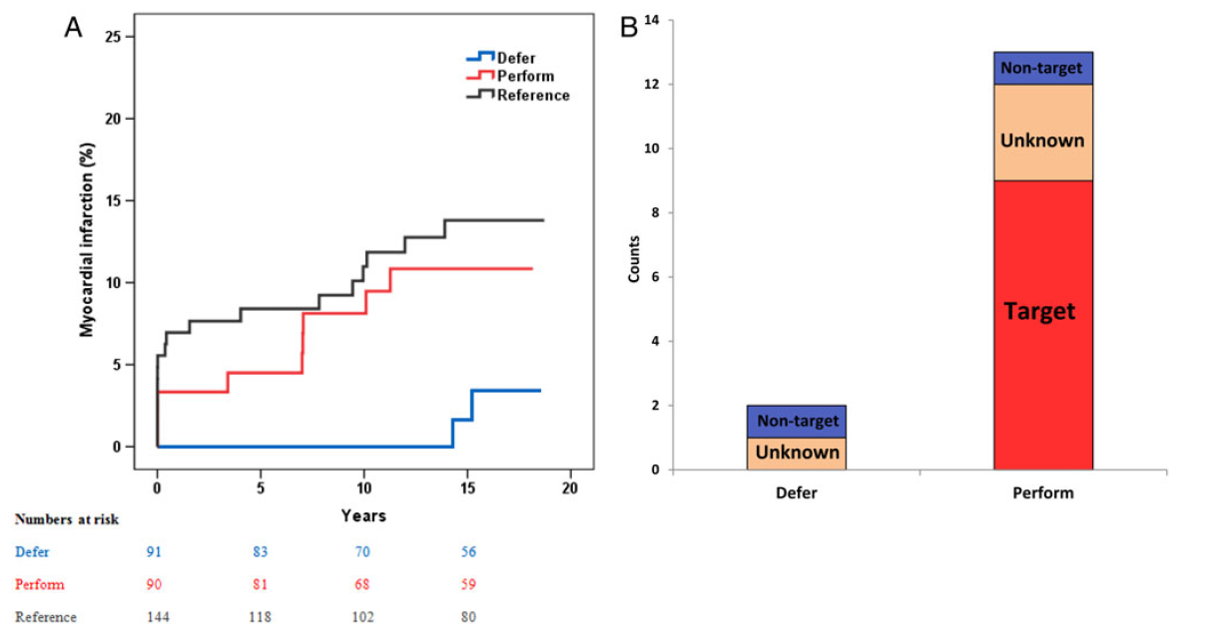
Myocardial infarction rates after 15 years, for patients with single vessel coronary artery disease. The blue and red line represent patients without inducible myocardial ischaemia (as assessed by Fractional Flow Reserve), treated by medical therapy or PCI (stent placement), respectively. The black line represents patients who do have inducible ischaemia, treated by PCI in combination with optimal medical therapy. On the right, the relation of myocardial infarction with target vessel territory is shown (reference 14)
More importantly, patients with non-ischaemic stenoses who are deferred from PCI have an excellent outcome with a very low event rate of less than 1% per year if treated by appropriate medical therapy.
As recommended by current guidelines for the treatment of coronary artery disease, the presence of myocardial ischaemia should play a pivotal role in the decision-making process about coronary revascularisation , . Therefore, in patients with coronary artery disease, it is of paramount importance, both with respect to choice of therapy and to prognosis, to have adequate information about the extent and localisation of myocardial ischaemia.
Non-invasive stress tests for the detection of myocardial ischaemia have been implemented in guidelines for the diagnosis and treatment of coronary artery disease , . Although recommended by these guidelines, not all patients undergo non-invasive stress testing before ending up in the catheterisation laboratory for invasive treatment. A retrospective study of a Medicare population showed that less than half of all patients with stable coronary artery disease have documentation of ischaemia by non-invasive testing within 90 days prior to elective percutaneous coronary intervention . Furthermore, the non-invasive detection and documentation of myocardial ischaemia in patients with coronary artery disease can be a diagnostic challenge.
Exercise stress testing with electrocardiography has a limited sensitivity and specificity for the detection of myocardial ischaemia and is especially difficult to interpret in patients who cannot exercise maximally or in patients with an abnormal electrocardiogram at rest . Moreover, if such a test is positive for myocardial ischaemia, it does not give information about which myocardial territory is, or which territories are, responsible for ischaemia. The inability to detect accurately and localise myocardial ischaemia is less pronounced in non-invasive stress tests that use imaging modalities. Of these tests, nuclear perfusion imaging is the most widely used. Nuclear imaging combined with exercise- or pharmacologically-induced stress is more accurate in detecting and localising myocardial ischaemia than exercise testing with electrocardiography alone . However, several reports have shown that non-invasive tests like nuclear myocardial perfusion imaging can be falsely negative or can underestimate the amount of myocardial ischaemia, especially in patients with multivessel disease , . Such tests are based on the principle of perfusion differences between different myocardial territories and therefore require at least one non-ischaemic myocardial territory as a “normal” reference in order to be able to detect inducible myocardial ischaemia in another territory . The lack of a reference myocardial territory without inducible myocardial ischaemia is most prominent in patients with multivessel disease, thereby limiting diagnostic accuracy of nuclear perfusion tests in this subpopulation significantly. Moreover, in multivessel disease, ischaemia in one perfusion territory may be masked by more severe ischaemia in another. Finally, even if an ischaemic territory is correctly identified, ambiguity may remain with respect to the culprit lesion if several stenoses are present in the supplying artery or diffuse disease is present, whether or not superimposed on focal disease.
Coronary CT-scans are increasingly used for the non-invasive detection of coronary artery disease . However, a high sensitivity of CT-scans is accompanied by a low specificity . CT coronary angiography with non-invasive FFR calculation is increasingly used during the last years and a promising technique to become the non-invasive gold standard of the functional severity of coronary artery disease. Its specificity is much higher than for CT angiography alone without reduction of sensitivity .
Coronary angiography continues to play a pivotal role in invasive imaging of the coronary arteries. Despite rapid developments in non-invasive imaging, the temporal and spatial resolution of coronary angiography is still unsurpassed, and it will remain the road map for interventional cardiologists and cardiac surgeons to perform revascularisation. Nevertheless, it has been recognised for many years that coronary angiography is of limited value to define the physiological significance of a coronary artery stenosis. In this respect, “physiologically significant” means “functionally significant”, or “haemodynamically significant”, or “associated with inducible ischaemia in case of stress”. For guiding PCI in patients, i.e., selecting the correct spots where stents have to be placed, coronary angiography is still the standard technique. This implies that in many patients treatment decisions are largely based on visual angiographic assessment of coronary artery stenoses, together with clinical data. A promising additional tool in this respect, is the so-called pressure pullback gradient (PPG) index, which will be shortly discussed later on in this chapter . Many clinical trials on revascularisation also use coronary angiography as the “gold standard” to define the significance of a coronary artery stenosis. However, coronary angiography has a number of well-recognised limitations , , . Visual estimation of stenosis severity has been proven to be highly variable between different operators and even intra-observer variability is large , . Furthermore, visual angiographic stenosis severity assessment poorly predicts the functional significance of a stenosis , whereas the presence of inducible myocardial ischaemia related to such a stenosis should be the “trigger” for revascularisation. In the FAME study, routine measurement of a lesion’s physiological importance by fractional flow reserve (FFR) was compared to angiography for guiding PCI in patients with multivessel coronary artery disease . Analysis of all lesions in the FFR-guided arm of this study showed that angiography is inaccurate in assessing the functional significance of a coronary stenosis when compared to FFR, not only in the 50-70% range, but also in the 70-90% angiographic severity category (Figure 2) .
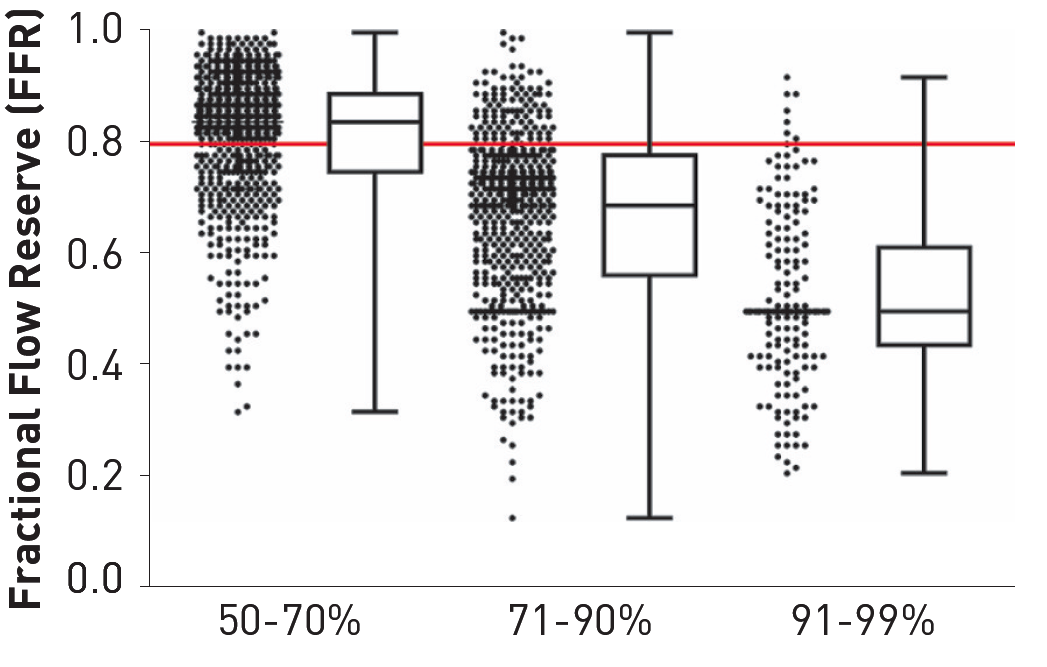
Angiographic severity versus functional severity of coronary artery stenosis in the FAME study. Box-and-Whisker plot showing the FFR values of the lesions in the categories of 50-70%, 71-90%, and 91-99% diameter stenosis, as visually estimated on the basis of the angiogram. In the category 50-70% stenosis, 35% was functionally significant (FFR ≤0.80) and 65% was not (FFR >0.80). In the category 71-90% stenosis, 80% was functionally significant and 20% was not. In the category of subtotal stenoses, >95% was functionally significant (reference 31).
As outlined in the first part of this chapter, in patients with coronary artery disease the most important factor, both with respect to functional class (symptoms) and to prognosis (outcome), is the presence and extent of inducible myocardial ischaemia. Current guidelines state that decision-making about coronary revascularisation should be guided by myocardial ischaemia. However, coronary angiography and noninvasive stress testing quite often do not provide sufficient information about the presence or localisation of inducible myocardial ischaemia. Fractional flow reserve (FFR) is a very accurate and lesion-specific index to indicate if a particular stenosis or coronary segment can be held responsible for ischaemia or not, thereby facilitating ischaemia-driven coronary revascularisation in many patients in the cathlab , , , . It has been shown that deferring stenting in a FFR-negative stenosis is safe and associated with excellent long-term outcome. Vice versa, it has also been shown that revascularisation of a FFR-positive stenosis is associated with significant decrease of ischaemia and improved outcome , , .
FFR is defined as the maximum achievable blood flow to a myocardial territory in the presence of a stenosis as a ratio to the normal maximum achievable blood flow to that same myocardial territory in the hypothetical situation the supplying vessel would be completely normal. In other words, FFR expresses maximal blood flow in the presence of a stenosis as a fraction of normal maximum blood flow. The concept of FFR was developed to investigate the functional significance of a coronary artery stenosis . This index is considered the gold standard for the detection of myocardial ischaemia related to a particular stenosis. Nowadays, FFR is a routinely available diagnostic tool, which is used for clinical decision-making in most catheterisation laboratories. In 2021, FFR was measured in more than a million patients worldwide. As will be explained, although FFR is a ratio of flows, it can easily be measured by the ratio of distal coronary pressure to aortic pressure at maximum hyperaemia (Figure 3).
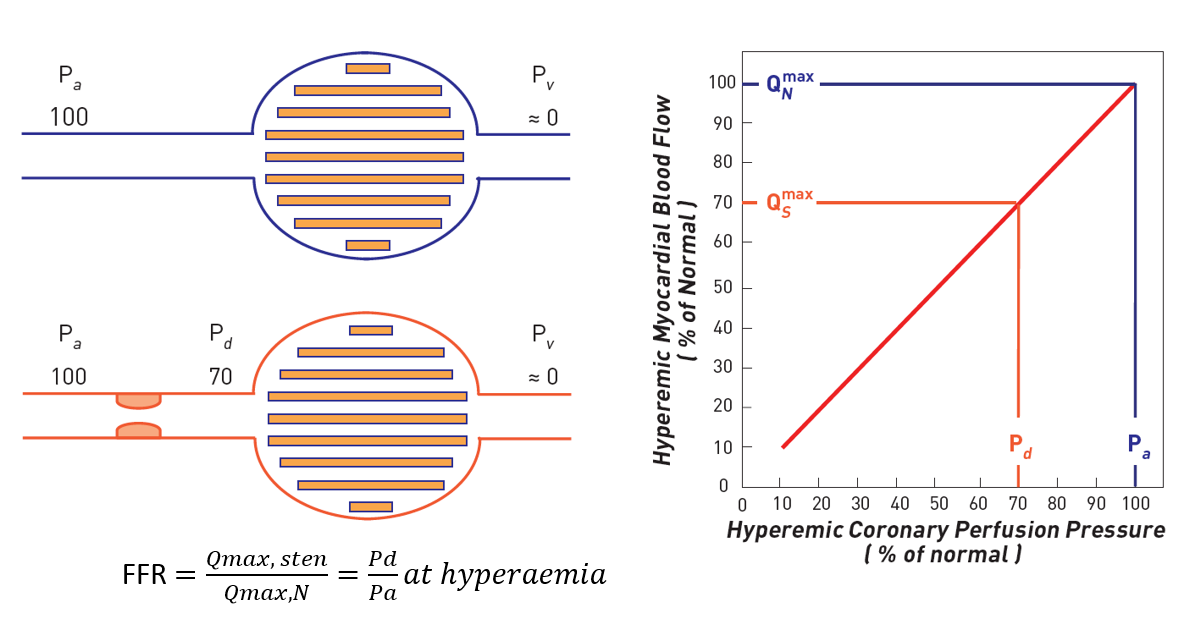
Concept of fractional flow reserve (FFR) measurements. When no epicardial stenosis is present (blue lines) the driving pressure Pa determines a normal (100%) maximal myocardial blood flow. In case of stenosis responsible for a hyperaemic pressure gradient of 30 mmHg (red lines), the driving pressure will no longer be 100 mm Hg but 70 mm Hg (Pd). Since during maximal hyperaemia the relationship between driving pressure and myocardial blood flow is linear, myocardial blood flow will only reach 70% of its normal value. This numerical example shows how a ratio of two pressure (Pd/Pa) corresponds to a ratio of two flows (QSmax / QNmax). It also illustrates how important it is to induce maximal hyperaemia.
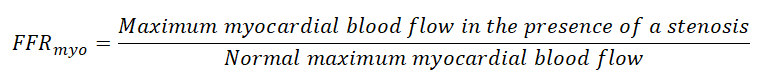
The exercise tolerance of patients with stable coronary artery disease is determined by maximum achievable myocardial blood flow. Therefore, from the practical point of view of the patient, maximum achievable myocardial blood flow is the most important parameter to quantify the severity of coronary disease. In the presence of a stenosis, the exercise level at which ischaemia occurs is directly related to the maximum coronary blood flow that is still achievable by the stenotic coronary artery. Therefore, not “resting flow” but “maximum achievable blood flow” to the myocardium is the best parameter to determine the functional capacity of the patient. Expressing myocardial blood flow in absolute dimensions (ml/min), however, has the disadvantages to be dependent on the size of the distribution area, which is unknown and which will differ between patients, vessels and distribution areas. To overcome this, it is better to express maximum achievable (stenotic) blood flow as a ratio to normal maximum blood flow. Consequently, the ratio between maximum achievable stenotic blood flow and maximum achievable normal blood flow is called fractional flow reserve of the myocardium (FFRmyo) , , . In general, FFRmyo is simply called FFR.
This index is not dependent on resting flow or changing haemodynamic conditions, has a normal value of 1.0 for every patient and every artery, takes into account the extent of the perfusion area and presence of collaterals, and is therefore not subject to many of the limitations related to the concept of coronary flow reserve. More importantly, for FFR there is a clear threshold value with a narrow grey zone (0.75-0.80), discriminating stenoses which are responsible for inducible myocardial ischaemia or not. Therefore, FFR is a suitable tool for guiding decision-making with respect to performing coronary interventions.
Finally, unlike non-hyperemic pressure indices, FFR is linearly related to maximum blood flow and thereby not only enables qualitatively the presence of ischaemia, but is also a measure of the depth of ischaemia and can be used to assess the improvement by PCI .
Under circumstances generally present in the coronary catheterisation laboratory, it has been difficult for a long time to measure flow and flow ratios directly. However, by using a pressure-monitoring guidewire at maximum hyperaemia it is possible to calculate this ratio of flows by a ratio of pressures. This can be understood from Figure 3. At maximum hyperaemia, myocardial perfusion pressure and myocardial flow are linearly proportional, and a change in myocardial perfusion pressure results in a proportional change in myocardial flow. In the case of a normal coronary artery, the epicardial artery does not have any noticeable resistance to flow, and the pressure in the distal coronary artery is equal to aortic pressure. In the example, therefore, myocardial perfusion pressure (defined as distal coronary pressure Pd minus venous pressure Pv) equals 100 mmHg. In case of a stenosis, however, this stenosis creates an additional resistance to blood flow, and distal coronary pressure will be lower than aortic pressure: a pressure gradient exists across the stenosis (in the example Pa-Pd = 30 mmHg) and myocardial perfusion pressure will be diminished (in the example Pd-Pv = 70 mmHg). In the example, therefore, myocardial perfusion pressure has decreased to 70 mmHg, whereas it should be 100 mmHg in the normal case. Because, during maximum hyperaemia, myocardial perfusion pressure is directly proportional to myocardial flow, the ratio of maximum stenotic and normal maximum flow can be expressed as the ratio of distal coronary pressure and aortic pressure at hyperaemia, and in the aforementioned example equals 0.70.
Therefore:
can be expressed as:
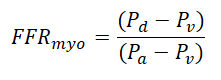
Because generally central venous pressure is much smaller than Pd and Pa and close to zero, the equation can be further simplified to:
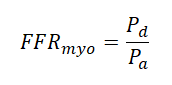
As Pa can be measured in a regular way by the coronary or guiding catheter, and Pd is obtainable simultaneously by crossing the stenosis with a sensor-tipped guidewire, it is clear that FFR can be simply obtained, both during diagnostic and interventional procedures, by measuring the respective pressures at maximum hyperaemia (Figure 4 and Figure 5).
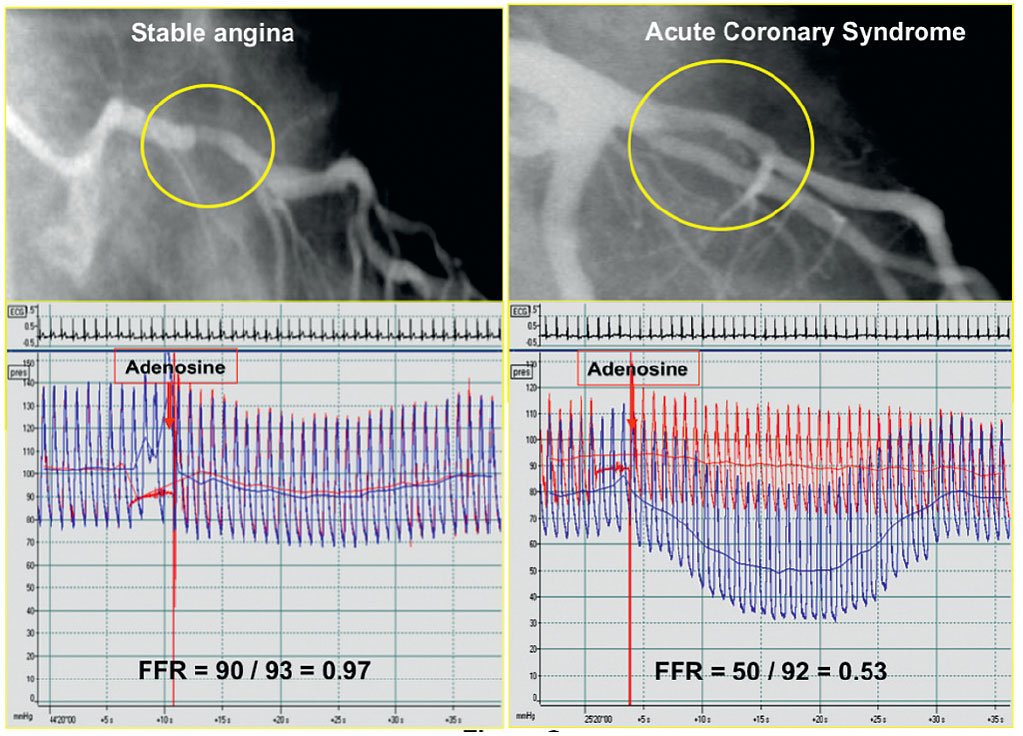
Example of FFR with an ambiguous stenosis causing significant ischaemia. During maximum coronary hyperemia, myocardial blood flow is proportional to coronary perfusion pressure. With a pressure sensor-tipped guidewire and an adequate hyperaemic stimulus, FFR can be calculated as the ratio Pd/Pa. The lower part of this figure shows pressure tracings as displayed on an analyser, derived from a sensor-tipped wire, with the sensor placed distal from the stenosis (Pd, green signal) in the left anterior descending (LAD) artery, and from the tip of the guiding catheter (Pa, red signal). Despite the fact that the narrowing (arrow) does not look very severe on the coronary angiogram, its physiological or haemodynamic impact is important as reflected by the low value of FFR of 0.57, indicating that as a result of this stenosis, maximum blood flow to the anterior wall in this patient has decreased to 57% of its normal value, without stenosis.
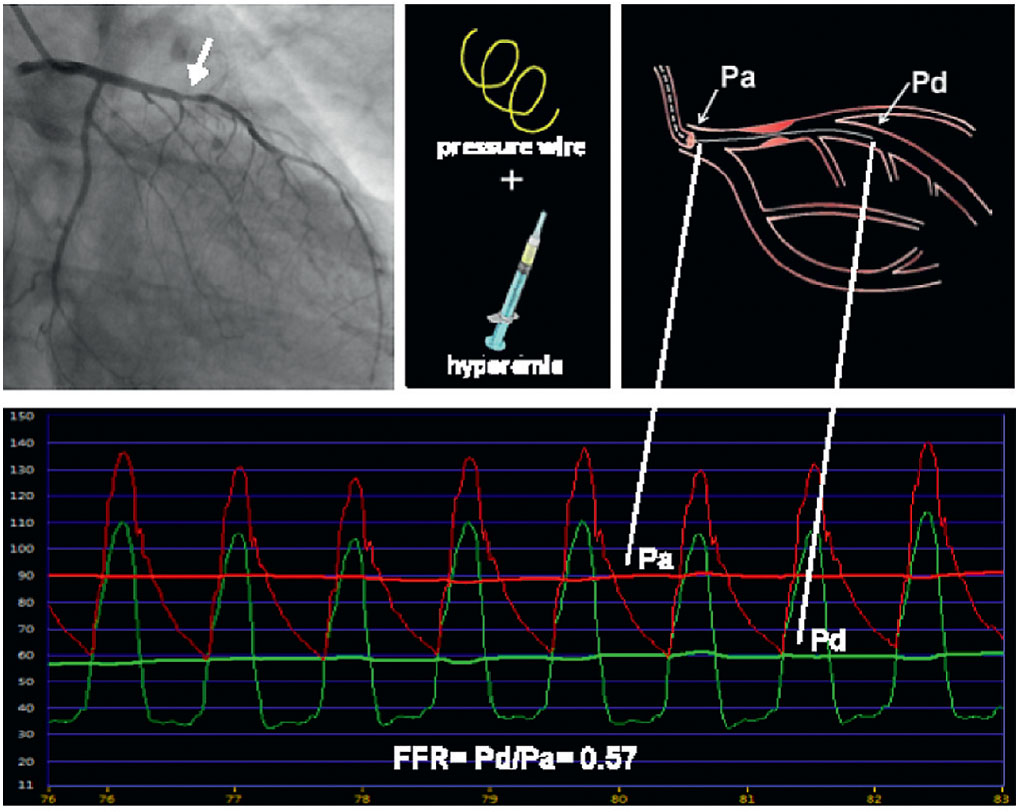
An accurate FFR measurement requires minimalization of microvascular resistance. Typical example of simultaneous aortic pressure (Pa) and distal coronary pressure (Pd) recordings at rest and during maximal steadystate hyperaemia as induced by an intravenous infusion of adenosine. Fractional flow reserve is simply calculated as the ratio between mean distal coronary pressure and mean aortic pressure during steady state maximum hyperaemia.
From the equations above it is also obvious that FFRmyo for a normal coronary artery equals 1.0 for every person and for every coronary artery.
FFR has a direct clinical equivalent: an FFR of 0.60 means that the maximum blood flow (and oxygen supply) to the myocardial distribution of the respective artery only reaches 60% of what it would be if that artery were completely normal. An increase to 0.90 after stenting indicates that maximum blood supply has now increased by 50%.
FFR has a high accuracy for detecting myocardial ischaemia. More specifically, FFR <0.75 has 100% specificity for indicating inducible ischaemia, whereas a FFR >0.80 has a sensitivity of >90% for excluding inducible ischaemia. This extremely high accuracy of FFR is unique. In a study of 45 patients with angiographically dubious stenoses, it was shown that FFR is much more accurate in distinguishing haemodynamically significant stenoses than exercise ECG, myocardial perfusion scintigraphy, and stress echocardiography taken separately . This was shown using a so-called sequential Bayesian approach, providing proof that FFR can indeed be considered as a true gold standard (Figure 6). The cutoff threshold values have been confirmed in multiple clinical studies in many different populations, comparing FFR measurement to non-invasive tests for inducible myocardial ischaemia , , , , , .
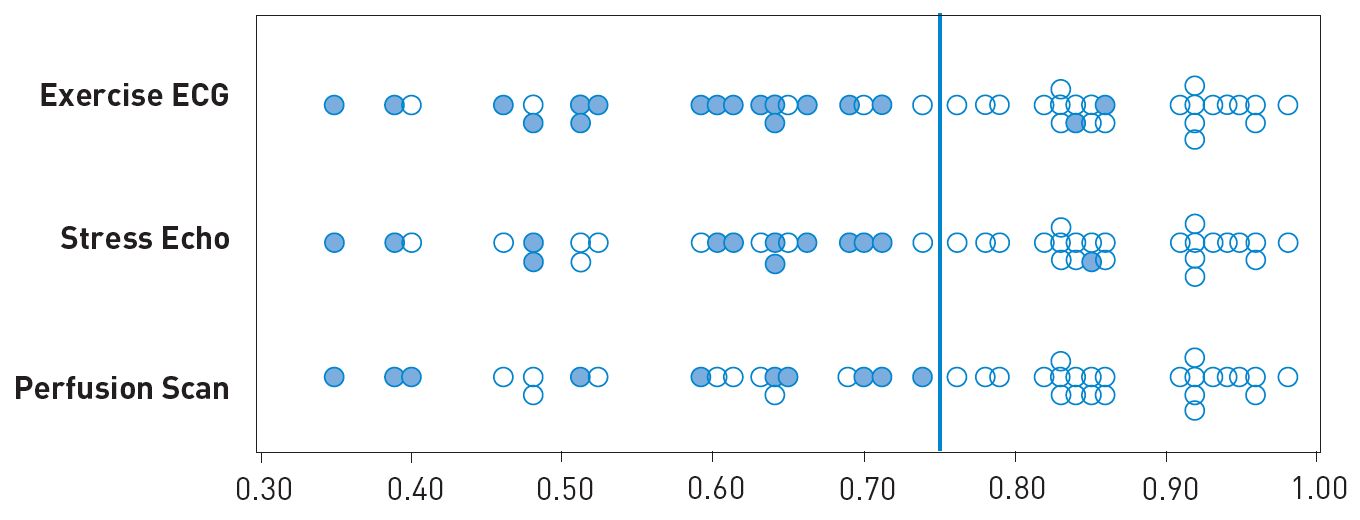
Relation between FFR and angiographically intermediate stenosis. Plots of the FFR in 45 patients with an angiographically intermediate stenosis according to the results of non-invasive testing. The circles represent negative tests. The dots represent positive tests. Tests were considered true positive only if they were positive before revascularisation and reversed to negative after succesfull revascularisation. FFR was considered positive if at least one test was unequivocally true positive before intervention and returned to negative thereafter. FFR was considered negative if all 3 tests could be exhaustively performed within 24 hours without ischemia (reference 35).
Multiple studies have convincingly shown that stenting a coronary stenosis in patients with a fractional flow reserve below 0.75-0.80 improves functional class and prognosis, whereas stenting stenoses above that threshold does not and is therefore not recommended , , , , , .
Generally, guide catheters are used when measuring FFR. The use of diagnostic catheters is technically feasible. However, due to higher levels of friction that hamper wire manipulation, the smaller internal calibre interfering with pressure measurements, and the inability to perform ad hoc percutaneous coronary intervention (PCI) with diagnostic catheters, the use of guiding catheters is recommended.
Measuring intracoronary pressure requires the use of a specific solid-state sensor mounted on a floppy-tipped guidewire. The sensor is located at the junction between the 3-cmlong radiopaque tip and the remainder of the wire. The last generations of these 0.014 inch wires have almost similar handling characteristics to most standard angioplasty guidewires. Before introducing the sensor into the vessel to be studied, the pressures recorded by the sensor and by the guiding catheter should be equalised.
The pressure wire has to be connected to an interface (OPTIS, Abbott St. Paul, MN, USA and Coroflow ®, Coroventis, Uppsala Sweden], OptomonitorTM, [Quebec City, Quebec, CAN], Comet WireTM [Boston Scientific, MA, USA] or ComboMap® Pressure and Flow System [Philips, Best, The Netherlands]), which offers the possibility to record the registrations and which shows FFR immediately.
The “wireless” pressure wire (PressureWire™ Abbott) does not need to be connected to an interface any more. Its pressure signal is transmitted wirelessly and displayed together with the aortic pressure on the normal haemodynamic monitoring system of the catheterisation laboratory, greatly facilitating the use of coronary pressure. A new software platform, called Coroventis, greatly facilitates interpretation of all physiologic data, and automatic storage of FFR and all other physiological measurements and is compatible with all trademarks of pressure wires. (Coroventis ®, Uppsala, Sweden). Also a variety of indices to quantify microvascular (dys)function, such as IMR, CFR, absolute coronary blood flow and resistance, and microvascular resistance reserve (MRR), can be monitored and interpreted by that Coroventis software platform
FFR, by definition, represents an index of maximum blood flow. Therefore, it is absolutely essential to induce maximal vasodilatation of the two compartments of the coronary circulation (epicardial or conductance arteries and the microvasculature or resistance arteries). The pharmacological options for inducing hyperaemia are summarised in table 1 .
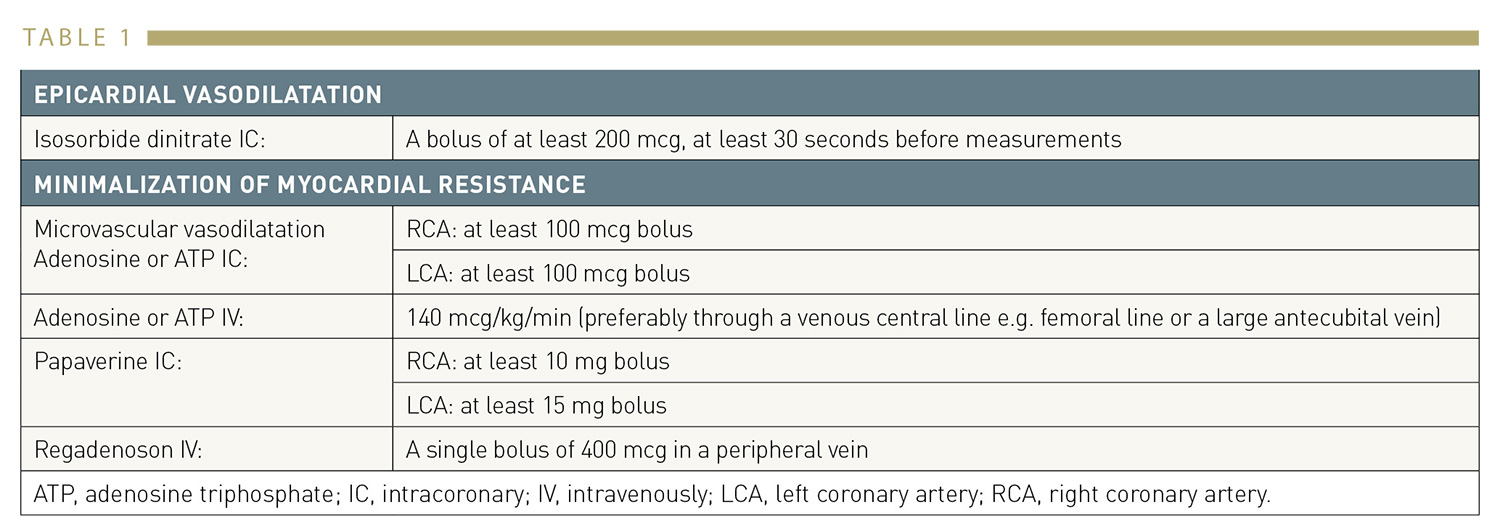
Pharmacological agents for the induction of vasodilation/hyperaemia
A standard bolus of 200 mcg of intracoronary isosorbide dinitrate (or any other form of nitrate) allows the abolition of any form of epicardial vasoconstriction and is routine for any coronary angiography.
In addition, microvascular vasodilation is paramount for the calculation of FFR. To gauge pressure differences at rest does not offer a definitive measure. It cannot be emphasised strongly enough that there is no such thing as a “baseline FFR”. Even when the resting pressure gradient is large, it is recommended to induce hyperaemia because it allows evaluation of the residual resistance reserve. The gold standard for steady state hyperaemia is i.v. administration of adenosine by a central or large peripheral vein, resulting in beautiful steady state hyperaemia from 30-120 seconds after start of the infusion and present as long as the infusion lasts. Sometimes, periodic fluctuations in hyperaemic level can occur due to the rapid metabolism of adenosine, FFR is taken then at the ‘lowest’ point. Typical examples of a coronary pressure tracing during the administration of intravenous adenosine are shown in Figure 5 and Figure 6.
Recently, a new hyperaemic drug has been introduced and approved for inducing coronary hyperaemia: regadenoson, a selective Adenosine-A2 receptor antagonist, which can be given as a, bodyweight-independent, single bolus. Regadenoson can be injected in a central or peripheral vein, inducing maximum hyperemia similar to central venous adenosine. A hyperemic plateau duration of 30-120 seconds with regadenoson ensures sufficient time for a pressure pull back recording (see also next paragraph). Regadenoson is approved now for inducing coronary hyperaemia in many European countries under the name Rapiscan ® (or Lexiscan ® in the USA).
It should be noted that i.v infusion of adenosine is accompanied by angina-like chest pain in the vast majority of patients. This chest pain is not true angina but caused by stimulation of free nerve fibers in the heart by adenosine (which is also the intrinsic transmitter of angina because during real-life ischemia, c-AMP is not metabolized anymore to ATP but degraded to adenosine). That i.v adenosine related chest pain is harmless and can just be considered as a sign that the drug ‘works’. The only side effect of i.v adenosine, is that in very few patients (<1:1000) with severe asthma, an asthma attack may be provoked. If that happens, the antidotum is theophylline. Because of logistic reasons and to avoid adenosine, so-called non hyperemic pressure ratio’s (NHPR’s) have been introduced, avoiding the need for hyperemia at the cost of a lower diagnostic accuracy, in particular in high-risk patients as will be discussed later on in this chapter and elsewhere in this textbook.
FFR has a number of unique characteristics that make this index particularly suitable for functional assessment of coronary stenoses and clinical decision-making in the catheterisation laboratory.
FFR has a theoretical normal value of 1 for every patient, for every artery, and for every myocardial bed. An unequivocally normal value is easy to refer to but is generally rare in clinical medicine. This, therefore, is a unique advantage of FFR. Since in a normal epicardial coronary artery there is virtually no decline in pressure (not even during maximal hyperaemia), it is obvious that Pd/Pa will equal or be very close to unity . This means that normal epicardial arteries do not noticeably contribute to the total resistance to coronary blood flow. The lowest value found in a total of 65 strictly normal coronary arteries was 0.94 . Yet it is important to realise that, in normal-looking coronary arteries in patients with proven atherosclerosis elsewhere, the epicardial coronary arteries may contribute to total resistance to coronary blood flow even though there is no discrete stenosis visible on the angiogram. In approximately 50% of these arteries, FFR is lower than the lowest value found in strictly normal individuals. In approximately 10% of atherosclerotic arteries, FFR will even be lower than the ischaemic threshold. Practically speaking, this finding implies that myocardial ischaemia due to diffuse disease might be present in atherosclerotic patients in the absence of discrete stenoses.
FFR has a well-defined cut-off value with a narrow “grey zone” between 0.75 and 0.80. Cut-off or threshold values are values that distinguish ischaemic from non-ischaemic levels for a given measurement. To enable adequate clinical decision-making in individual patients, it is paramount that the level of uncertainty is reduced to a minimum. Stenoses with a FFR <0.75 are almost invariably able to induce myocardial ischaemia; while stenoses with a FFR >0.80 are almost never associated with exercise-induced ischaemia. This means that the “grey zone” for FFR (between 0.75–0.80) spans over <10% of the entire range of FFR values.
FFR is the only index of ischaemia which has been validated versus a true gold standard (Figure 6) . Over the last few years, many studies have been performed examining the grey zone and in all these studies invariably a best cut-off value between 0.75–0.80 was found in many subsets of patients including left main disease, diabetes, multivessel disease, previous infarction, etc. , , , , . The practical lesson, therefore, is that in a stenosis with FFR ≤0.75 stenting is almost always justified (if technically feasible), whereas in a stenosis with FFR >0.80 stenting can be safely deferred and optimum medical treatment is sufficient. Between 0.76–0.80, sound clinical judgement (taking into account the character of complaints, results of non-invasive tests if available, and whether a pressure gradient is focal or diffuse) should balance the final decision. We also refer to the short discussion of the PPG later on in this chapter .
FFR is not influenced by systemic haemodynamics. In the catheterisation laboratory, systemic pressure, heart rate and LV contractility are prone to change. In contrast to many other indices measured in the catheterisation laboratory, changes in systemic haemodynamics do not influence the value of FFR in a given coronary stenosis . In addition, FFR measurements are extremely reproducible . This is due not only to the fact that aortic and distal coronary pressures are measured simultaneously, but also to the extraordinary capability of the microvasculature to vasodilate repeatedly to exactly the same extent. These characteristics contribute to the accuracy of the method and to the trust in its value for clinical decision-making.
FFR takes into account the contribution of collaterals. Whether myocardial flow is provided antegradely by the epicardial artery or retrogradely through collaterals does not really matter for the myocardium. Distal coronary pressure during maximal hyperaemia reflects both antegrade and retrograde flow according to their respective contribution , . This holds for the stenoses supplied by collaterals but also for stenosed arteries providing collaterals to another more critically diseased vessel. Figure 7 shows the influence on the FFR measurements of left to right collaterals.
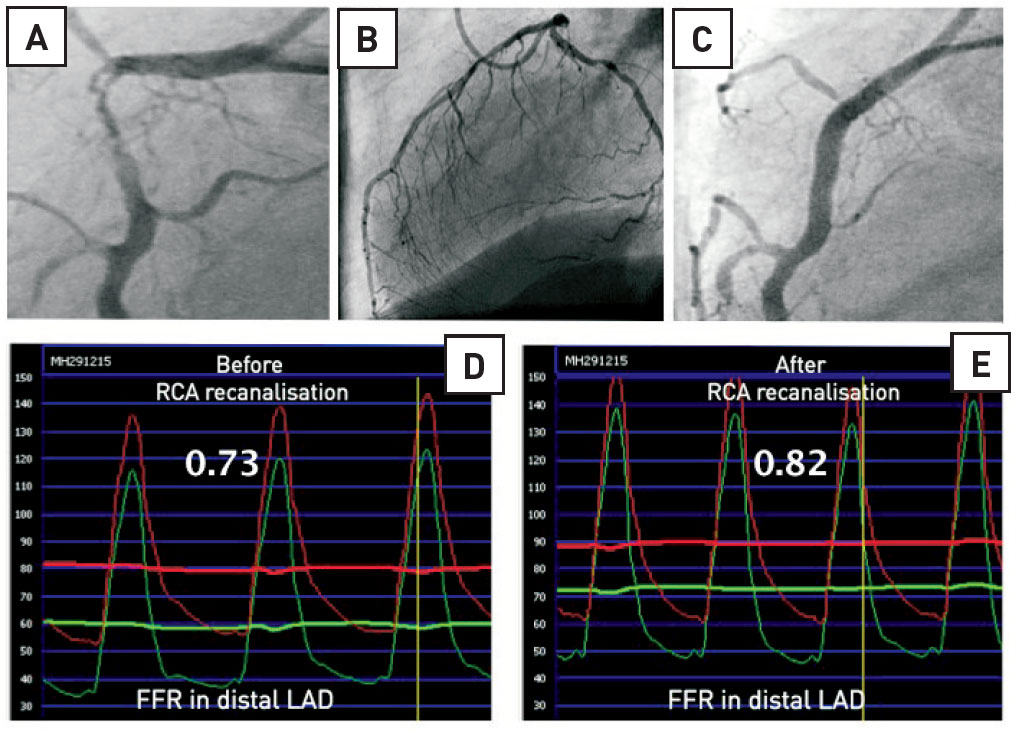
Influence of collaterals on FFR. Example of the influence of collaterals on FFR measurements in a 76-year-old man with a critical stenosis in the proximal RCA (panel A) and collaterals supplied by the left coronary artery (panel B). The FFR in the distal LAD was measured first before recanalization of the RCA (panel D) and after recanalisation of the RCA (panel C and E). When antegrade flow was restored in the RCA, the LAD had no longer to supply blood to the territory of the RCA. Therefore, hyperaemic flow in the LAD was lower than before and the FFR increased from 0.73 to 0.82. This example also illustrates the relationship between FFR and the myocardial mass supplied by the artery: the larger the myocardial mass, the larger hyperaemic flow, the lower the FFR for a given stenosis.
Note: The concept of FFR not only relates to myocardial flow (FFRmyo or simply FFR) but also enables separate assessment of the contribution of coronary artery flow (FFRcor) and collateral flow (FFRcoll) to total myocardial blood flow, provided that also coronary occlusion pressure (Pw) is measured . In clinical practice, most often only FFR is used and for further study of the complete concept, we refer to reference 39.
FFR specifically relates the severity of the stenosis to the mass of tissue to be perfused: “normalisation for perfusion area”. The larger the myocardial mass subtended by a vessel, the larger the hyperaemic flow and, in turn, the larger the gradient and the lower the FFR for a given stenosis. This explains why a stenosis with a minimal cross-sectional area of 4 mm 2 has totally different haemodynamic significance in the proximal LAD versus the second marginal branch. It also means that the haemodynamic significance of a particular stenosis may change if the perfusion territory changes (such as is the case after myocardial infarction) , . These changes are also accounted for by FFR (see Fractional flow reserve and myocardial infarction)
FFR has unequalled spatial resolution. The exact position of the sensor in the coronary tree can be monitored under fluoroscopy and documented angiographically. Pulling back the sensor under maximal hyperaemia gives the operator an instantaneous assessment of the abnormal resistance of the arterial segment located between the guide catheter and the sensor. While other functional tests reach a “per patient” accuracy (exercise ECG) or, at best, a “per vessel” accuracy (myocardial perfusion imaging or stress echo/MRI), FFR reaches a “per segment” accuracy with a spatial resolution of a few millimetres. Of importance, gradients within a coronary artery at hyperaemia are generally 2-3 times higher than at rest. As a consequence, the resolution of the hyperaemic pullback recording is 2-3 times higher than the pullback recording at rest. True quantification of such pressure pullback recording through (a long segment of) the coronary, has recently been synthesized within one index, called PPG as will be discussed later .
FFR is highly reproducible. Figure 8 shows the reproducibility of FFR In the recent VERIFY study, which was found to be extremely high. Similar excellent reproducibility was found in numerous other studies ,
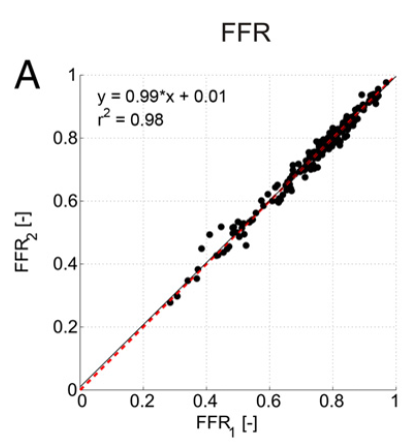
Reproducibility of FFR Scatterplot showing reproducibility of FFR. Line of identity is in red (dashed). Linear regression equation line is shown in solid black.
Cardiologists have a large glossary to describe coronary narrowings with uncertain functional consequences: mild to moderate stenoses, dubious lesions, intermediate stenoses, non-flow limiting, non-significant stenoses. The multiplicity of these denominations betrays the inaccuracy of methods to assess those lesions. One of the standard indications for FFR is the precise assessment of the functional consequences of a given coronary stenosis with unclear haemodynamic significance. In a study of 45 patients with angiographically equivocal stenoses, it was shown that FFR is much more accurate in distinguishing haemodynamically significant stenoses than exercise ECG, myocardial perfusion scintigraphy, and stress echocardiography taken separately . This was shown using a so-called sequential Bayesian approach, providing proof that FFR can indeed be considered as the true gold standard (Figure 6).
Furthermore, results of non-invasive tests are often contradictory, which renders appropriate clinical decision-making difficult. In addition, the clinical outcome of patients in whom PCI is deferred because FFR indicated no haemodynamically significant stenosis is very favourable. In such a population, the risk of cardiac death or myocardial infarction is approximately 1% per year, and this risk is not decreased by PCI . These results strongly support the use of FFR measurements as a guide for decision-making about the need for revascularisation in “intermediate” lesions.
Figure 9 illustrates how two angiographically similar stenoses may each have a completely different haemodynamic severity. One of them should be revascularised, the other not. Based solely on the angiogram, the decision would be to intervene in both cases, thus leading to an inappropriate treatment strategy in one of these patients.
Example of two patients in whom an angiographically similar stenosis is found in the proximal left anterior descending coronary artery. In the left example the lesion has no haemodynamic significance and does not need any form of mechanical revascularisation. In the right example the stenosis is haemodynamically very significant and deserves PCI.
As outlined in the first part of this chapter, non-invasive stress testing and coronary angiography will not always provide adequate and complete information about the functional importance of coronary artery stenoses (Figure 10).
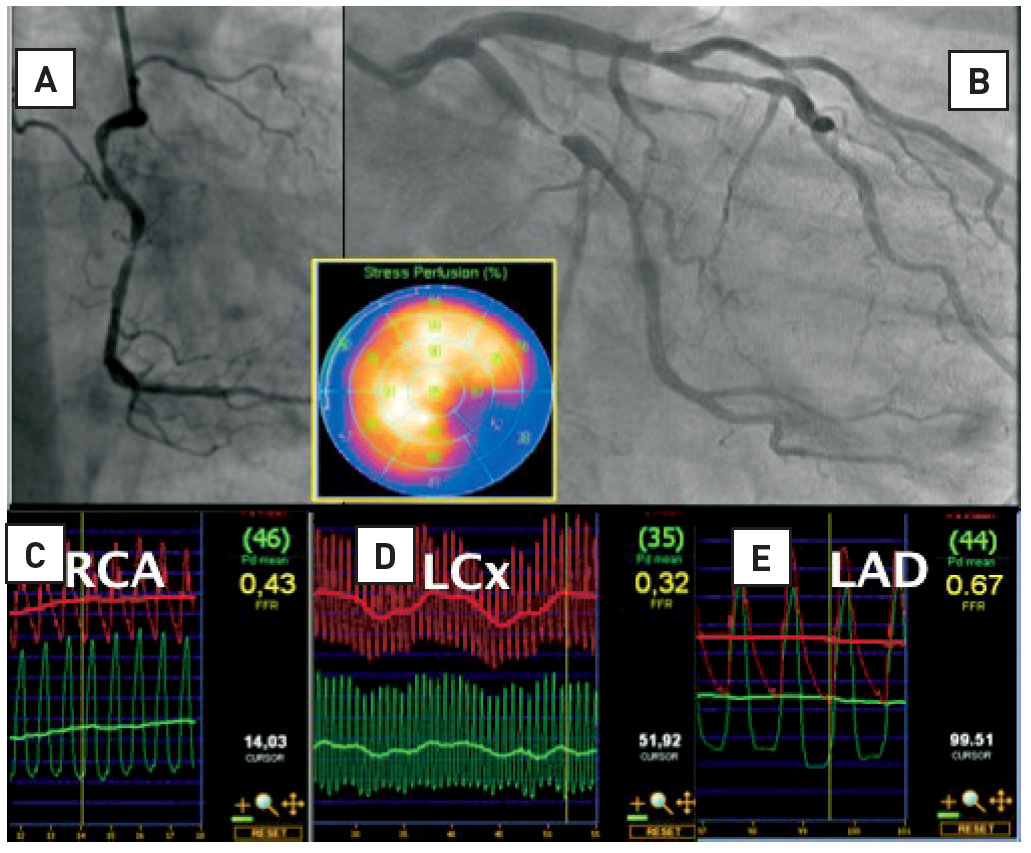
Multivessel disease and nuclear imaging : risk of ‘balanced’ ischaemia. Patient with severe angina. Myocardial perfusion imaging (MPI) showed a reversible defect in the inferolateral segments. From the angiogram it is obvious that the right coronary artery (RCA) and the left circumflex artery (RCX) are significantly narrowed. However, the mid left anterior descending artery (LAD) stenosis, considered “non-significant” on the angiogram, appears to be hemodynamically signifcant. This LAD stenosis was undetected by MPI because the uptake of tracer is markedly worse in the RCX territory than in the LAD territory. Therefore, ischemia in the anterior wall is masked by more severe ischemia in the lateral/inferior wall.
Particularly in patients with multivessel disease, it can be difficult to determine which out of several lesions is responsible for myocardial ischaemia and therefore warrant revascularisation. In such patients, an easily obtainable physiological index like FFR can be of help in guiding decision-making about the choice of those coronary artery stenoses that benefit from stenting.
In a retrospective study in patients with multivessel disease who underwent stenting of ischaemic lesions according to FFR and deferral of stenting of other lesions because the FFR indicated absence of ischaemia, the 3-year event rate related to the deferred lesion was low . Another retrospective analysis of patients with multivessel disease compared a group of patients who underwent PCI based on guidance by angiography to a group of patients who underwent PCI based on guidance by FFR . In the FFR-guided group, fewer vessels were treated and costs were lower. Also, the outcome after 30 months was significantly better in the group that underwent PCI based on guidance by FFR.
Incontrovertible proof of the benefit of FFR-guided multivessel PCI compared to standard angiography was provided in the large randomised multicentre FAME study , . In that study, it was demonstrated that all types of major adverse events were decreased by 30-35% in the first year after PCI in multivessel disease, when guided by FFR (Figure 11). This was achieved at a lower cost and without prolonging the interventional procedure, whereas angina in FFR-guided patients was relieved at least as effectively .
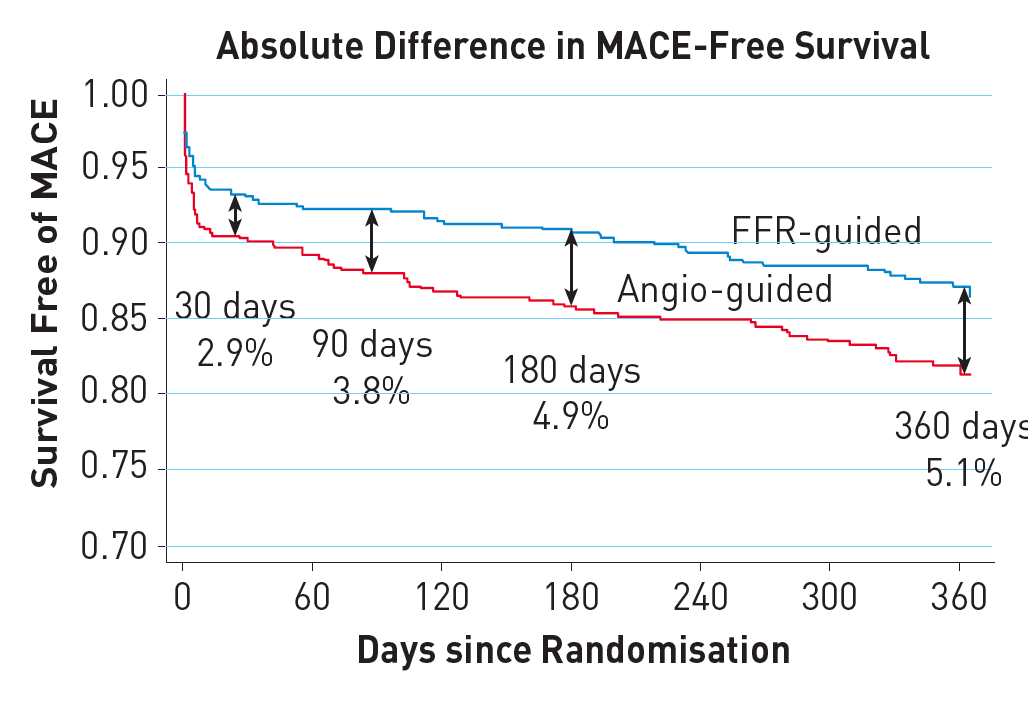
Survival curves in the landmark FAME study. Kaplan-Meier curve showing survival free from MACE at 1 year, which was the primary endpoint in the Fractional Flow Reserve versus Angiography in Multivessel Evaluation (FAME) study. The international, multicentre FAME study compared angiography-guided PCI to FFRguided PCI in patients with multivessel coronary artery disease in a randomised fashion. FFR-guided PCI significantly reduced the primary endpoint (p=0.02)). (reference 32). Differences persisted at 2 years and at 5 years follow up (reference 54).
After 2 years, the favourable effects of an FFR-guided strategy were maintained as reflected by a significant reduction in the combined rate of death and myocardial infarction, but also in the rate of myocardial infarction alone . Even after 5 years, differences remained intact, but lost statistical significance because the smaller number of patients at risk .
Economic evaluation of the FAME study revealed that FFR-guided PCI in patients with multivessel disease is one of those rare situations in modern medicine in which a new technology not only improves outcome, but also saves resources .
Recently, a large meta-analysis by Zimmermann et al confirmed that PCI in stable angina, based upon FFR measurements, prolongs life and decreases infarction in comparison to medical treatment alone . In studies comparing outcomes after PCI vs medical treatment (like ORBITA), it has often be claimed that medical treatment would be non-inferior to PCI with respect to hard endpoints (death and MI) . But in all of these studies, decisions as to which lesion should be stented or not were based upon angiography instead of FFR. That means that a number of non-ischaemic lesions in those studies were inadvertently stented, whereas some ischaemic lesions were not, resulting in a considerable potential for bias.
A typical example of a patient with multivessel coronary artery disease which was treated by FFR-guided PCI is shown in Figure 12 (Illustrative Case 1).
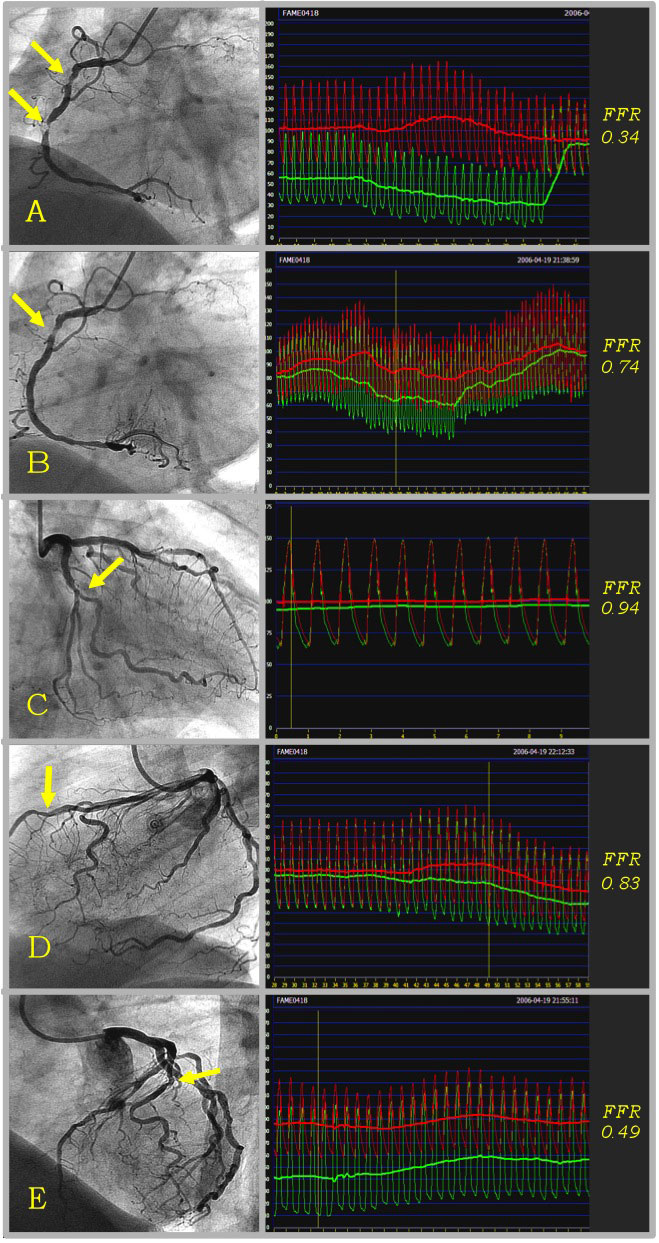
Example of FFR in multivessel coronary disease. Example of a FAME study patient, treated by FFR-guided PCI. This patient had 5 stenoses that were indicated by the operator as requiring stent placement on the basis of the angiogram and clinical data. Thereafter this patient with multivessel coronary artery disease was randomised to the FFR-guided strategy, which means that only stenoses with FFR ≤ 0.80 (below the ischaemic threshold) are to be stented. FFR of the 2 tight stenoses in the RCA was 0.34 (Panel A). A stent was placed in the distal stenosis, and FFR thereafter was 0.74 (Panel B). A second stent was placed in the proximal stenosis (FFR after stenting of the RCA was 0.87). FFR of the RCX was 0.94 (Panel C), and this stenosis was therefore not stented. The 50-70% stenosis in the LAD was also not stented because of an FFR above the ischaemic threshold of 0.80 (Panel D). The FFR of the 50-70% stenosis in the diagonal branch was 0.49 (Panel E), and a stent was placed with a good angiographic result (FFR after stenting in the diagonal was not recorded). The total procedure time was 46 minutes. Only 3 out of the 5 indicated stenoses needed stent placement after assessment by FFR.
The presence of a significant stenosis in the left main stem is of critical prognostic importance . Conversely, revascularisation of a non-significant stenosis in the left main may lead to atresia of the conduits, especially when internal mammary arteries are used . Furthermore, the left main is among the most difficult segments to assess by angiography . Non-invasive testing is often non-contributive in patients with a left main stenosis. Perfusion defects are often seen in only one vascular territory, especially when the right coronary artery is significantly diseased . In addition, tracer uptake may be reduced in all vascular territories (“balanced” ischaemia), giving rise to false negative studies . Several studies have shown that FFR could be used safely in left main stenosis and that the decision not to operate on left main stenosis with an FFR above the ischaemic threshold is safe , , , . In addition, angiographic assessments of left main lesions with an FFR <0.75 were no different from those with an FFR >0.75, further reinforcing the importance of physiological parameters in case of doubt. Therefore, patients with an intermediate left main stenosis deserve physiologic assessment before blindly taking a decision about the need for revascularisation. Moreover, the recently published ESC guidelines on coronary revascularisation state that revascularisation of left main disease is indicated (class I level A) if myocardial ischaemia has been documented non-invasively, or by FFR <0.80 in left main angiographic diameter stenosis of 50-90% . Since noninvasive evidence for ischaemia is not infrequently absent in left main cases, FFR provides the interventional cardiologist with crucial information to make proper decisions about revascularisation in such patients. Two case examples in Figure 13 illustrate how FFR measurements in the left main coronary artery may decisively influence the type of treatment in these patients.
Example of FFR in left main disease. Example of two patients in whom fractional flow reserve (FFR) measurements in an angiographically intermediate left main stenosis changed the therapeutic strategy. The first (upper panel) represents a 61-year old female patient. Her exercise test was non-conclusive and her nuclear scan result was unclear, showing possible apical ischaemia. She was referred for bypass surgery because of a distal left main stenosis. Before making a decision about revascularisation, FFR was performed. FFR was 0.87, indicating that the left main stenosis is not responsible for myocardial ischaemia. The patient was treated by medical therapy, instead of bypass surgery and had an excellent follow up.The second (lower panel) represents a 76-year old male with typical chest pain. Nuclear scan showed ischaemia inferolateral. The patient was referred for PCI of the proximal RCX. However, when making additional diagnostic angiographic views of the left coronary artery in the PCI centre, an intermediate mid left main stenosis was visualised. FFR was measured (pressure sensor in LAD) and it revealed (FFR 0.74) a physiologically important left main stenosis. The therapeutic strategy was changed from PCI of the RCX to bypass surgery because of a significant left main stenosis.
Left main disease is rarely isolated. It is important to realise that, when tight stenoses are present in the LAD or in the LCX, the presence of these lesions will tend to increase the FFR measured across the left main. The influence of a LAD/ LCX lesion on the FFR value of the left main will depend on the severity of this distal stenosis but, even more, on the vascular territory supplied by this distal stenosis. For example, if the distal stenosis is in the proximal LAD, it may impact on the stenosis in the left main. If the distal stenosis is located in a small second marginal branch, its influence on the left main stenosis will be minimal .
Overlapping of vessel segments as well as radiographic artefacts render bifurcation stenoses particularly difficult to evaluate at angiography, while PCI of bifurcations is often more challenging than for regular stenoses. The principle of FFR-guided PCI applies in bifurcation lesions even though clinical outcome data are currently limited. Two recent studies by Koo and colleagues used FFR in the setting of bifurcation stenting , . The results of these studies can be summarised as follows: (1) after stenting the main branch, the ostium of the side branch often looks “pinched”; however, such stenoses are grossly overestimated by angiography - none of these ostial lesions with a diameter stenosis <75% was found to have an FFR below 0.75 and TIMI 3 flow in the side branch after stenting the main branch, is strongly associated with FFR >0.75; (2) when kissing balloon dilation was performed only in ostial stenoses with an FFR <0.75, the FFR at 6 months was >0.75 in 95% of cases. These studies favour an approach in bifurcation lesions with stenting of the main branch and kissing balloon thereafter, only if FFR of the side branch is <0.75.
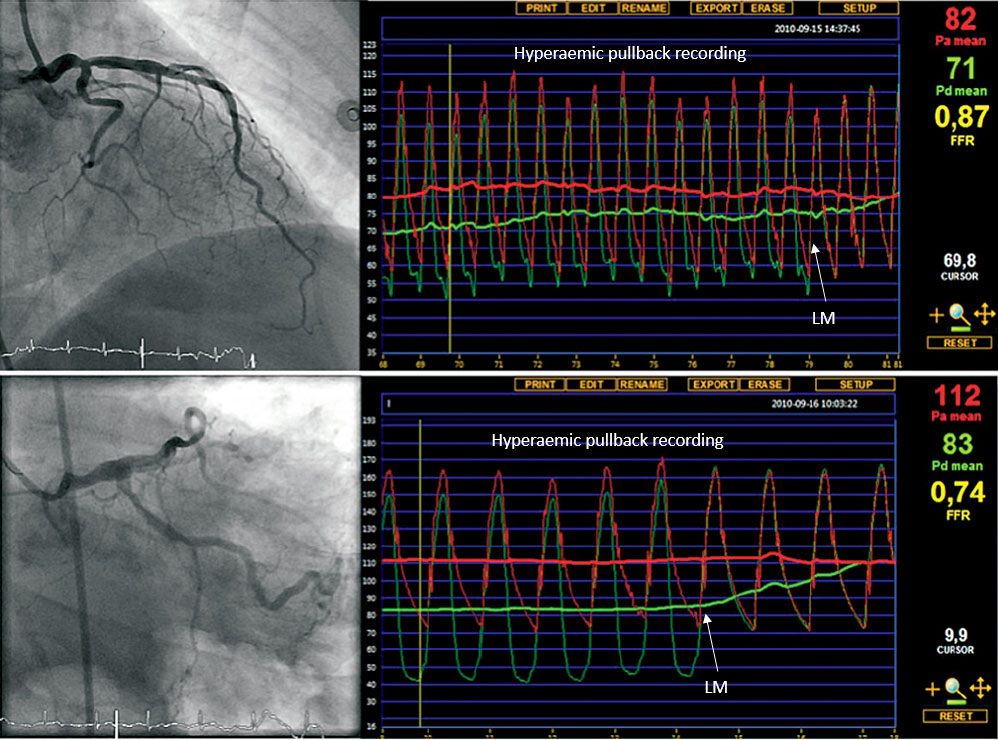
When several stenoses are present in the same artery, the concept and the clinical value of FFR is still valid to assess the effect of all stenoses together. However, it is important to realise in such cases that each of several stenoses will influence hyperaemic blood flow and therefore FFR across the other one. The influence of the distal lesion on the proximal one is generally more pronounced than the reverse. Theoretically, the FFR can be calculated for each stenosis individually , . However, this is neither practical nor easy to perform and therefore of little use in the catheterisation laboratory. Practically, as for diffuse disease, a pull-back manoeuvre under maximal hyperaemia is the best way to appreciate the exact location and physiological significance of sequential stenoses and to guide the interventional procedure step-by-step. It should be noted that pullback recordings at rest, often claimed to provide reliable information about the different lesions, are less accurate because the gradients within a coronary artery are 2-3 times higher at hyperemia and consequently, the resolution of the hyperaemic pullback recording is 2-3 times higher than at rest. A resting pullback recording does not show interaction (‘crosstalk’) between different stenosis, not because interaction is not present but because it is masked. Hyperaemia will unmask such ‘crosstalk’ .
Histopathological studies and, more recently, intravascular ultrasound have shown that atherosclerosis is diffuse in nature and that a discrete stenosis in an otherwise normal artery is actually uncommon. The concept of a ‘’focal’’ lesion is essentially an angiographic description and does not reflect pathology. Until recently, it was believed that, when no focal narrowing of >50% was seen at the angiogram, no abnormal resistance was present in the epicardial artery. It was therefore assumed that distal pressure was normal and thus that “diffuse mild disease without focal stenosis” could not cause myocardial ischaemia. This paradigm has been shifted: the presence of diffuse disease is often associated with a progressive decrease in coronary pressure and flow, and this cannot be clearly assessed from the angiogram , , , . By contrast, this decline in pressure correlates with the total atherosclerotic burden . In approximately 10% of patients this abnormal epicardial resistance may be responsible for reversible myocardial ischaemia. In these patients chest pain is often considered non-coronary because no single focal stenosis is found, and the myocardial perfusion imaging is wrongly considered false positive . Such diffuse disease and its haemodynamic impact should always be kept in mind when performing functional measurements. In a large multicentre registry of 750 patients, FFR was obtained after technically successful stenting. A post-PCI FFR value of <0.9 was still present in almost one third of patients (despite absence of a gradient across the stent), reflecting some degree of diffuse disease, and the lower post-stent FFR, the poorer clinical outcome . The only classical way to demonstrate the haemodynamic impact of diffuse disease is to perform a careful pull-back manoeuvre of the pressure sensor under steady-state maximal hyperaemia (Figure 14). Similar to the situation of tandem lesions, a pullback recording at rest has a lower resolution to detect severity of the diffuse disease.
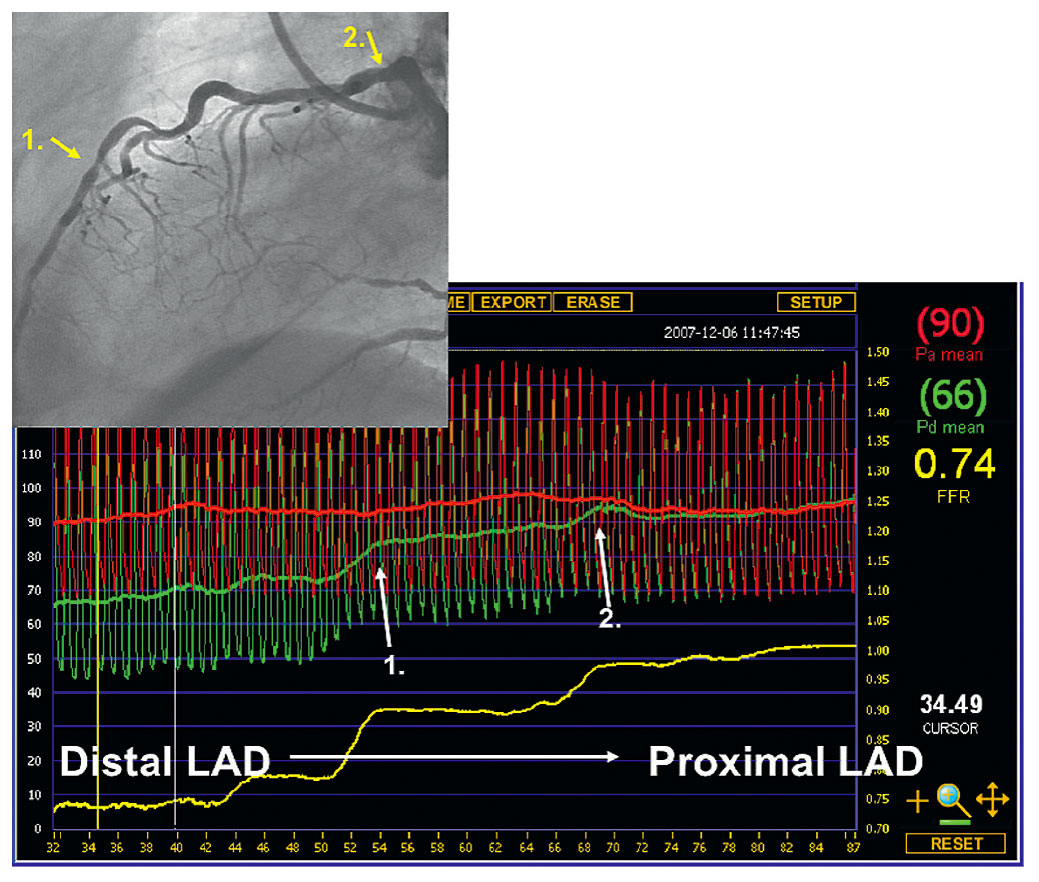
Hyperaemic pressure pull-back recording. Hyperaemic pressure pull-back recording in a diffusely diseased left anterior descending artery (LAD) with superimposed focal lesions. The distal Pd/Pa ratio in the LAD is 0.74 and represents the hemodynamic influence of all lesions taken together. The pressure pull back tracing under steady-state maximal hyperaemia nicely shows the exact origin of the gradient at the different spots (white arrows).
A new index to analyze the pressure of diffuse vs focal disease in a sophisticated way is the pressure pullback gradient (PPG) index which synthesizes in fact all atherosclerotic disease along the coronary artery and facilitates decision-making about severity , .
After a myocardial infarction, previously viable tissue is partially replaced by scar tissue. Therefore, the total mass of viable myocardium supplied by a given stenosis in an infarct-related artery will tend to decrease . By definition, hyperaemic flow and thus hyperaemic gradient will both decrease as well. Assuming that the morphology of the stenosis remains identical, FFR must therefore increase. This does not mean that FFR underestimates lesion severity after myocardial infarction. It simply illustrates the relationship that exists between flow, pressure gradient, and myocardial mass. Conversely, it illustrates that the mere morphology of a stenotic segment does not necessarily reflect its functional importance. This principle is illustrated in Figure 15. Recent data confirm that the hyperaemic myocardial resistance in viable myocardium within the infarcted area remains normal . This further supports the application of the established FFR cut-off value in the setting of partially infarcted territories. In the acute phase of myocardial infarction, FFR is neither reliable nor useful to assess the culprit lesions and in such situation the ECG trumps any other investigation. From 5 days after the infarction, FFR can be used regularly to detect residual ischaemia of the infarct-related artery.
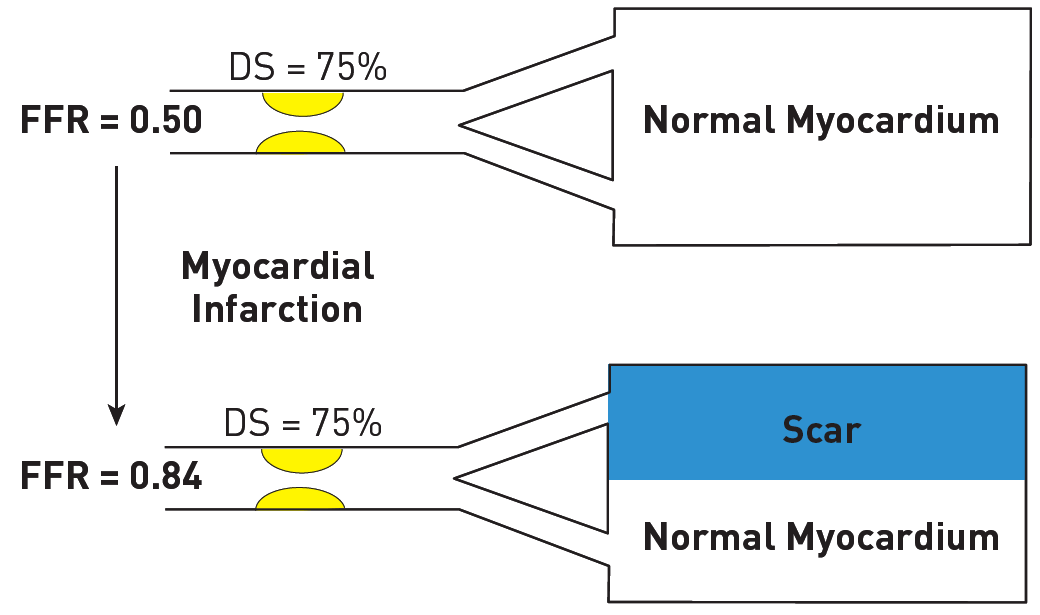
Relationship of FFR to myocardium subtended by an angiographic stenosis. Schematic representation of the relation between FFR and myocardial mass before and after myocardial infarction. Despite similar angiographic disease, the functional significance of the stenosis depends on the amount of viable myocardium. See text for details.
The usefulness of FFR in the setting of acute myocardial infarction, has been further corroborated by two recent large RCT’s, i.e. the Compare-Acute and the DANAMI trial , . In the COMPARE ACUTE trial, after PPCI of the culprit lesion, patients with STEMI were randomised to conservative treatment or to immediate FFR-based revascularisation of the other arteries within the same session. In the DANAMI trial, FFR-based revascularisation was performed within the same hospital admission. Both trials clearly demonstrated the benefit in outcome for the FFR guided approach for revascularisation of the remaining lesions (Figure 16). The ‘bottom line’ of both studies is that – after PPCI of the culprit artery in STEMI- remaining lesions in the non-culprit vessel benefit from FFR guided PCI of these lesions early after the PPCI. Whether early means ‘immediately’ during the same session, or within the same hospital admission, does not really matter and will also depend on logistics and time of presentation (day or night).
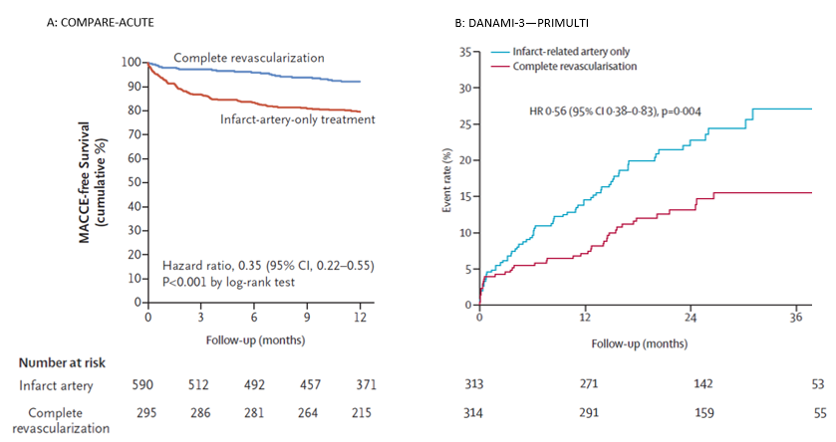
Adapted Kaplan-Meier plot of major adverse cardiac events (MACE) free survival at 12 month follow up in COMPARE-ACUTE and the % event rate in DANAMI-3-PRIMULTI at 36 months follow up. Showing significant more MACE free survival in the complete revascularized patients in COMPARE-ACUTE and significant less events when completely revascularized in DANAMI-3-PRIMULTI.
The favourable data of the DANAMI and COMPARE-ACUTE trial, were not confirmed in the recently published FLOWER-MI study . However, in that study FFR was only measured in 4% of all patients during the index catheterization which might have biased outcome.
Earlier data had suggested that microvascular function would be abnormal in regions remote from a recent myocardial infarction , . However, recent work shows that FFR in non-culprit stenoses, obtained immediately after PCI of the culprit stenosis, is reliable (Figure 17) , . These data support the use of FFR during the acute phase of acute coronary syndromes for the assessment of non-culprit coronary artery stenosis as in the COMPARE ACUTE trial , thereby facilitating decision-making about the need for additional revascularisation.
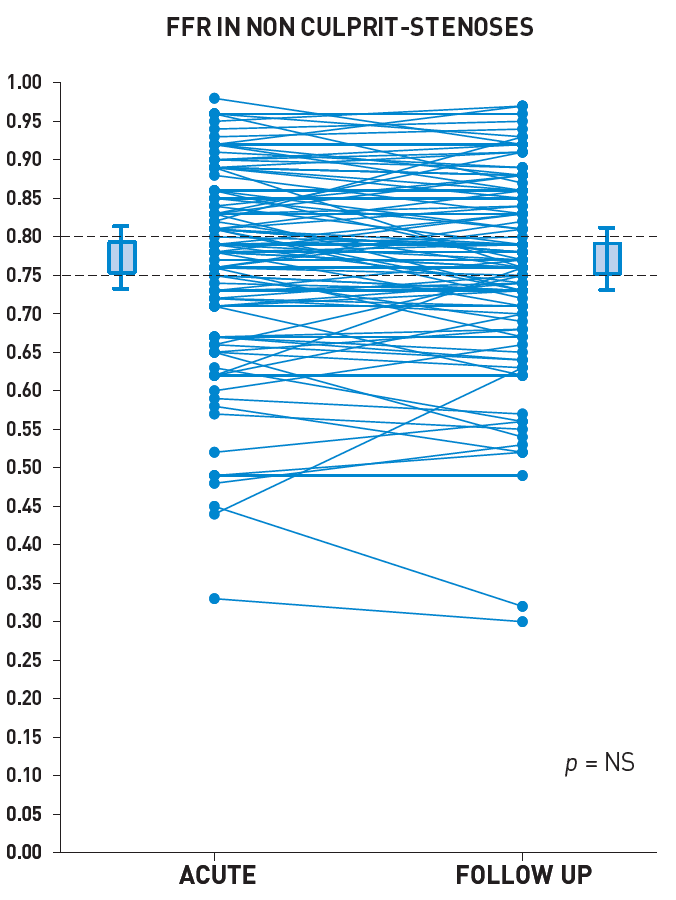
Relation between FFR in acute phase and FFR at follow-up in non-culprit stenosis of patients admitted for (N)STEMI. One hundred one patients undergoing PCI for an acute myocardial infarction (n = 75 with ST-segment elevation myocardial infarction [STEMI], and n = 26 with non-ST-segment elevation myocardial infarction) were prospectively recruited. The FFR measurements in 112 nonculprit stenoses were obtained immediately after PCI of the culprit stenosis and were repeated 35 ± 4 days later. The FFR value of the nonculprit stenoses did not change between the acute and follow-up (0.77 ± 0.13 vs. 0.77 ± 0.13, respectively, p = NS). During the acute phase of acute coronary syndromes, the severity of nonculprit coronary artery stenoses can reliably be assessed by FFR (reference 80).
Recently, the European Society of Cardiology, ACC and AHA published new guidelines on myocardial revascularisation: in general, FFR is indicated for the assessment of the functional consequences of moderate coronary stenoses (50-90% by visual angiographic estimation) when functional information from non-invasive tests is lacking (level of evidence: Class I Level A) . Recently the preference to use (hyperaemic) FFR rather than resting indicies, was specifically acknowledged in the ACC corrections .
In recent years, at least 9 large studies have been performed to examine the best possible treatment of patients with multivessel coronary artery disease, of which 3 in STEMI patients.
In these studies the respective benefit of optimum medical treatment only, percutaneous coronary intervention in addition to medical treatment, and coronary bypass surgery were investigated.
These studies were the COURAGE study, SYNTAX study, FAME study, ORBITA, FAME-2, COMPARE-ACUTE, DANAMI and FLOWER-MI (discussed above) , , , , , , , , . In the COURAGE study, optimum medical treatment only and percutaneous coronary intervention in addition to medical treatment were investigated in patients with multivessel disease and moderately severe coronary disease. In most patients bare metal stents were used. In the SYNTAX 3VD study, only patients with three-vessel disease were included and only drug eluting stents were used. The degree of disease was more severe than in the COURAGE trial, and in these patients standard angiographic- guided PCI with drug eluting stents only was compared to bypass surgery. In the FAME study, also in patients with three-vessel disease for the most part, but excluding left main stenosis, standard angiography-guided PCI with drug eluting stents was compared to FFR-guided multivessel PCI with drug-eluting stents. The SYNTAX 3VD and FAME studies had wider inclusion criteria, including unstable patients and NSTEMI, and decreased LV function, and the FAME study also included patients with previous PCI. Recently, the results of the FAME-3 study were published . In FAME-3, FFR-guided PCI with use of second-generation stents, was compared to aorta coronary bypass surgery (CABG) in patients with extensive 3-vessel coronary disease. The study showed that CABG remained superior in patients with high (Syntax score). In patients with low or intermediate SS, PCI yielded better results than CABG. Of notice and importantly, the FAME-3 study showed that – despite a similar-risk population as in the syntax study- outcome of both PCI and CABG in these patients have been significantly improved in the last decade. For PCI, if performed with FFR-guidance and using second generation stents, all adverse events were reduced by 40% and actual MACCE rate for PCI was similar to the MACCE rate of CABG in the original Syntax study. But – somewhat suprisingly- also outcome of CABG had been improved significantly (Figure 18). The most important results of these four studies are presented in Figure 18 .
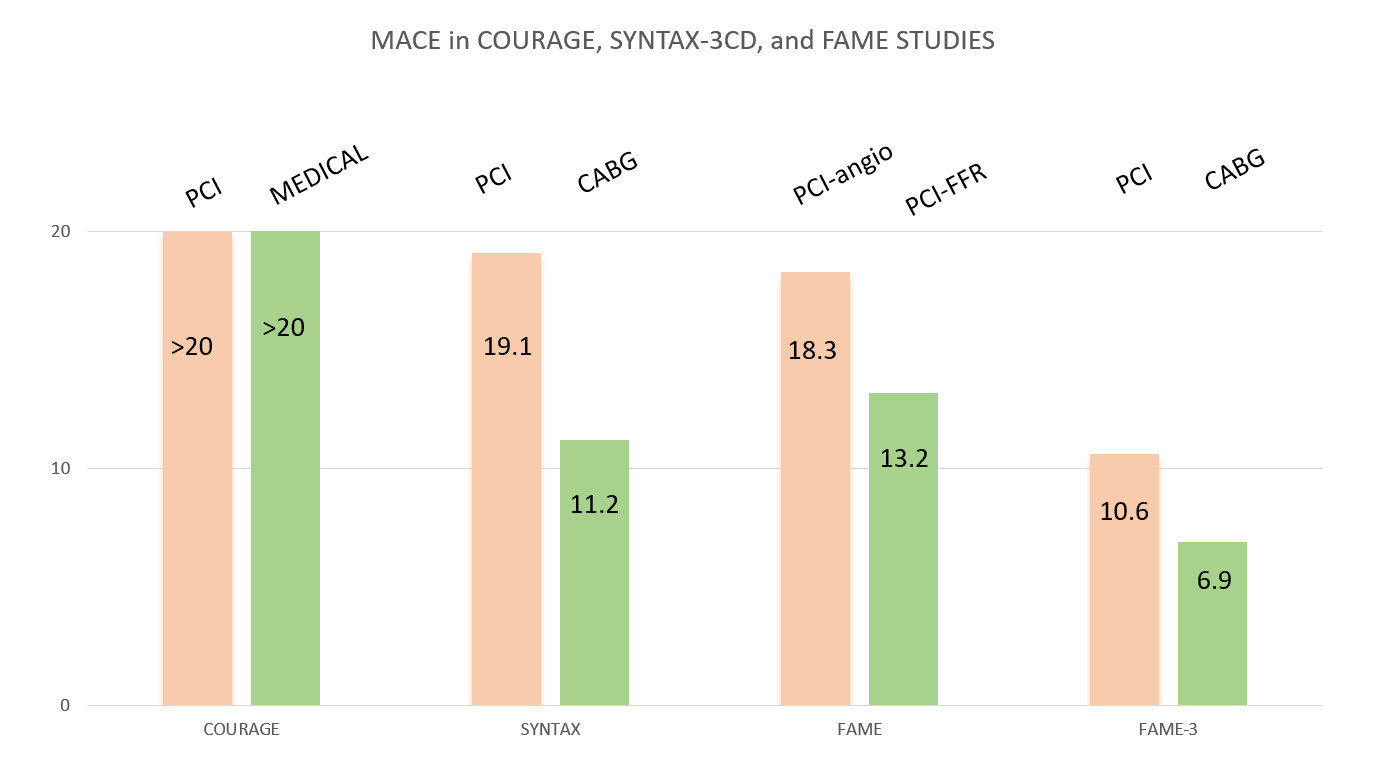
Adverse events reported in fourlandmark randomised trials on different treatment strategies for coronary disease. Major Adverse Event rate (death from all causes, myocardial infarction, and (repeated) revascularisation) in the COURAGE study, SYNTAX-3VD study, and FAME-2 and FAME-3 study. It is clear that in patients with multivessel coronary disease, FFR guided PCI is superior to standard angiography guided PCI. In Addition, considering that the population in Syntax and FAME-3 were comparable, it can be observed that even in complex 3-VD, FFR guided PCI and using second generation of DES (as used in FAME-3) has improved PCI outcome and decreased MACE rate from 18.3% to 13.2% and is equal to CABG outcome in the Syntax study. But also CABG outcome has significantly improved over the last decade and for patients with 3VD and high SS, CABG remains the treatment of choice.Note: the exact MACE rate in the Courage trial at 1 year has not been published, but from published data a MACE rate exceeding 20% can be deduced (reference 7, 31, 80).
Although the baseline characteristics of the studies were slightly different (with the angiographically most complex disease in SYNTAX and FAME-3 and least complex disease in COURAGE), it can be seen that outcome was comparable in all studies for standard angiography-guided PCI, whereas FFR-guided PCI improved outcome significantly. Not only was the total number of MACE significantly reduced by routine measurement of FFR, but also the mortality and occurrence of myocardial infarction. In Figure 18 it can also be observed that multivessel PCI guided by FFR with second generation DES yields results comparable to coronary artery bypass graft surgery in the Syntax study.
FFR-guided PCI versus medical therapy in stable coronary disease
In the ORBITA trial, in patients with stable CAD medical treatment was compared to ‘old fashioned’ angiography-guided PCI, by design denying FFR results when available. Although the initial conclusion was presented as ‘medical treatment found to be non-inferior to PCI’, after 2 years, in the medical treatment group 40% of the patients underwent revascularisation which should be considered a failure of medical treatment . Assuming that PCI in those patients was not without a good clinical reason, it might be clear that without PCI in those patients, mortality and infarction rate would have been largely increased. Therefore, in fact, the ORBITA trial compared ‘direct PCI’ to ‘delayed PCI’.
The FAME 2 trial by De Bruyne et al. was the first large randomized trial comparing FFR-guided PCI versus the best available medical therapy in patients who were eligible for PCI and had angiographically assessed stable CAD. Patients in whom at least one stenosis was functionally significant (i.e., FFR of 0.80 or lower) were randomly assigned to receive either revascularization by FFR-guided PCI plus best available medical therapy or best available medical therapy alone. The primary end point consisted of a composite of death from any cause, non-fatal myocardial infarction, or hospitalization leading to urgent revascularization. The follow-up period is 5 years now and a 10-y follow-up is presently collected . In total, 888 patients were randomized between PCI and medical therapy. The study was halted prematurely because of a significant between-group difference at a mean follow-up of 213 days. There was a significantly lower rate of urgent revascularization in the PCI group as compared to the medical therapy group (1.6% vs. 11.1%; hazard ratio, 0.13; 95% CI 0.06–0.30), resulting in a significant difference in the primary end point (4.3% vs. 12.7%; hazard ratio 0.32; 95% CI 0.19– 0.53). Neither the rate of death from any cause nor the rate of myocardial infarction differed significantly between the PCI group and the medical therapy group. There was a greater reduction in the percentage of patients with angina of CCS grade II–IV in the PCI group than in the medical therapy group. Figure 19 shows a landmark analysis of which the results suggest that the benefit of FFR-guided PCI may become more pronounced with longer follow-up. Indeed, recently a 5 year follow-up was published and showed this long term benefit of PCI .
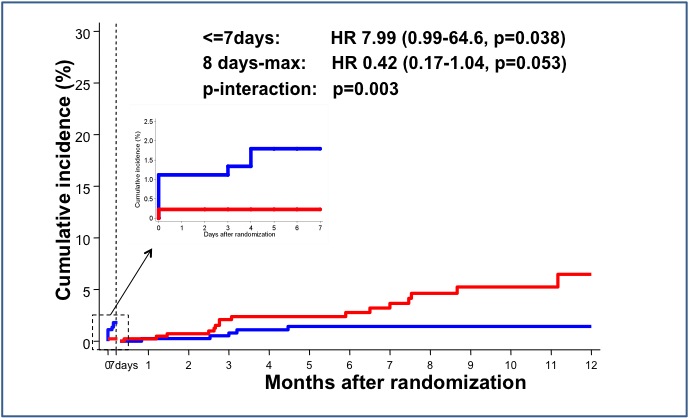
Kaplan-Meier plot of landmark analysis of death or myocardial infarction in FAME 2. Red curve represents the Optimal Medical Therapy alone (OMT) group and blue curve represents FFR-guided PCI group. In the first 7 days after randomization the rate of death or myocardial infarction in the PCI-group due to procedure-related events. Landmark analysis from 8 days after randomization shows diverging curves in favor of the FFR-guided PCI group. These favorable results persisted at 2 and 5 years (reference 54).
Finally, the recent large individual patient data meta-analysis by Zimmermann provided strong evidence that FFR-guided PCI, (i.e. performed for the correct indications) not only improves quality of life effectively, but also decreases the composite hard endpoint of death and MI (Figure 20).
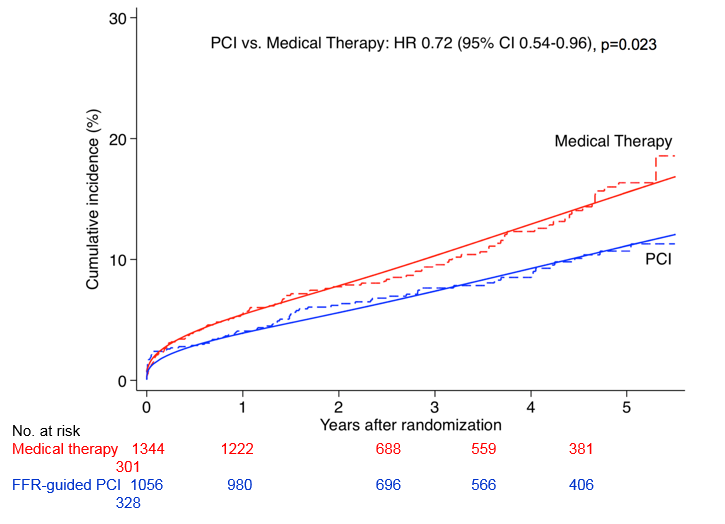
Cumulative incidence curves of primary composite outcome of cardiac death or myocardial infarction from the recent large meta-analysis by Zimmermann (reference 12). As seen in this figure, FFR guided PCI, (i.e. performed for the correct indications) not only effectively improves quality of life, but also decreases combined hard endpoints of death and MI significantly.
There are several pitfalls related to FFR measurement and a few clinical situations where it is not reliable and should not be applied. The most important of these is FFR in the culprit artery in acute ST-elevation myocardial infarction (STEMI). During primary PCI for acute myocardial infarction, the combination of the symptoms, ECG and angiogram makes it generally possible to determine the culprit lesion in the majority of cases. In addition, thrombus embolisation, myocardial stunning, acute ischaemic microvascular dysfunction and other factors make reaching complete microvascular vasodilation unlikely. Therefore, FFR measurement of the culprit lesion makes no sense in the setting of acute STEMI. When a couple of days have passed (mostly 3-5 days is taken as sufficient), FFR can be applied as in routine practice. As discussed in the section FFR and myocardial infarction, FFR can be reliably applied in the acute phase during primary PCI to assess the haemodynamic severity of remote or non-culprit lesions , , , .
From the technical point of view, there are several pitfalls to watch out for when performing FFR measurement. The two most important pitfalls are submaximal hyperaemia (underestimating the stenosis severity) and pitfalls related to the guiding catheter. Such situations can be easily recognised and avoided once the operator has some experience with FFR. Figure 21 illustrates an example of damping of the pressure tracings due to wedging of the guiding catheter into the coronary ostium, which can be easily solved by dislodging the guiding catheter slightly from the ostium. For a more in-depth discussion of pitfalls, we refer to several excellent overviews in the literature , , . An illustrative case showing false-negative nuclear scan results revealed by FFR measurements is shown in the online data supplement.
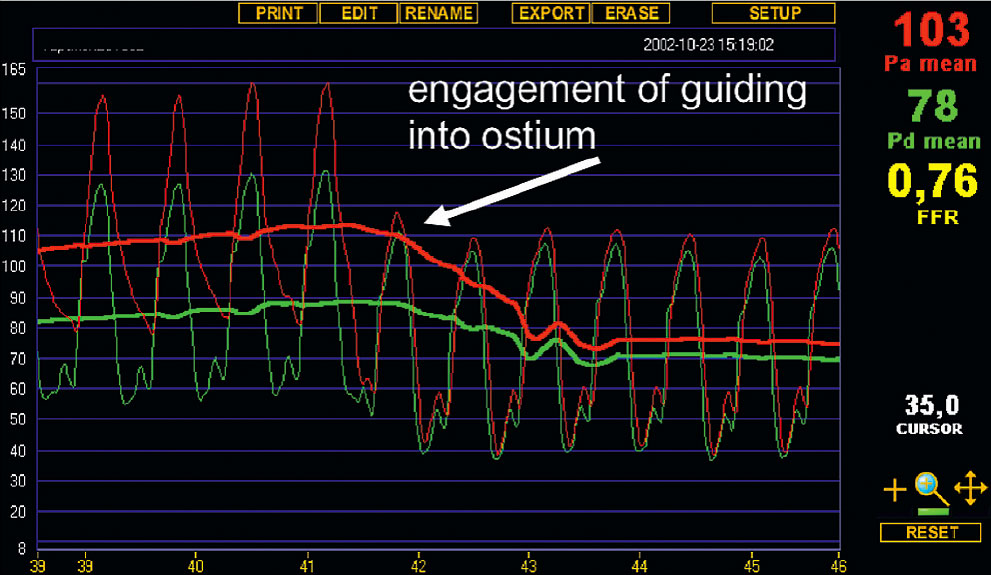
Example of artefactual change in FFR. Illustration of the effect on pressure tracings of engagement of the guiding catheter into the coronary ostium. Both Pd (distal pressure as measured by the pressure sensor) and Pa (proximal pressure as measured by the guiding catheter) become lower when the guiding catheter “blocks” the ostium of the coronary artery. Particularly Pa lowers and the shape of its curve becomes identical to the Pd curve, which makes such a “pitfall” situation easily recognizable in clinical practice. By simply dislodging the guiding catheter slightly from the ostium this potential ‘pitfall’ can be avoided
Finally, there are a number of physiological reasons why FFR can be (correctly) high despite an apparently tight stenosis. This is further explained in Table 2 .
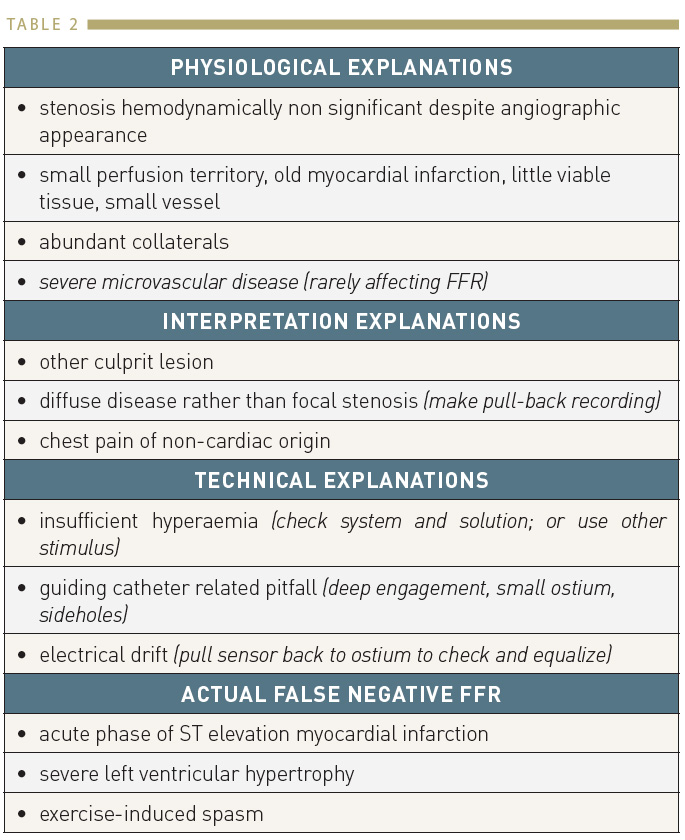
Reasons of non-ischaemic FFR despite an apparently tight stenosis
Several studies have shown that assessment of coronary stenoses and guidance of revascularisation by FFR has a favourable economic outcome as compared to coronary angiography , , , , . Recently, an economic analysis of the FAME study has been performed . The principal finding of this analysis was that performing PCI guided by FFR in patients with multivessel coronary artery disease saves healthcare resources and improves health outcomes at 1 year compared with a traditional strategy of angiographic-guided PCI (Figure 22). It is unusual in modern medicine to find a technology or treatment strategy which not only improves the intended health benefit, reduces risk and unintended side effects, but also saves costs. An unique finding from this economic analysis was the fact that not only was an FFR-guided strategy to PCI in multivessel coronary artery disease cost-saving, but it achieved these results within just one year, a remarkably short period of time. In the FAME study, the cost savings occurred both at the index procedure, primarily owing to a decrease in drug-eluting stent use being a major cost driver, which more than offset the increased cost of the pressure wire and adenosine, and during follow-up as a result of a decrease in rehospitalisation and fewer major adverse cardiac events.
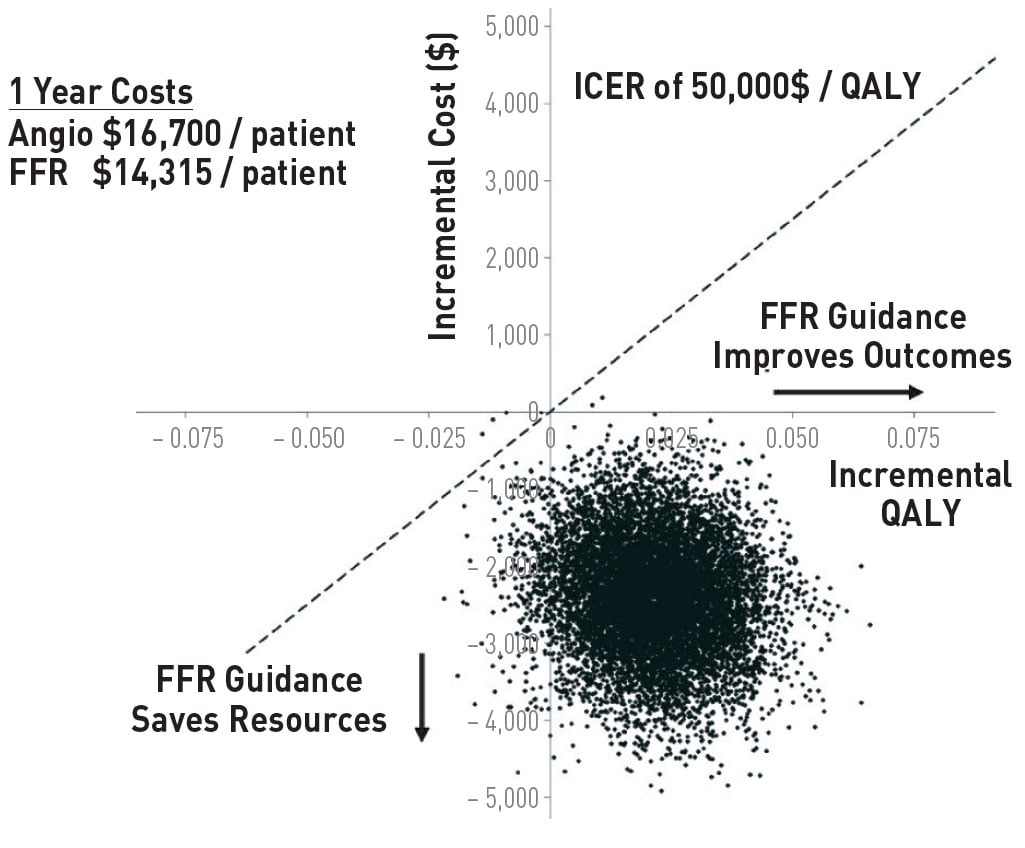
Cost-effectiveness of an FFR guided approach to PCI. Bootstrap simulation of incremental costs and effects. Numbers on axes represent differences between FFR-guided and angiography guided strategies. Positive incremental quality adjusted life-years (QALYs) indicate higher effectiveness for FFR-guided treatment. Negative incremental costs indicate lower costs for FFR-guided treatment compared with angiography-guided strategy. Bootstrap simulation indicated that the FFR-guided strategy was cost-saving in 90.74% and cost-effective at a threshold of US $50 000 per quality-adjusted life years in 99.96%. Data are from 5000 bootstrap Replications (reference 53)
RESTING INDICES: Pd/Pa AT REST, INSTANTANEOUS WAVE-FREE RATIO (iwFR), DIASTOLIC PRESSURE RATIO (dPR), RESTING FULL CYCLE RATIO (RFR) AND OTHER NON-HYPEREMIC PRESSURE RATIOS (NHPR)
Currently, there has been growing interest in resting indices, either derived from combined pressure-velocity measurements (bSVR) or from resting pressure gradients alone (e.g. Pd/Pa at rest, iFR, dPR or RFR). On one hand, it seems attractive to skip hyperaemia because of simplicity, on the other hand, part of the physiological information is lost. , , ,
The renewed interest in resting physiology was set in motion by the introduction of the pressure based Instantaneous Wave-Free Ratio (iwFR) as a vasodilator-independent index of coronary stenosis severity (85). This index is based on the assumption that myocardial resistance during a diastolic wave-free period (WFP) is equivalent to the average resistance during maximal hyperemia. However, it has been shown that such WFP does not exist and that iwFR is strongly dependent on the degree of hyperaemia . More importantly, it has been shown that ‘detecting the WFP’ is not a prerequisite to obtain the same physiological information. Newer and more simple diastolic pressure ratios (like diastolic pressure ratio (dPR), defined as Pd/Pa over the complete diastole or resting full cycle (RFR), defined as the lowest Pd/Pa in the whole cycle) are numerically identical to iwFR and can be used for identical purposes , .
So, all these indices or non-hyperaemic pressure ratios (NHPR) are numerically identical, have an accuracy of about 80% compared to FFR, and share the limitations and pitfalls summarised in Focus Box 3 . No independent outcome studies are available for any of these indices and although in the European guidelines, they are mentioned as an alternative to (hyperaemic) FFR, in the American guidelines they have recently been downgraded . Further extensive discussion, of these resting indices is presented in the next chapter: Invasive physiological assessment of coronary disease: non-hyperaemic indices (iFR). For further, in depth overview of all the characteristics of these indices we also refer to a recent paper by van‘t Veer et al .
Before guidewire-based coronary pressure measurements were possible, Doppler wires were available to measure coronary flow velocity and classic coronary flow reserve . Because of the intrinsic shortcomings of coronary flow reserve, such as dependence on baseline flow (almost never present in the cathlab), absence of a normal value, dependence on blood pressure and heart rate, age dependency, and non- specificity with respect to the epicardial coronary artery, its use for practical decision-making has faded. Doppler measurements in combination with pressure measurements have been used to define combined indexes which can be useful especially for microvascular dysfunction . However, those applications are more sophisticated, time consuming and operator dependent and have been replaced in most centers by the newer and easier technique of absolute flow and resistance measurement by continuous thermodilution as discussed below.
The sensor on the PressureWire™ (St. Jude Medical, St. Paul, MN, USA) can also be used as a thermistor, and coronary thermodilution measurements have been performed , . In that way, thermodilution-based coronary flow reserve could be calculated and was applied in several studies. However, the shortcomings of thermodilution CFR are similar to those of Doppler CFR and other methodologies for coronary flow reserve measurement. The advantage of thermodilution CFR is that it can be combined more easily with pressure measurement because only a single sensor is necessary. Comparative studies in animals showed somewhat better results for thermo-CFR measurements than for Doppler- CFR, when compared to electromagnetic flow measurement as the gold standard . Unstable resting signals, caused by fluctuation of resting flow due to the saline injections, remain a problem.
Of greater clinical importance is the index of microvascular resistance (IMR), introduced by Fearon et al . It is also derived from coronary pressure and hyperaemic temperature measurement (Figure 23). Because it uses only mean transit time during maximum hyperaemia, it is not dependent on baseline blood flow as is the case for coronary flow reserve. Because hyperaemic blood flow is inversely proportional to hyperaemic mean transit time, the product of distal pressure and mean transit time can be used as an index of minimal microvascular resistance. It has been shown that this index corresponds well with the degree of microvascular disease in patients after transplant and after myocardial infarction. In contrast to CFR, IMR has been shown to be independent of varying haemodynamic conditions. Moreover, IMR was shown to be very specific for microvascular (dys)function, especially in patients with normal epicardial coronary arteries , . In situations where microvascular disease plays a predominant role, IMR can be a useful tool in addition to fractional flow reserve. It addresses the microcirculation specifically, whereas FFR addresses the epicardial conduit.
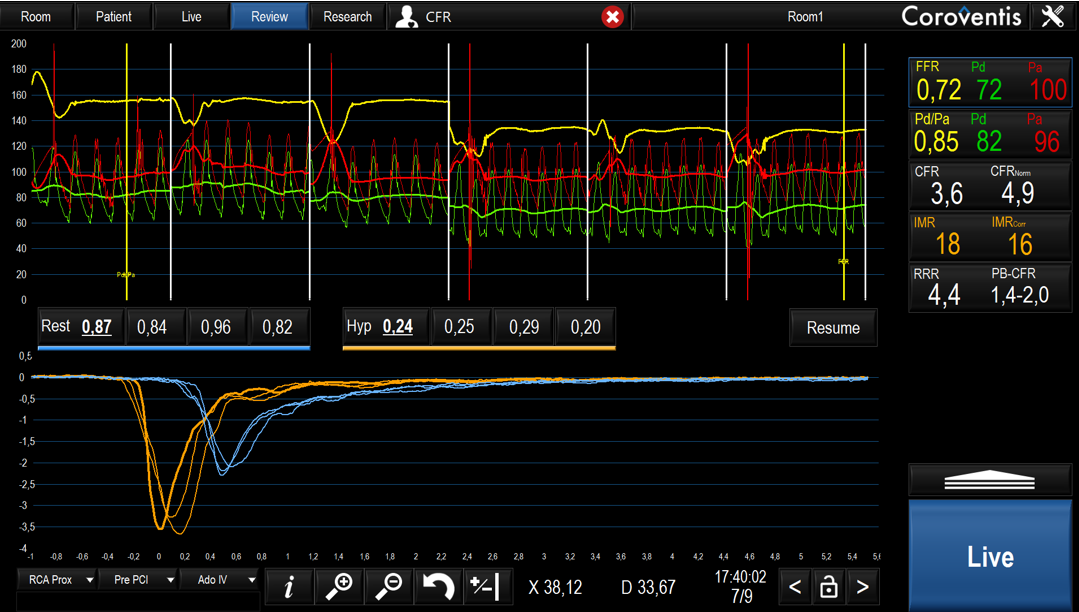
Screenshot with an example of an IMR/CFR measurement. The green and red line represent the Pd and Pa respectively. The blue and orange curves at the bottom panel represent the temperature changes following a bolus injection of 3ml saline during rest and hyperemia respectively. After inducing hyperemia the mean transit time (Tm) is obtained. The indexes are directly calculated by the Coroventis software program. The CFR is determined by dividing the mean resting blood flow (blue lines, Tm,rest) and mean hyperaemic blood flow (orange lines, Tm,hyp). The IMR is calculated by multiplying the Pd with the mean hyperaemic blood flow (Tm,hyp).
More recently, measurement of absolute blood flow has been described using a technique of thermodilution with continuous low rate infusion of saline , . The application of this established method is very easy, reproducible and without noticeable side effects .
Measurements can be performed at rest with a saline infusion rate of 10ml/min or at maximum vasodilution with a saline rate of 20ml/min. In the latter case, maximum hyperemia is induced by saline without any side-effect For saline infusion, a specific monorail infusion cathether (Rayflow®, Hexacath, Paris) is mandatory and validated extensively , , . This Rayflow ® catheter has 4 sideholes, guaranteeing immediate and complete mixing of blood and saline, and 2 inner proximal sideholes to record the temperature of the saline when it enters the coronary artery.The method is based on the calculation of flow (Q in ml/min) and microvascular resistance (R in dyn.s.cm−5, mm Hg/L/min, or Wood units) and can be easily understood looking from Figure 24. The distal coronary temperature is measured using a normal pressure wire X. After reaching steady state hyperaemia (mostly within 20 seconds) and measuring distal coronary temperature (T), the pressure wire is pulled back into the Rayflow ® catheter to determine the infusion temperature of the saline (Ti). Absolute blood flow is then calculated by dividing the infusion temperature by the distal temperature and multiplying it by the infusion rate of the pump, following the equation below.
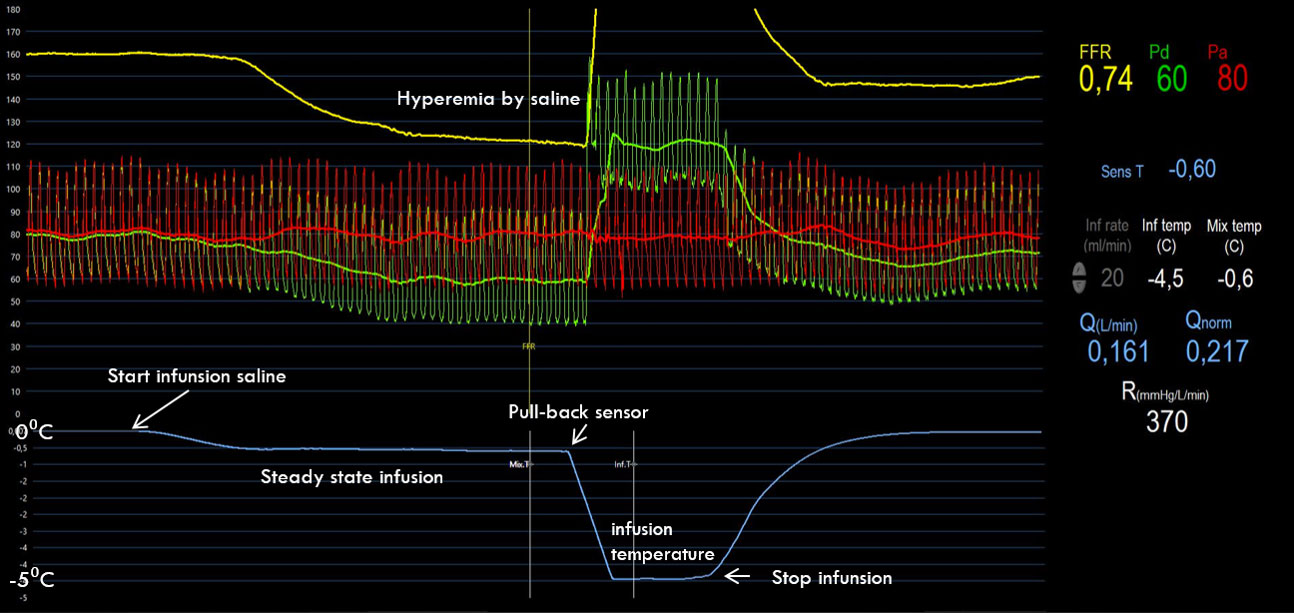
Screenshot with an example of an absolute flow measurement during saline-induced hyperemia. The green and red line represent the Pd and Pa respectively. The steady state of hyperemia is caused by the infusion of saline through the Rayflow®. The blue line represents the distal infusion temperature. After this reaches steady state, the pressure wire is pulled back in the Rayflow® creating a fast decrease of the temperature curve and possibility to registrate the infusion temperature. Afterwards the infusion pump is stopped and all values in the right panel are calculated directly by the Coroventis® software. Similar recordings can be made at rest with a saline infusion rate of 10 ml/min. From the resting and hyperemic measurement, also alsolute CFR and microvascular resistance reserve (MRR) can be calculated by the software.
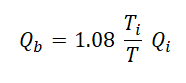
(Qb is the flow in ml/min. The constant 1.08 relates to the difference between the specific heats and densities of blood and saline. Ti is the infusion temperature of the saline at the infusion holes of the Rayflow catheter. T is the distal coronary temperature measured by the pressure wire. Qi is the infusion rate of the pump in ml/min).
Simplified this means that when the distal temperature (T) is 1○C below body temperature and the infusion temperature (Ti) is 5○C below body temperature, the absolute blood flow is 5 times the set rate of saline infusion. So in this example, with a saline infusion rate of 20ml/min blood flow will be 100ml/min. Microvascular resistance is calculated in analogy to Ohm’s law by dividing the distal pressure and flow.
All calculations for resting and hyperemic absolute flow and resistance, explained above, are automatically made by the Coroventis® software program (Coroventis, Upsala, Sweden) (Figure 24).
The technique in itself is sound and well validated and is a reliable tool to assess the microvasculature truly quantitatively. Potential applications encompass assessment of microvascular dysfunction in case of normal epicardial vessels or recovery of microvascular resistance after (acute) PCI, but numerous applications are thinkable.
Flow measured by this new technology was compared to PET-derived flow measurements in a series of 25 patients and an excellent agreement was found .
In addition, no difference was found between the absolute flow by the present technology with saline infusion as calculated with or without adenosine, showing that indeed full hyperaemia was induced by 20 ml/min of saline.
In the last 4 years, more than 25 studies have been performed to validate several aspects of absolute flow and resistance measurement. It has been shown that in a normal anterior wall, minimal resistance should be < 480 WU , . For the RCA and Cx territory, normal values are less obvious because Rµ in itself is mass dependent , . The technique of absolute flow and resistance measurements, also allows true absolute CFR measurement in an operator-independent way and is used today in more than 80 European heart centers.
In addition, the rapidly evolving knowledge about the coronary microcirculation by using these measurements, has lead to the definition of Microvascular Resistance Reserve (MRR) which is defined as the ratio of true microvascular resistance at rest (Rµ,rest) as it would be in case of a completely normal epicardial artery, divided by minimal microvascular resistance (Rµ,hyp) . In contrast to all other measurements for microvascular disease which are confounded by the presence of (hidden or overt, focal or diffuse) epicardial disease, MRR is not. The concept of MRR also involves true resting and actual resting resistance. MRR can be calculated as:
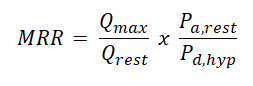
Which can also be written as :
(1a) 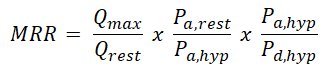
This equation becomes intiutively clear because the first term is classical CFR, the second term corrects for hemodynamic variations and the third term corrects for presence of epicardial disease (1/FFR). In this way the 3 major indices of coronary physiology can be linked to each other by rewriting (1a) as:
(1b) 
In the supplemental material, a short Video can be viewed demonstrating such elegant procedure of resting and hyperemic measurement of absolute flow, microvascular resistance and MRR.
The video perfectly explains step-by-step how to assess the coronary microcirculation using the method of absolute blood flow and microvascular resistance by continuous thermodilution. In addition this video explains the concept and technique to assess MRR (microvascular resistance reserve).
FFRCT technology is based on physiologic models of coronary blood flow, combining anatomical and functional information of the coronary arteries in a non-invasive manner. A dedicated algorithm using cardiovascular computational flow dynamics was created (HeartFlow Process; HeartFlow Inc., Redwood City, CA, USA) for non-invasive FFR derivation. The FFR
CT is defined as the computed mean coronary pressure distal to a lesion divided by the computed mean blood pressure in the aorta under conditions of simulated maximum hyperaemia (Figure 25). The diagnostic performance of FFRCT compared to invasive FFR used as a reference standard has recently been reported in 159 vessels (103 patients) : an FFR CT ≤0.80 was considered diagnostic of lesion-specific ischaemia. Measurements for FFR CT and FFR correlated well (coefficient =0.72, p<0.001); however, FFR CT slightly underestimated invasive FFR (mean difference 0.02±0.12, p=0.02). Accuracy, positive predictive value and negative predictive value of the FFR CT compared to invasive FFR were 84%, 74% and 92%, respectively.
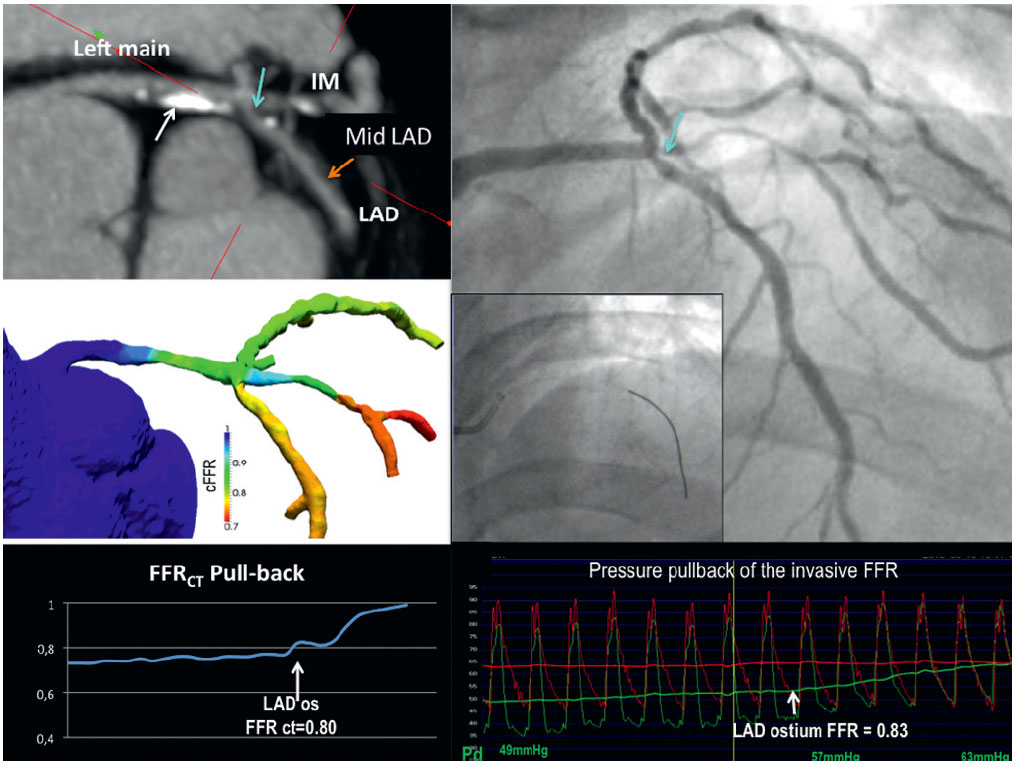
An example of non-invasive fractional flow reserve (FFR) based on multi-slice computed tomography (MSCT) and invasive FFR. Multi-planar reconstruction of MSCT (panel A) showed sequential lesions from the left main trunk (LM) to the left anterior descending artery (LAD): i) mild stenosis with a calcified plaque in LM (white arrow), ii) intermediate stenosis at the ostium of left circumflex immediately after trifurcation (light blue arrow), and iii) mild stenosis in the mid LAD (orange arrow). Non-invasive FFR based on the static MSCT images (FFRCT) in the left coronary arteries was color-coded and shown in panel B. The virtual pullback of noninvasive FFR from the distal LAD to the LM demonstrated a FFRCT of 0.80 at the ostium of LAD (panel C). Invasive angiography (panel D) showed an intermediate stenosis at the ostium of LAD (light blue arrow) and invasive FFR was performed (panel E). The pressure pullback of the invasive FFR showed an FFR of 0.83 at the ostium of LAD (panel F).
In the platform study , 584 patients presenting at the first-aid department with chest pain suspected for angina or ACS, were randomized to undergo immediate invasive angiography or at first a CT-scan with FFRct measurement, only followed by invasive angiography in case of abnormal FFRct. In that way, incidence of invasive angiography was reduced by 60%. But importantly, in both groups, the absolute number of patients in whom significant CAD was found and who qualified for revascularization, was exactly identical. Because all baseline characteristics in both groups were also identical, this means that in the FFRct strategy group, only very few patients with significant CAD can be missed .
Compared to the other available non-invasive modalities for the assessment of coronary artery disease, MSCT plus FFR CT is unique in combining anatomical and physiological information and might ultimately provide us with comprehensive non-invasive evaluation of the coronary arteries. It is likely that in the near future, CT coronary angiography with non-invasive FFR assessment will become the standard for non-invasive diagnosis of the anatomy and physiology of CAD and may become the ‘gate-keeper’ at emergency departments for patients presenting with chest pain , .
Since non-invasive stress testing and coronary angiography will not always provide adequate and complete information about the functional importance of coronary artery stenoses, invasive physiological lesion assessment by fractional flow reserve is an essential diagnostic tool in catheterisation laboratories. FFR is theoretically a robust and practically a simple means of assessing whether a particular coronary artery stenosis is related to myocardial ischaemia. Its invasive nature is counterbalanced by some unique and advantageous features, such as its unequalled spatial resolution, offering functional information down to the “per millimeter” level, while non-invasive tests operate, at best, at the “per vascular territory” level. Moreover, FFR has an unequivocal normal value, takes into account collateral blood flow and amount of viable myocardial mass, is independent of haemodynamic variations, and has a high reproducibility. Unlike for any other physiological index, for FFR there is a large body of very strong and consistent evidence that clinical outcomes are improved, including a decrease in the composite of death and myocardial infarction, when decisions for revascularisation are FFR-guided. Thus, based on the available clinical evidence and the current international guidelines on revascularisation, FFR is indicated in all coronary artery stenoses of 50-90%, including left main stenosis, side branch stenosis and serial stenoses, when functional information from non-invasive tests is lacking. Moreover, in patients with multivessel coronary artery disease, PCI guided by FFR results in an improved outcome irrespective of available non-invasive functional test results. FFR is linearly related to maximum blood flow, less vulnerable to pressure drift compared to other indices, and in addition to its diagnostic value it can also be used to assess PCI results. Consequently, FFR is an indispensable tool for contemporary, state of the art coronary intervention. In addition, from coronary pressure and temperature measurements using similar technology, important information about the coronary microcirculation can be assessed within the same procedure (IMR, absolute flow and microvascular resistance, and microvascular resistance reserve (MRR)).
Fractional flow reserve is an essential diagnostic tool in every modern catheterisation laboratory. This is not only because of the superiority of FFR over non-invasive stress testing and coronary angiography in depicting a particular lesion’s physiological importance, but also due to its many practical and advantageous features. ‘On the spot’ clinical decision making about coronary revascularization with FFR measurements is unique and has been validated in patients with all kinds of lesion subsets. Moreover, PCI guided by FFR is associated with improved clinical outcome as well as more favorable heath economic data. Interventional cardiologists using non-hyperemic indices instead of FFR, should be aware of the significantly lower diagnostic accuracy and fundamentally less supporting outcome data for non-hyperemic indices. Indications for FFR have been incorporated into the ESC and AHA/ACC guidelines on coronary revascularization. The results of the FAME 1 and 2 study, both showing an important reduction in cardiac events for FFR-guided PCI, compared to respectively angiography-guided PCI and optimal medical therapy, have fundamentally changed the perspective with respect to the optimum diagnosis and treatment of coronary artery disease.
Evangelos Giannitsis, Christian W. Hamm, Holger M. Nef, Hugo A. Katus
Updated on May 14, 2022
Javier Escaned, Daniel Faria, Asad Shabbir, Lin Wang, Shengxian Tu, Nieves Gonzalo, Hernan Mejia-Renteria, Xu Bo
Updated on May 14, 2022
Alejandro Travieso, Breda Hennessey, Asad Shabbir, Adrian Jerónimo, Nieves Gonzalo, Javier Escaned
Updated on May 11, 2023