Emmanouil S. Brilakis, Lorenzo Azzalini, Dimitrios Karmpaliotis, William Nicholson, Stephane Rinfret
Chronic total occlusion
Updated on May 13, 2021
Chronic total occlusion intervention (CTO PCI) has been maturing with the advent of dedicated equipment. Simultaneously coronary Imaging modalities have evolved rapidly over the decades, application of the technologies are more demanding, as the current daily practice in CTO PCI becomes more complicated. Non-invasive imaging is central to the evaluation of ischaemia and myocardial viability which are pre-requisites for the selection of appropriate patients for CTO-PCI. In addition, computed tomographic coronary angiography can evaluate anatomical features not apparent on conventional invasive angiography as well as predict the complexity and likely success of guidewire passage during PCI. During CTO PCI intravascular ultrasound has been used increasingly to improve the quality of intervention particularly in the presence of complex anatomy.
Single Photon Emission Computed Tomography (SPECT) is used for assessing the extent of ischemia and the presence of viability of the CTO region . Localization of ischemia/viability is a strong point of SPECT, while Exercise Tolerance Test(ETT) remains widely adopted screening test for detecting ischemia if the subject can exercise adequately without baseline LBBB pattern.
Positron Emission Tomography (PET) is a gold standard of detecting myocardial viability, using fluorodeoxyglucose. Because of high inventory cost and similar diagnostic accuracy to SPECT, the use of SPECT is not widely adopted on daily practice .
CMRI is, currently, a test of choice to assess the viability of the myocardium in interest, identifying the area and functionality. Late myocardial enhancement of wall thickness < 25% is a marker of viability, while > 50% is more suggestive of non-viability . Gray zone does exist, however, regarding the late enhancement between 25-75% of wall thickness. Low dose dobutamine stress will enhance viability detection and refine indication of revascularization on the question .
Optical Coherence Tomography (OCT) system is emerging for visualizing the endoluminal surface of the vessel, stent (mal)apposition, thrombus formation, and ruptured plaque among others , its application for CTO-PCI is somewhat limited since the current system requires pressurized contrast or saline injection to visualize a target segment.
The IntraVascular UltraSound (IVUS) has played a major role in imagining the “ inner side” of the target vessel, ranging from the vessel diameter, amount of plaque distribution, the severity of calcification, the degree of remodeling, the degree of dissection, hematoma formation, and subintimal wire passage during PCI. Currently, there are two kinds of IVUS systems: a mechanical scan type with a lower profile catheter (Atlantis and Opti cross, Boston, USA , Naviocus, Altaview Terumo, Japan, Revolution, Volcano, Philips) and a solid-state phased array scan (Eagle eye, Volcano, Philips, Holland) (Figure 1) . While mechanical Opticross can provide high detailed axial resolution image (35-50 micro), solid state of Eagle Eye provides images of 60-170 micron. IVUS in daily practice is limited worldwide due to its reimbursement issue, a Solid-state IVUS (an Eagle Eye, Volcano, Philips) with a short tip is, nonetheless, preferred for imaging during CTO-PCI, as it minimizes the extent of dissection inside of CTO. When IVUS is used for locating a proximal cap with a large side branch, IVUS pull back from a wired branch is applicable for both systems.
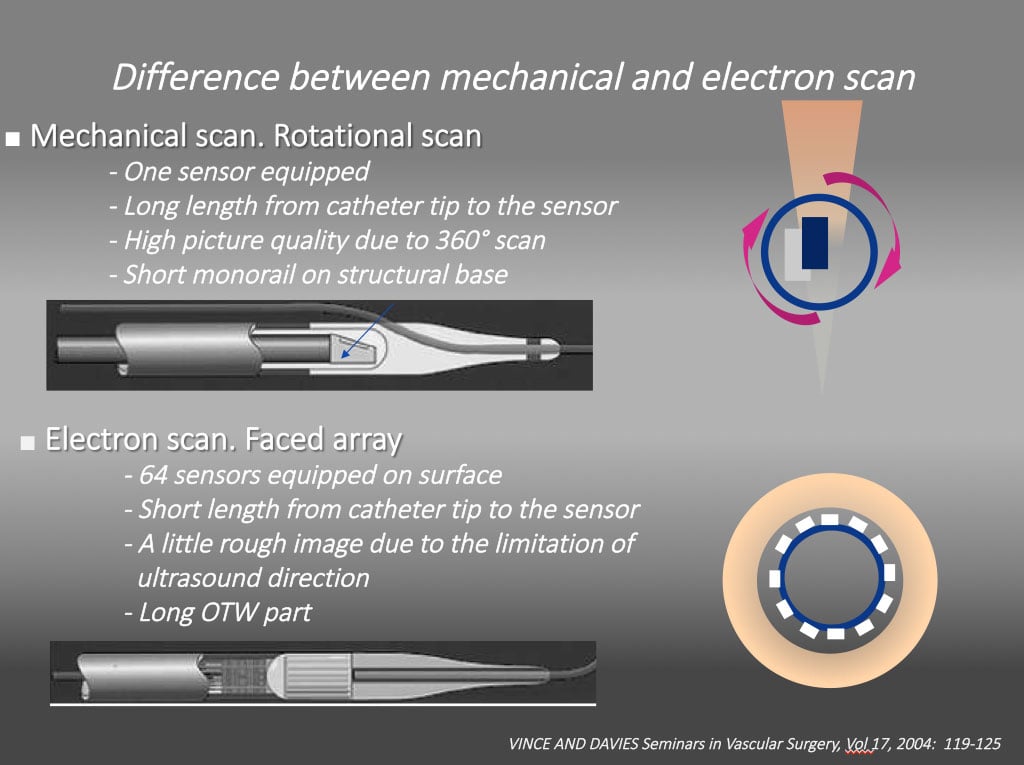
Different intravascular ultrasound systems A mechanical scan with a lower profile catheter (Atlantis and Opti cross, Boston, USA , Naviocus, Altaview Terumo, Japan, Revolution, Volcano, Philips) and a solid-state phased array scan (Eagle eye, Volcano, Philips). While mechanical Opti cross can provide high detailed axial resolution image (35-50 micro), solid state of Eagle Eye provides images of 60-170 micron.
It is highly recommended that one goes through the dedicated references to obtain the basic IVUS principles and interpretation of the images in the context of clinical scenarios, which are beyond the scope of the chapter . Representative IVUS definition and findings on CTO PCI are shown in Figure 2, Figure 3, Figure 4 , .
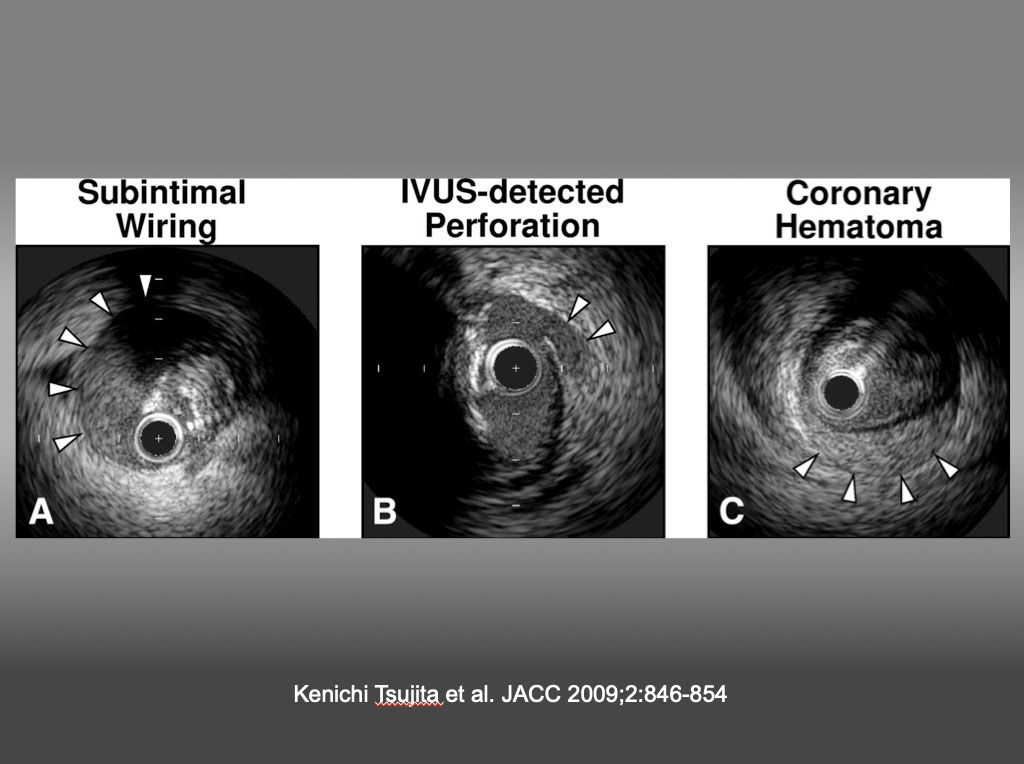
Representative IVUS Images (A) Subintimal wiring was defined as the intravascular ultrasound (IVUS) catheter located in the subintimal space (arrowheads, absence of arterial wall 3 layers) (note the collapsed true lumen at 2 o’clock). (B) The IVUS-detected coronary perforation was defined as blood speckle outside the vessel (arrowheads) and/or tear of the adventitia despite a lack of angiographic extravasation. (C) Coronary hematoma was defined as an accumulation of blood (arrowheads) recognized typically as a crescent-shaped homogeneous hyperechoic structure with straightening of the internal elastic membrane. Kenichi Tsujita et al. JACC 2009;2:846-854
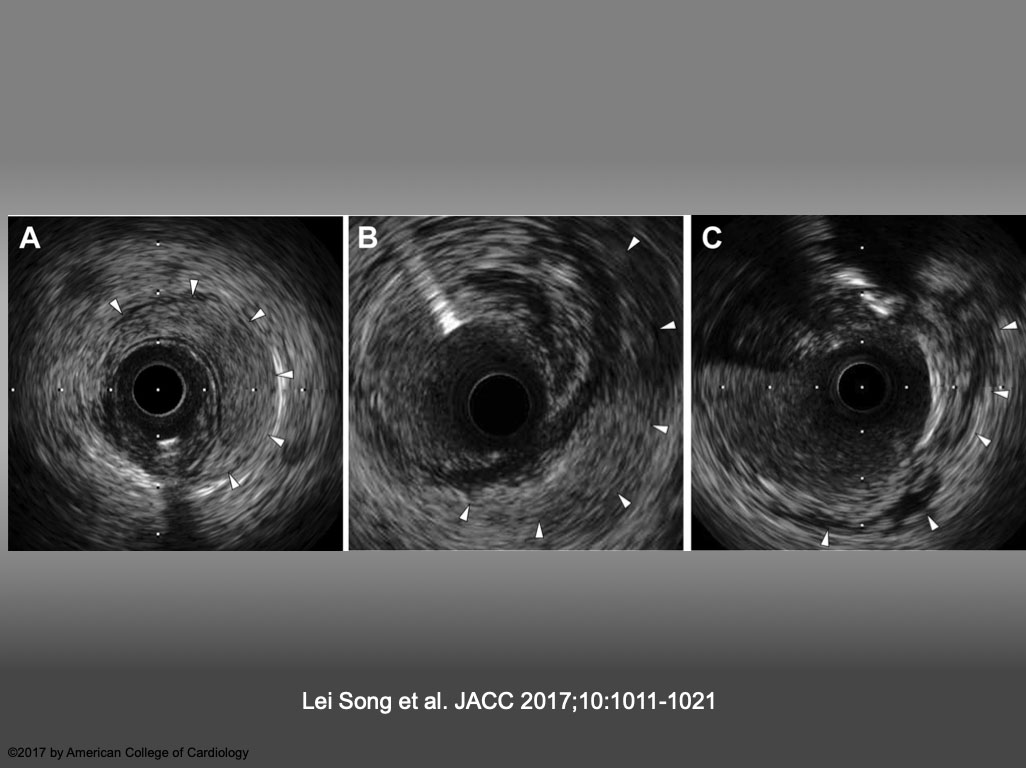
Representative Images of IVUS-VI (A) Intramedial hematoma, defined as an accumulation of blood (arrowheads) that appear as a crescent-shaped homogeneous hyperechoic structure within the medial space. (B) Perivascular hematoma, defined as an accumulation of blood (arrowheads) that appear as a crescent-shaped homogeneous hyperechoic structure outside the vessel wall, visually continuous with the adventitia or peri-adventitial structures. (C) Perivascular blood speckle, defined as free blood speckle (arrowheads) and new echolucent structures outside the vessel wall, with or without communication with the lumen. IVUS = intravascular ultrasound; VI = vascular injury. Lei Song et al. JACC 2017;10:1011-1021
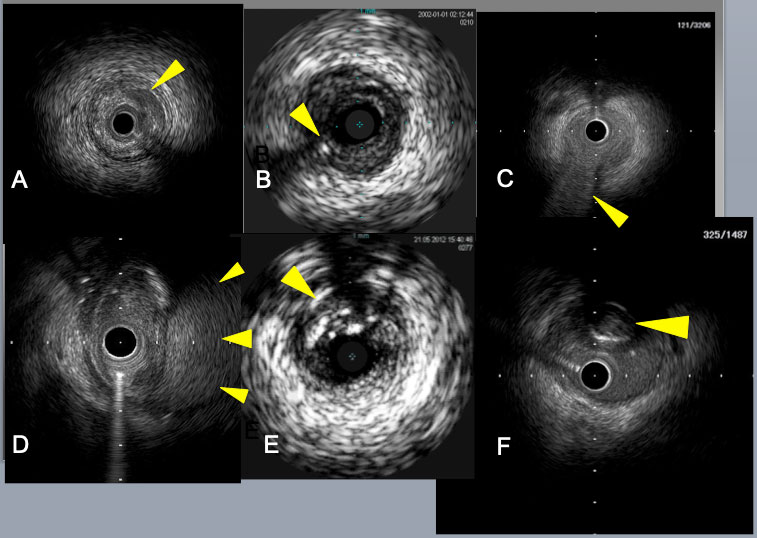
Subintimal catheter position is indicated by the absence of 3 layers of arterial wall and the presence of the collapsed true lumen in E, F. Crescent shaped mild dissection (an arrow) in A, a retrograde guide wire in intimal plaque (an arrow) in B, a septal branch bifurcation (an arrow) in C, a big subintimal hematoma (arrows) in D.
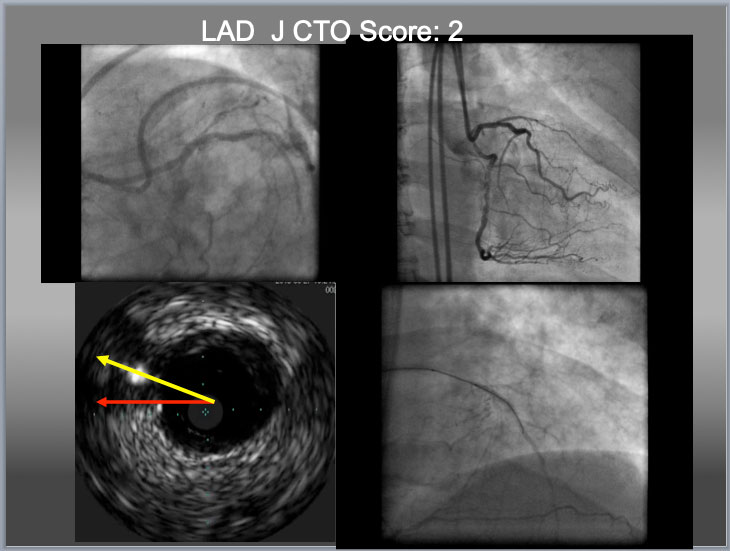
Eagle Eye IVUS (Volcano, Philips, Netherland) for LAD CTO ostium identification, Gaia 2 (additional large 2 curve) for puncture and Gaia 1 (from package) for crossing. When there is no availability of deflectable tip microcatheter (such as a Venture Catheter or a Supercross), a penetration wire has to cover the distance (which requires additional curve, to cover a distance in a yellow line, bottom left), to obtain an optimal EA as indicated before. When a wire puncture gets near or at center of the proximal cap, it is high chance that IVUS shows a wire close to or on the line between a center of the main vessel to that of cap (yellow arrow). However, the line indicated an red arrow does not necessarily exclude a chance of intraplaque puncture. In this particular case, successful puncture of the proximal cap by IVUS resulted in true to true lumen crossing in the lower right.
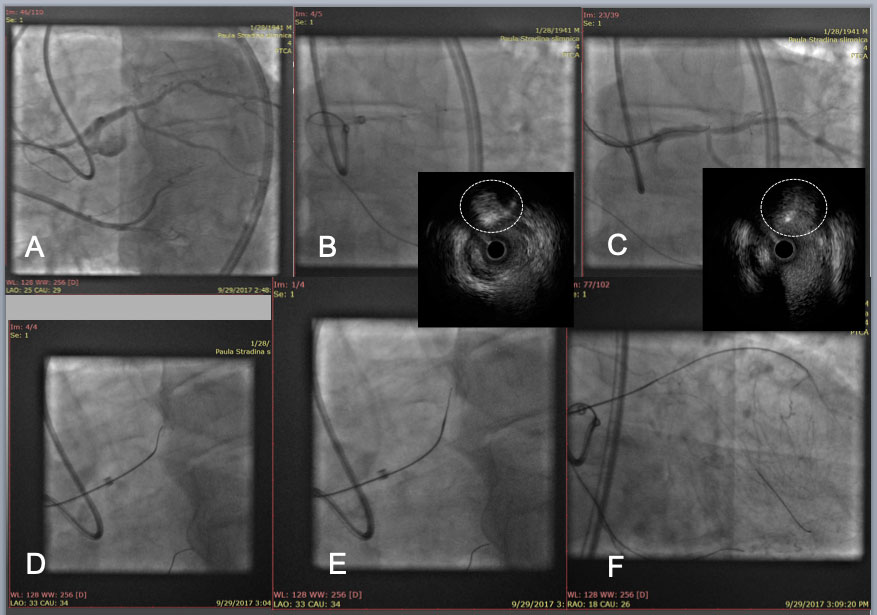
LAD CTO with an angulated Proximal plaque plane at a large side branch(A). After IVUS confirmation of the proximal cap (white dotted circle in IVUS, B), a Gaia 2 with a large secondary curve successfully punctured the proximal cap (wire cross section in white dotted circle in IVUS, C), and a Corsair pro was advanced to engage into the proximal cap(D), and an angled Gaia 2 was exchanged to a new Gaia 2 in a pre-shaped tip (E), which allowed the wire tip to enter a distal true lumen (F).
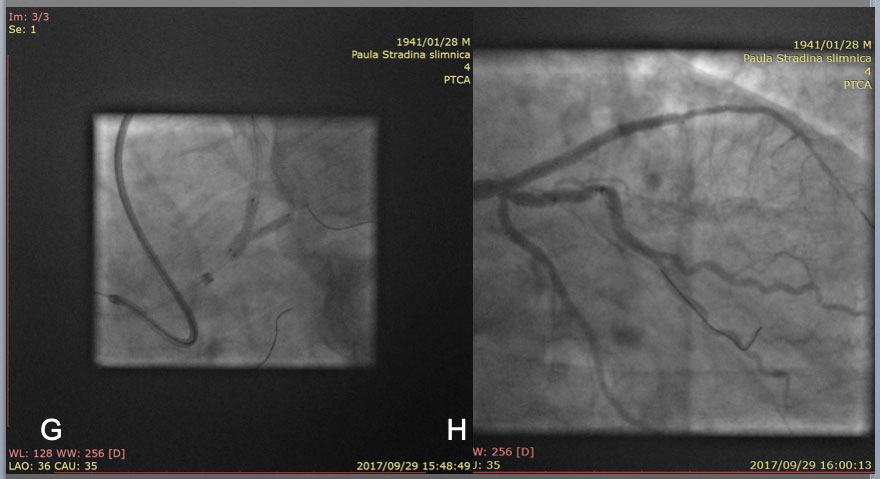
After guide wire exchanges, balloon dilation and IVUS pull back, 2 stent strategy deemed to be the best option in this case, so a mini Crush technique was applied for deploying a 3.5mm and a 2.75mm DES over the bifurcation (left anterior descending artery and intermediate artery, respectively) at conclusion of kissing NC balloon dilation(G). Final result in H.
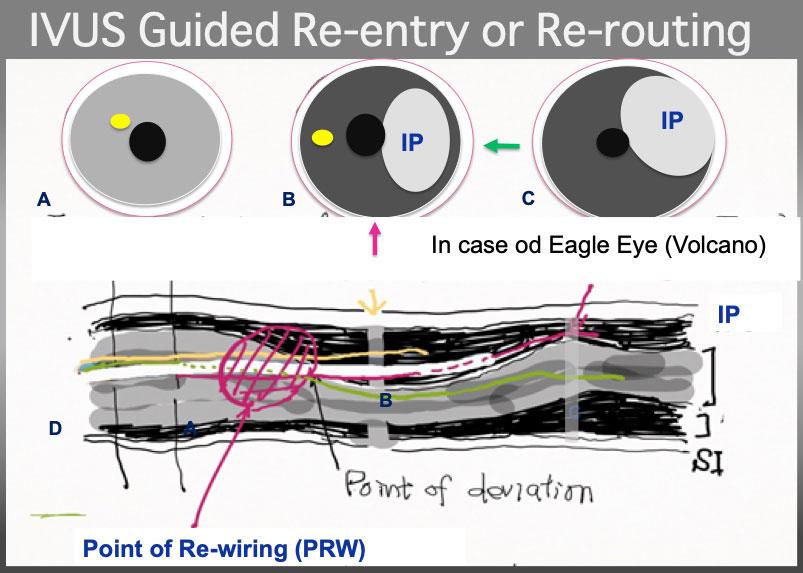
IVUS Guided wire re-routing. the 2 nd wire (a yellow line) had better pull back to Intimal Plaque (IP) and advance and torque simultaneously counter-clockwise in a illustration to certify that the 2 nd wire is in the Intimal plque in cross section B and C (although technically, visualization on PR region, and wire re-routing simultaneously is very challenging, especially in bending and /or calcified plaque, partially, IVUS probe restricts a wire movement and hinders deflection control). Of note, point of wire deviation is, most of the time, located at or neat eccentric calcified plaque or bending or both.
In Figure 7, if the CTO assumed LAD and longitudinal figure (D) assumed close to the projection of RAO, a Red arrow in IVUS illust B indicates RAO, which shows a green arrow in 3 o'clock LAD direction. Bi-plane Cine-fluoro machine will facilitate wiring hereafter.
Further detailed cases are presented in detail in Figure 8A, Figure 8b, Figure 8C and Figure 9A, Figure 9b, Figure 9c, Figure 9d, Figure 9e, Figure 9f, Figure 9g, Figure 9h, Figure 9i, Figure 9j and Figure 9k.
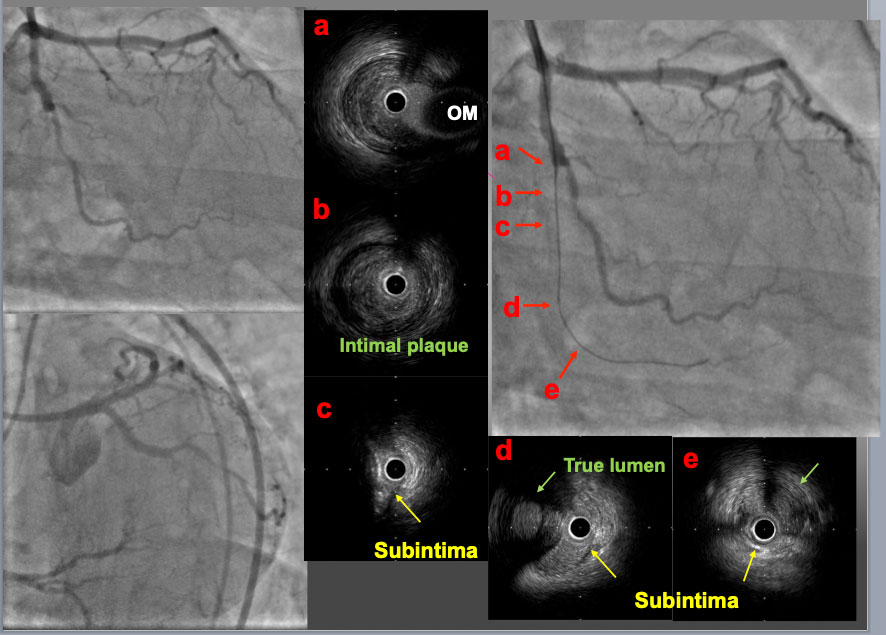
A mid LCX-CTO lesion was approached with a 7F. EBU4.0 guide catheter. A first GW was advanced to the proximal PL branch and an IVUS probe was inserted to check the GW position. In the proximal part of the CTO (b), the GW was in intimal plaque. In the mid part (c), the GW was in subintimal space behind a large calcified plaque. In the distal part of CTO (d) and the PL branch (e), the first GW was in subintimal space and so called true lumen (Intimal plaque) was confirmed (green arrow). These IVUS findings indicated that the intimal plaque was positioned on the opposite site of the OM branch (a, c and d).
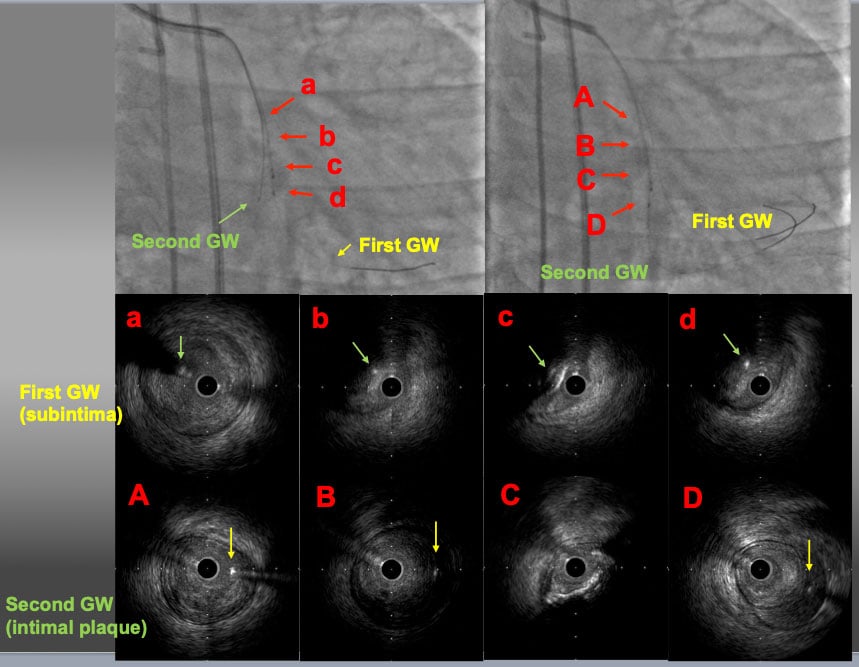
The IVUS probe was left in subintimal space. The second GW was advanced to the distal PL branch under IVUS guidance. The IVUS findings over the first GW showed that the second GW (yellow arrows) was in intimal plaque (a-d). The IVUS findings over the second GW confirmed that the second GW was in intimal plaque throughout the CTO lesion (A-D) and the first GW was in subintimal space (D).
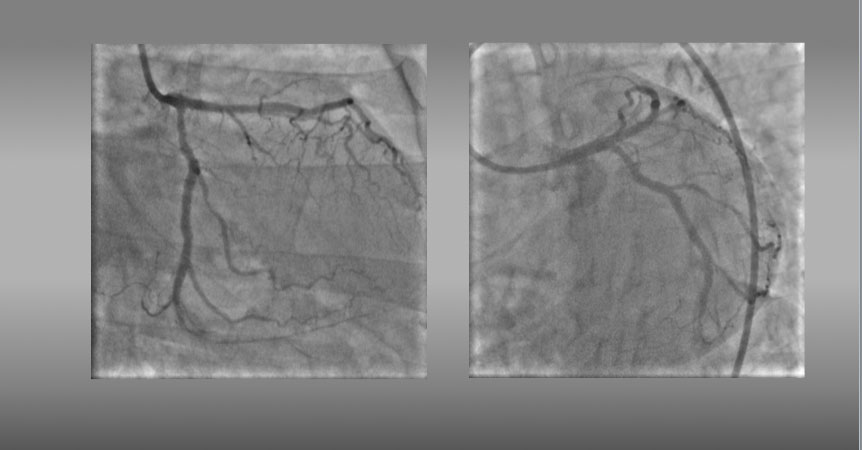
Final angiograms showed an optimal dilation with DESs through the second GW.
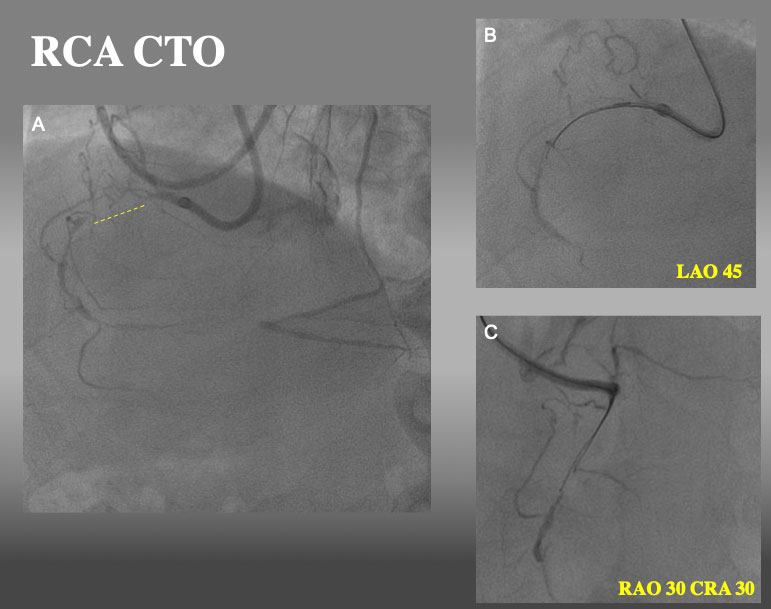
Proximal RCA CTO with ipsilateral collateral. After failure of a single wire escalation (GAIA NEXT1→GAINA NEXT 2 and parallel wire technique with SASUKE dual lumen catheter (2nd wire: GAIA NEXT 3), IVUS guided re-wiring was attempted.
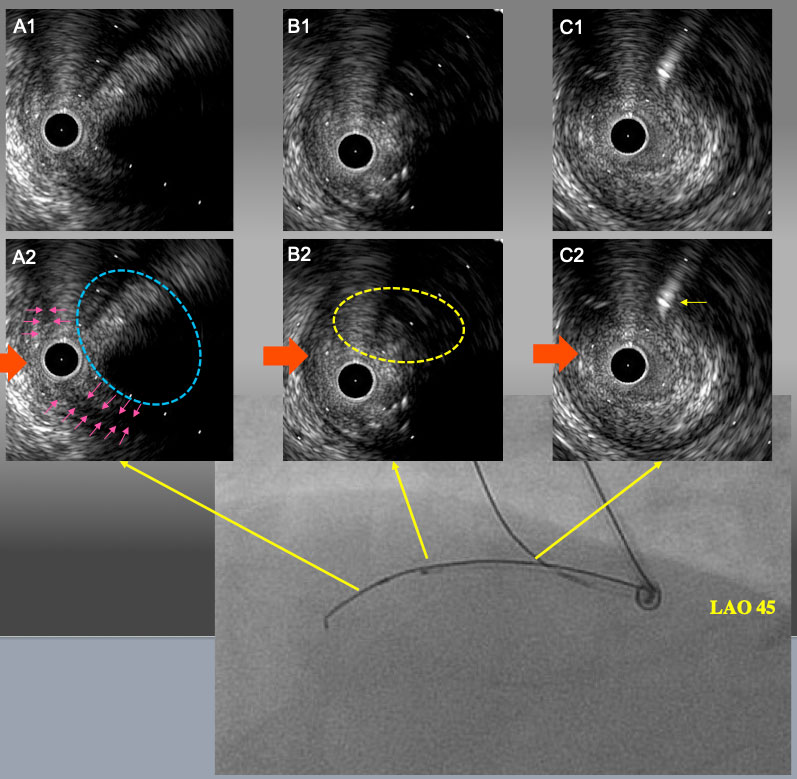
IVUS finding and angiogram from LAO 45° after 1.5mm POBA. A1 and A2: IVUS catheter was located in sub-intimal space with a small semi-lunar hematoma (pink arrows). Target intimal plaque was seen at 2 o’clock (blue dot line circle). B1 and B2: the point of deviation. Target intimal plaque was seen at 2 o’clock. C1 and C2: Proximal bifurcation. Guide wire in the conus branch (yellow arrow) came from 1 o’clock. In LAO 45° view, IVUS guide wire and side branch guide wire were seen upper side of IVUVS catheter. Therefore, red arrow is LAO projection in IVUS image.
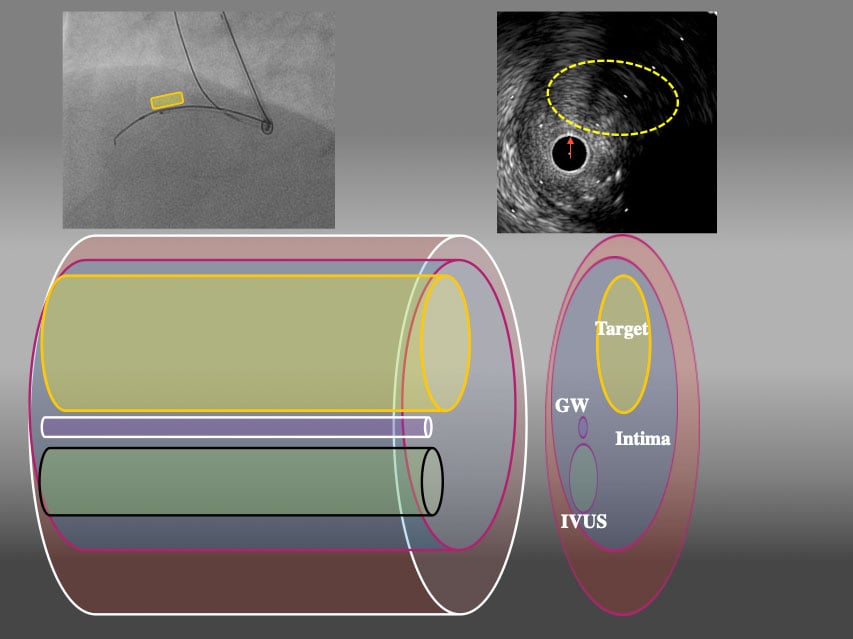
3D schema of IVUS finding from LAO45° From LAO view, Target intimal plaque was located upper side of IVUS catheter (yellow area).
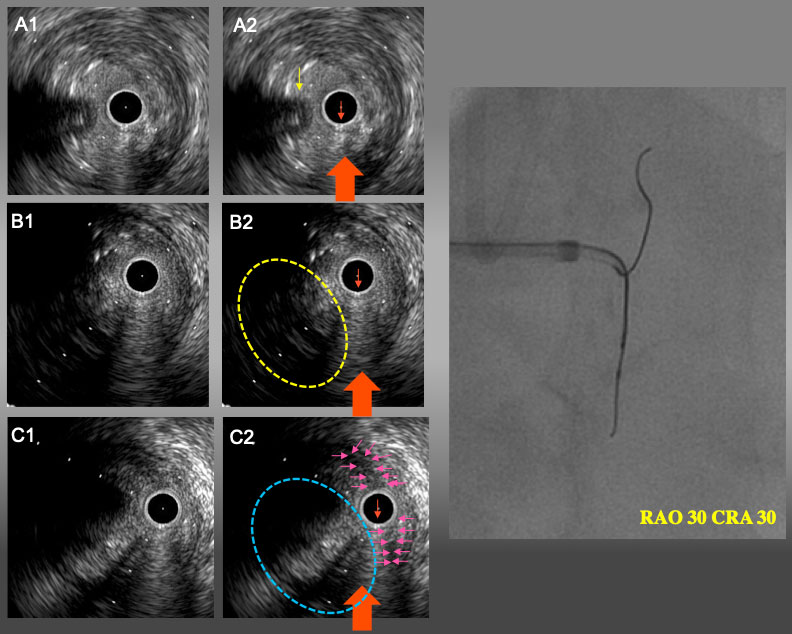
IVUS finding and angiogram from RAO30°CRA30° A1 and A2: Proximal bifurcation. Guide wire in conus branch (yellow arrow) came from 9 o’clock (left side of IVUS catheter). B1 and B2: the point of deviation. Target intimal plaque was seen at 8 o’clock. C1 and C2: IVUS catheter was located in sub-intimal space with a small semi-lunar hematoma (pink arrows). Target intimal plaque was seen at 8 o’clock (blue dot line circle). In RAO30°CRA30°view, IVUS guide wire and IVUS catheter were overlapped and side branch guide wire were seen left side of IVUVS catheter. Therefore, the red arrow is RAO CRA projection in IVUS image(A2,B2, and C2).
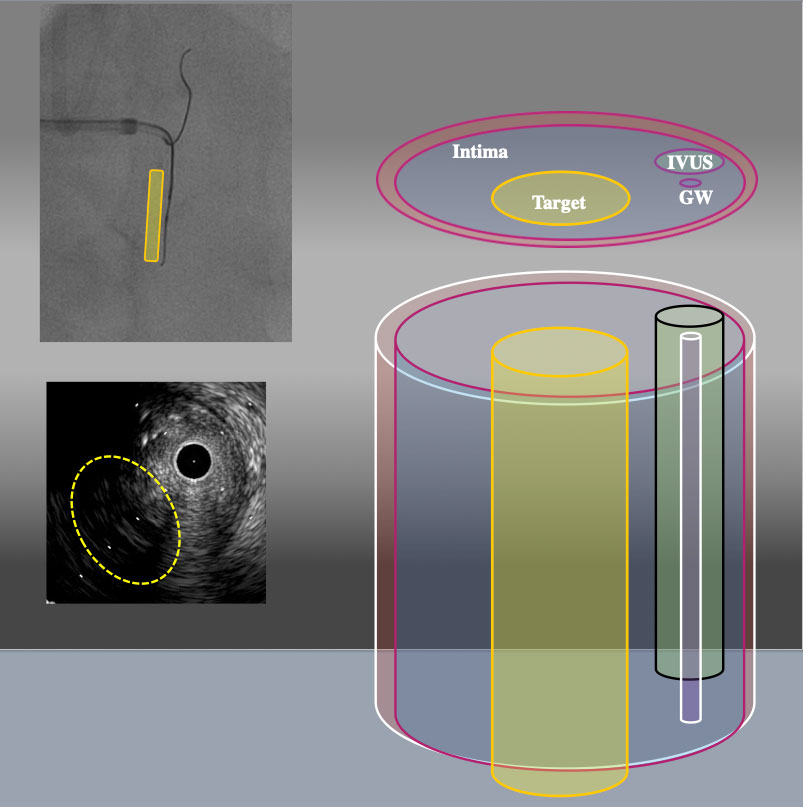
3D schema of IVUS findings from RAO30° CRA30° From RAO CRA view, Target intimal plaque was located left side of IVUS catheter (yellow area).
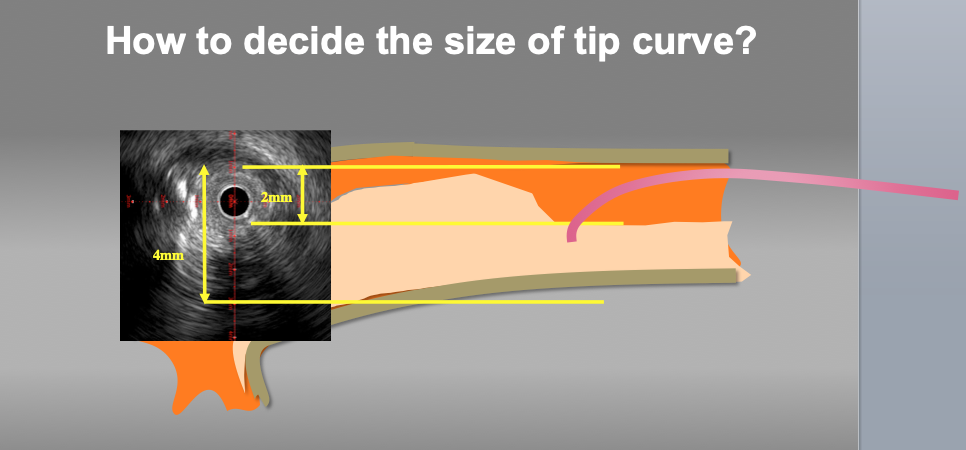
Measure to decide the size of the wire tip curve. Appropriate wire tip curve can be estimated according to the lumen and vessel size at the point of deviation. In this case, the size of tip curve from 3 to 3.5mm should be approapriate for re-wiring.
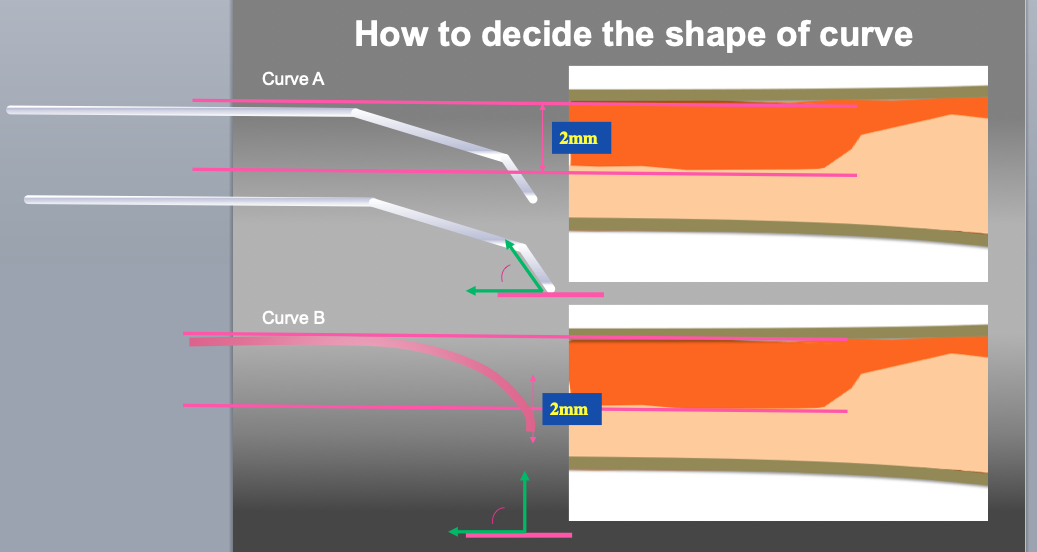
Measure to decide the shape of the wire tip curve. Even the same size of tip curve, the shape is a key factor of penetration efficiency. Curve A (small 1st curve with second curve) is recommended as 1st step. If re-wiring (penetration of target plaque) is difficult with curve A, then Curve B (large one curve) can be recommended.
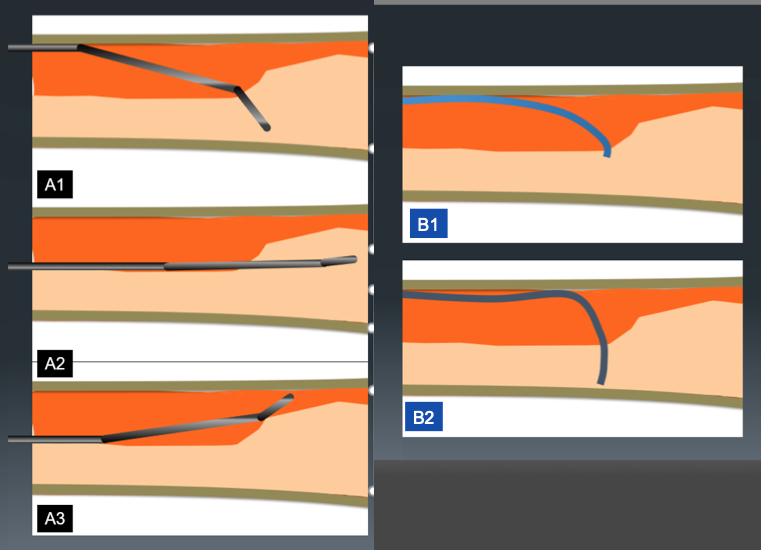
Difference of guide wire motion between curve A and B. Because of narrow angle between guide wire tip and intimal plaque, direction control of tip curve A is better than tip with curve B (A1-2, B1-2). However, the incidence of slip (when the wire does not penetrate deep enough) at the point of deviation is higher (A3).
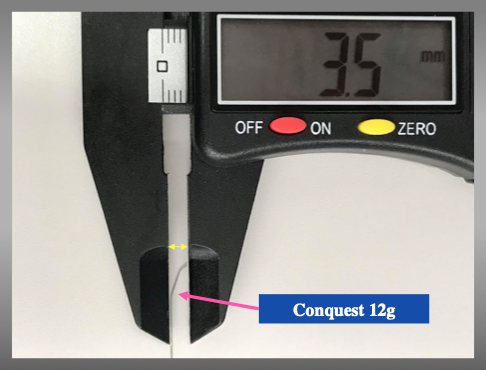
Representative curve shape and size of Conquest 12g.
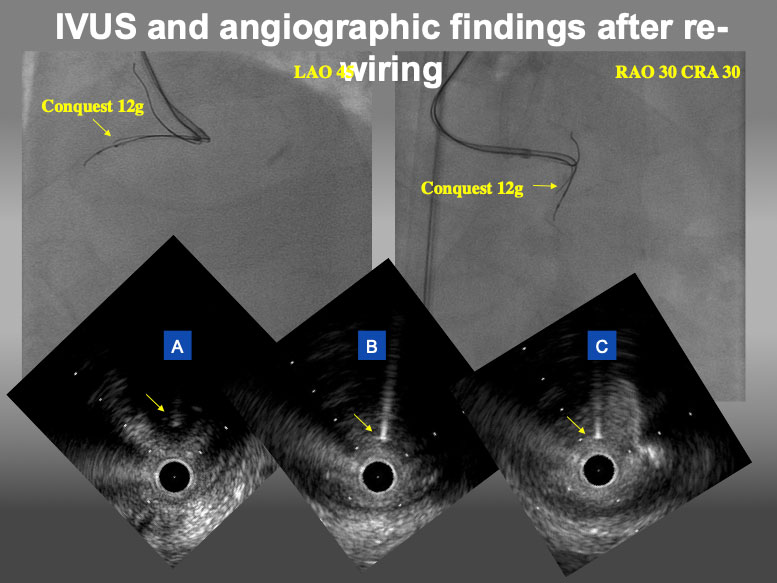
IVUS and angiographic findings after re-wiring by Conquest 12g. In angiogram, Conquest 12g was located at upper side of IVUS catheter in LAO view and left side in RAO CRA view. In IVUS findings, Conquest 12g (yellow arrow) could locate in the target intimal plaque at distal site (A), the point of deviation (B), and proximal site (C).
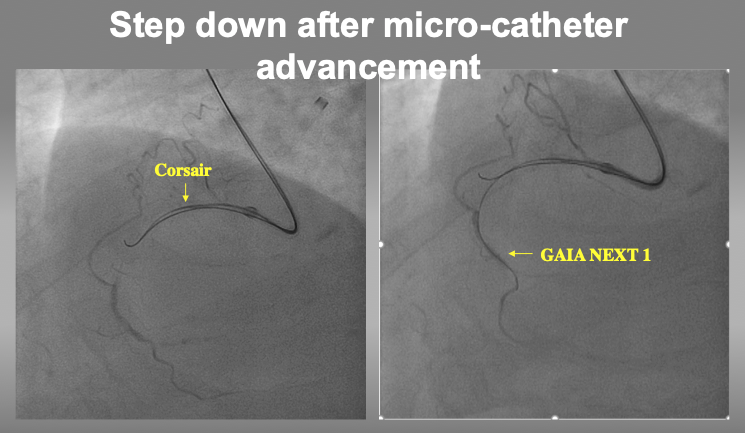
After confirmation of 2nd wire position in IVUS, micro-catheter can advance into the target intimal plaque for stepping down to a torquable guide wire (such as GAIA1, Miracle Neo 3, UB3, or XT-R).
IVUS is very much useful in:
Since reverse CART (Antegrade balloon inflation for retrograde wire (re)-entry to the true proximal lumen) is the most commonly used technique for retrograde dissection approach (RDR), followed by direct wire crossing (conceptually, retrograde wire escalation=RWE), kissing wire technique (KW), and just-marker technique (JM), since the application of IVUS facilitated Reverse CART , many modifications have reported such as Guide catheter Extension Reverse CART, stent-assisted reverse CART, and confluent balloon Reverse CART (refer to the chapter in Retrograde CTO PCI).
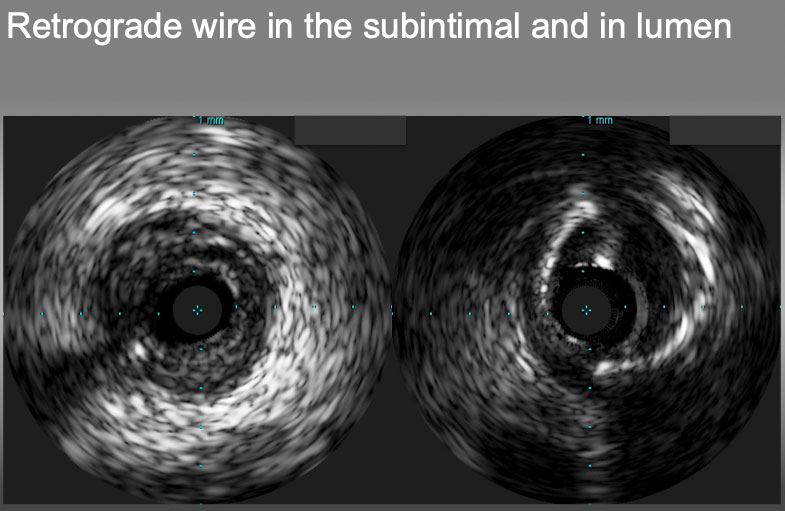
Retrograde wire in the subintimal plaque (left) and in the true lumen(right).
More recently, to avoid misunderstanding, and miscommunication among the operators, a group of CTO experts has classified the subtypes of reverse CART method, such as conventional, directed, and extended . This classification provides not only the technical interests but also a priority of the plan to choose in a case of difficulties.
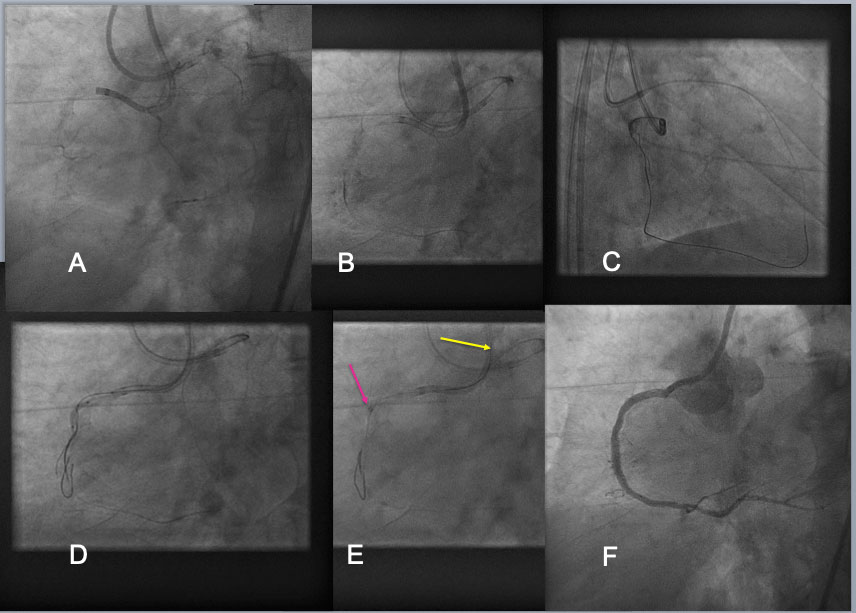
Guide Catheter Extension Assisted Reverse CART in RCA CTO. A RCA CTO, which was long (from the ostium to the distal PDA-PLV bifurcation) and heavily calcified CTO, was approached by bilateral 7F Guide systems (A). Bilateral approach was made using Antegrade Gaia Next 3(Asahi Intecc) and retrograde Gaia Next 3 (B), but attempt to reverse CART in the proximal bending failed(C). A 2 nd antegrade wire of Confianza Pro 12g(Asahi Intecc) was advanced over a dual lumen catheter and placed different layer of calcified CTO. After 1.5-2.0mm balloon dilation over the 2 nd guide wire over the proximal to mid segments of occlusion(D), a 6F Guide liner (Teleflex) was advanced into the CTO segment(a red arrow in E), where a retrograde Gaia Next 2 wire entered the extension (a yellow wire in E), and a wire exchange and externalization was completed by advancing a retrograde microcatheter into the extension over a trapping balloon. After balloon dilation and DES deployment, an excellent result was obtained(F).
When there are difficulties encounter in RDR, one of the methods to apply without IVUS is a Guide-catheter extension (GCE) assisted reverse CART. With a deep sitting of GCE inside CTO, a proximal cap is shifted to the GCE tip, to facilitate reverse CART . Once the wire gets into a GCE, a retrograde microcatheter can advance over a retrograde trapping wire, and once the mico catheter or an extension inside, the wire can change to an externalization wire (such as RG3 or R 350). The technique can minimize the risks associated with an RDR induced left main trunk sub-intimal wiring in the CTO involving a LAD or LCX ostium, since a GCE, once engaged deeper into the LAD or LCX can isolate and modify the proximal cap deeper, therefore, can avoid the wire crossing through the SIS before a left main trunk-LAD- LCX bifurcation .
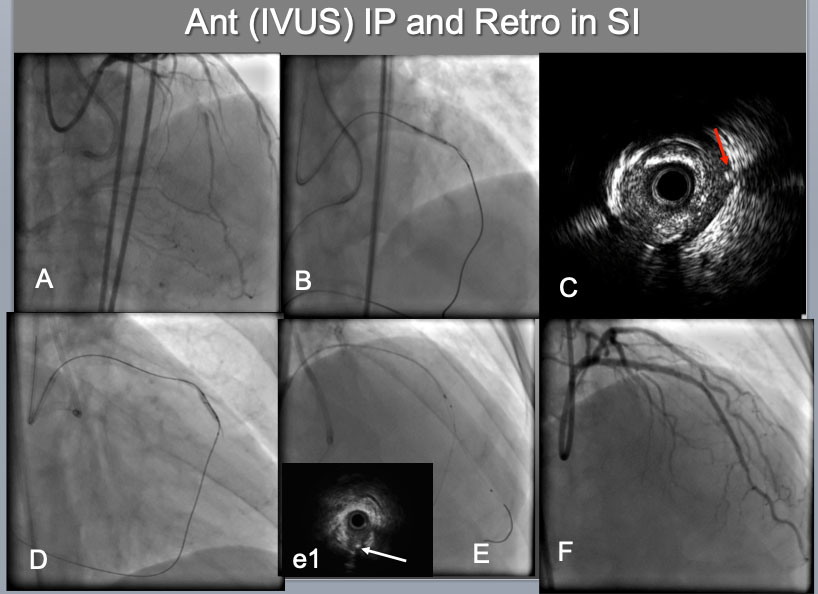
IVUS guided intimal optimization in retrograde approach A proximal-mid LAD CTO, which was calcified, bending (A),was approached bilaterally by both 7F systems(B). Since difficulties were encountered on reverse CART attempt, IVUS was interrogated(C), which indicated an IVUS probe in the Intra plaque(IP) and a retrograde wire in the subintimal space (a red arrow in C). Therefore IP side wire was advanced deeper (more distal) and balloon was dilated there(D), which resulted in successful reverse CART. After successful retrograde wire externalization and placement of a 2 nd wire in the distal LAD (E), IVUS confirmed a distal true lumen, a bifurcation with a retrograde septal wire(a white arrow in (e1) and the CTO IP tracking. A final result (F).
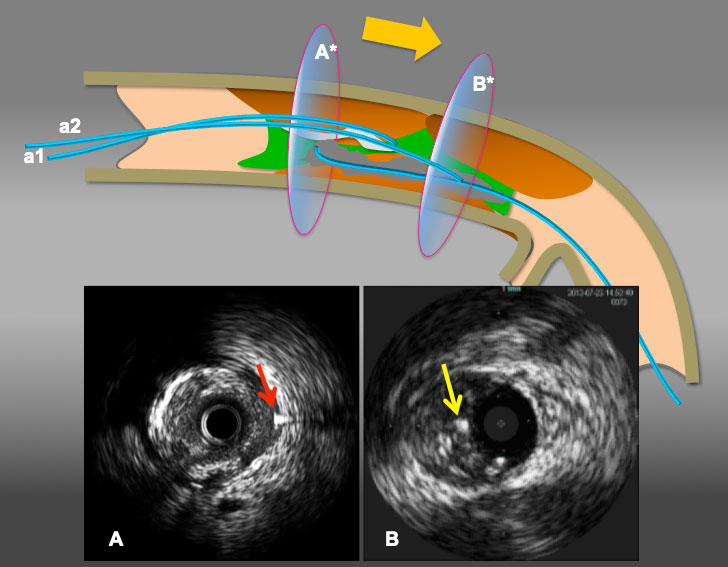
Illustration to resolve antegrade wire (IVUS) in IP and retrograde wire in subintima situation. When a retrograde wire (a red arrow in A) stays inside of subintimal space(A), reverse CART can be challenging. However, when a simple rule applies (move intraplaque wire ahead), as in A* in broad yellow arrow arrow(from antegrade wire a1 to a2), the maneuver provides a antegrade wire to slide into the subintima (an yellow arrow in B) (with or without a knuckle wire), resulting in subintima-subintima situation as illustrated in (B*) and successful retrograde wire crossing by reverse CART.
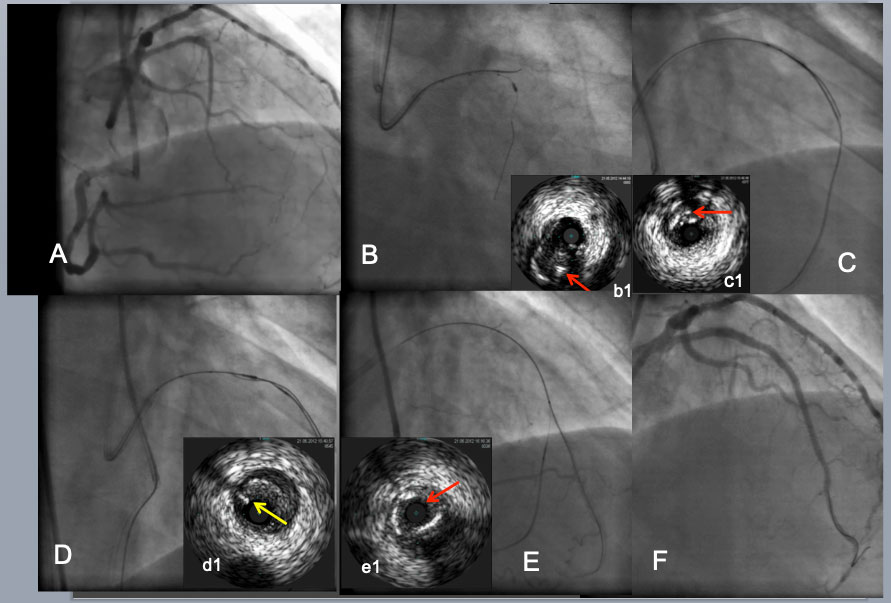
IVUS guided intimal optimization in retrograde approach. As an initial step to a CTO with a large side branch(B), IVUS from the branch enabled a Gaia 2 to puncture the proximal CTO cap (a red arrow in b1indicated the wire in the intimal plaque(IP). After difficulty in reverse CART attempt (C). IVUS located a retrograde wire in the IP(a red arrow in c1). Further advancement of retrograde wire resulted in subintimal position (a yellow arrow in d1) over a pull back IVUS in more proximal LAD(D) and successfully entered the antegrade guide. After a retrograde wire exchanged to an externalization wire and a placement of a 2 nd wire into a distal LAD(E), IVUS confirmed the distal true lumen(a red arrow in e1). A final result (F).
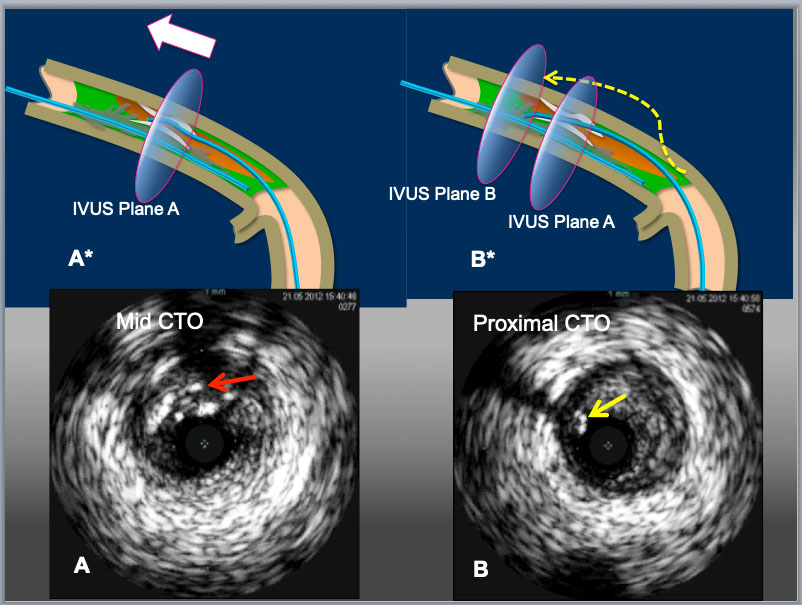
Illustration to resolve retrograde wire in IP and antegrade wire (IVUS) in subintima situation. When a retrograde wire (a red arrow in A) stays inside of partially calcified encircled intimal plaque (A), reverse CART can be challenging. However, when a simple rule applies (move intraplaque wire ahead), as in A* in broad white arrow, the maneuver provides a retrograde wire to slide into the subintima in (an yellow arrow in B*) (with or without a knuckle wire), resulting in subintima-subintima situation as illustrated in (B*) and successful retrograde wire crossing upon a balloon dilation of reverse CART.
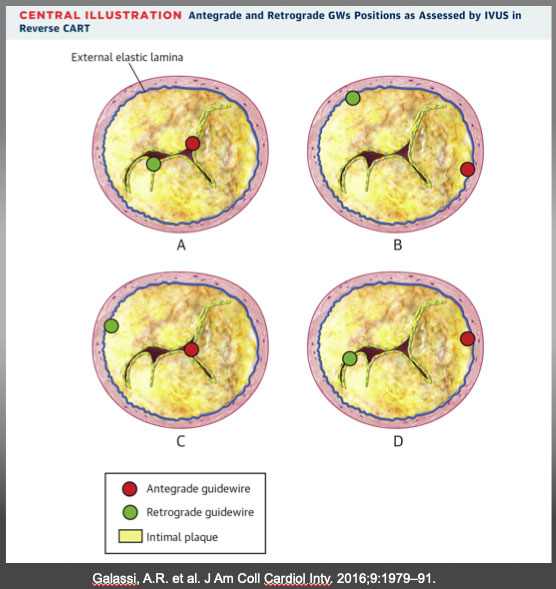
(A) Antegrade and retrograde guidewires (GWs) in intimal plaque. This is the ideal scenario to make a connecting channel, after antegrade balloon dilation in chronic total occlusion body. (B) Antegrade and retrograde GWs in subintimal space. Another ideal condition in which it is easy to create a connection in the same space after balloon dilation. (C) Antegrade GW in intimal plaque but retrograde GW in subintimal space. Very complex situation in which it is crucial to create a medial disruption with a proper balloon sizing to create connection between the 2 GWs. In case of failure, is possible to advance antegrade wire distally to reach subintimal space and create the previous situation (subintimal–subintimal). (D) Antegrade wire in subintimal space but retrograde wire in intimal plaque, often very calciï¬Âed. The most complex situation because antegrade balloon dilation usually enlarges subintimal space (increasing intramural hematoma) without any possibility to create connection between the 2 GWs. In this situation, the connection is usually achieved by pushing the retrograde wire in subintimal space (usually with retrograde knuckle technique). In such a complex case, a possible less used alternative is a retrograde balloon dilation (original CART) to create medial dissection and facilitate antegrade GW connection with retrograde GW. CART=controlled antegrade retrograde tracking; IVUS = intravascular ultrasound. Galassi, A.R. et al. J Am Coll Cardiol Intv. 2016;9:1979–91.
IVUS use of current CTO-PCI have played a vital role in safety (resolving proximal cap ambiguity, wire position in SIS or IP, the extent of dissection and hematoma), efficiency (navigating wires both antegrade and retrograde approaches) and long-term durability (re-entry to IP, optimize IP tracking, and stent optimization). The benefits of IVUS-guided PCI has not yet proven on clinical outcomes in a large scale, randomized, multicenter trial, but on the expert hands, IVUS guidance has improved the quality and outcomes of CTO-PCI (Figure 15a, Figure 15b). Current approaches of algorithmic CTO suggest broader applicability of IVUS on crucial decision-making step , , .
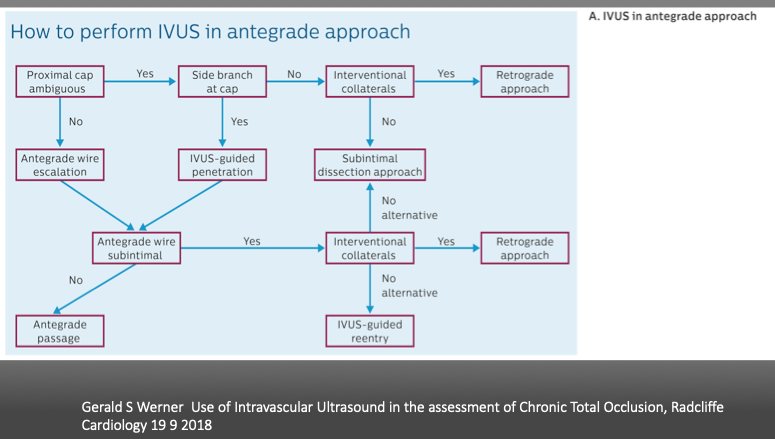
Gerald S Werner Use of Intravascular Ultrasound in the assessment of Chronic Total Occlusion, Radcliffe Cardiology 19 9 2018
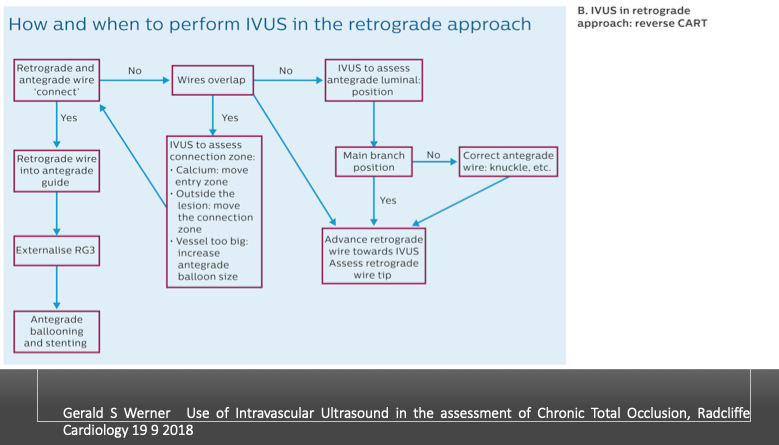
Gerald S Werner Use of Intravascular Ultrasound in the assessment of Chronic Total Occlusion, Radcliffe Cardiology 19 9 2018
Use of IVUS has increased from 2.9% of 2011 European Registry (ERCTO) to 38% of 2016 US registry (19,20). In the latter registry, among the IVUS guided group (N_234), the main focus of IVUS was stent sizing (26.3%) and optimization (38%), followed by guide wiring, proximal cap puncturing, and guide reverse CART (Figure 16) . Despite higher complexity of IVUS guided group vs no-IVUS group (J-CTO score: 2.86±1.19 vs 2.43±1.19, P=0.001), both achieved similar technical (92.8% versus 89.6%, P=0.302) and procedural success (90.1% versus 88.3%, P=0.588) and similar incidence of MACE (2.7% versus 3.2%, P=0.772).
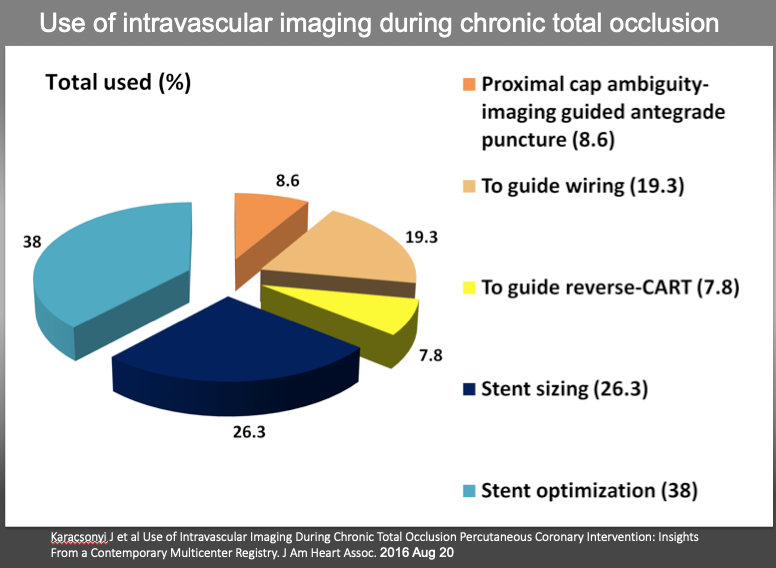
Use of intravascular imaging during chronic total occlusion percutaneous coronary intervention. CART indicates controlled antegrade and retrograde tracking and dissection.
In a 2015 report, the patients (N_230)with successful CTO wire crossing were randomly assigned to IVUS- or angiography-guided PCI. Primary endpoint was Lower in-stent late lumen loss at one year follow-up , which was significantly lower in the IVUS-guided group, compared with in the angiography-guided group (0.28±0.48 mm vs. 0.46±0.68 mm, p=0.025), with a significant decrease in restenosis of the "within-true-lumen" stent between the groups (3.9% vs.13.7%, p=0.021). The MACE were similar between the groups at two-year follow-up (21.7% vs. 25.2%, p=0.641) .
Kim et al. reported testing the hypothesis that IVUS-guided CTO intervention is superior to angiography-guidance in a prospective, randomized, multicenter trial. The IVUS group (n=201) or the angiography group (n=201) were allocated with secondary randomization to Zotarolimus-eluting or Biolimus-eluting stents. After 12-month, the rate of cardiac death(primary endpoint) was similar between the IVUS and the angiography groups (0% vs. 1.0%; P by log-rank test=0.16). The rates of target-vessel revascularization were not different between the groups. However, MACE (secondary endpoint) were significantly lower in the IVUS group (2.6% versus 7.1%; P=0.035; hazard ratio, 0.35; 95% confidence interval, 0.13-0.97). In the comparison between Zotarolimus and Biolimus stent, MACE rates were similar (4.0% versus 5.7%; P=0.45) .
A large scale, randomized trial is needed to substantiate the benefit of IVUS guidance, while on daily practice, selective use of IVUS will provide a practical solution for experts hands.
See the section of CTO PCI, Antegrade approach for CTO, and ADR sections
CCTA has been known to possess the ability to differentiate the coronary plaque composition beyond the presence/absence or degree of calcification in comparison with IVUS and histopathology , . With an improvement of hardware and rapid development of dedicated workstation, CCTA is one of the most rapidly expanding modalities to assess on CTO, for procedural road mapping and improved result .
CTO operator can find a much of useful information in CCTA before the index PCI procedure, regarding the proximal cap ambiguity, true length of occlusion, the amount and distribution of the calcified plaques, distal vessel size, degree of remodeling, presence of collaterals and entire vessel course .
Acquisition of the high-quality pictures is beyond the scope of the chapter, so it is highly recommended that one refers to the dedicated books on the subjects in term of acknowledging basic principles and interpretation of the images , . All the figures in the chapter were adapted from our daily practice and recorded by the electrocardiogram-gated, heartbeat detector row CT. The gantry rotation time was 0.35-0.5 seconds in a single source, less than 0.1 seconds in a Dual source per rotation, and the slice thickness was 0.5 mm. The tube voltage was 80-120 kV on the patient condition (Aquilion ONE, Canon Medical, Japan, SOMATOM Definition, Siemens, Germany, and Revolution CT, General Electric, USA) on each institution. Oral metoprolol was administered before image acquisition for optimal heart rate unless contraindicated. Contrast injection protocol consisted of a bolus of 50-80 mL of nonionic contrast medium at a flow rate of 4 to 5 mL/s followed by an injection of 30 mL of contrast–saline mixtures and of saline 30 mL.
The acquired data set is analyzed in the dedicated workstation by a group of technicians, radiologists, and cardiologist when ambiguity present. Image data set was reconstructed by 0.5 to 0.7 mm slices in MPR and 0.5 -20mm slices in MIP. The whole plaque is assessed by cross-sectional views with 1-mm slice to evaluate the maximal and minimal luminal area of CTO and neighboring segments.
CTA Protocol should include hi-standardized images on stable hemodynamics for 3D Volume Rendering (VR), Multiple Reconstruction (MPR) and Maximum Intensity Projection (MIP), among others (Figure 18, Figure 19, Figure 20).
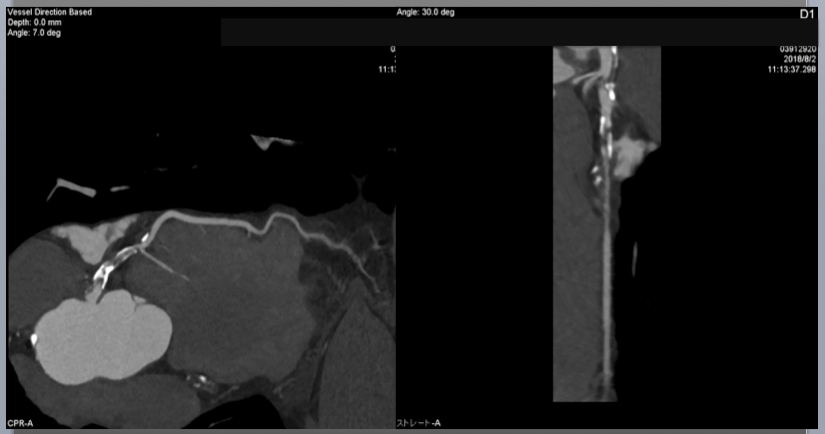
Curved multiplanar reconstruction(cMPR) image and stretched MPR image. cMPR is useful to visualize the whole coronary tree in a single slice (therefore, the images are reformatted along a curved plane).
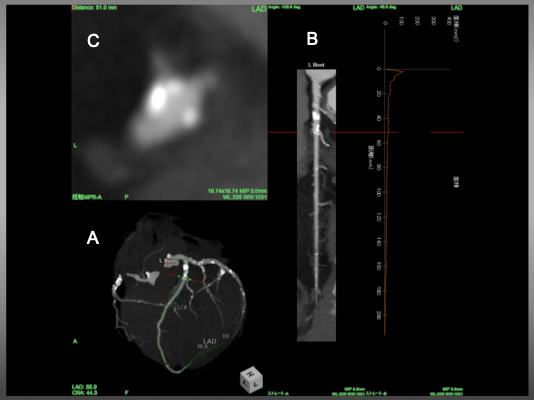
Angiographic view B) Stretched MPR image and C) Cross sectional view of LAD. Red line indicated a corresponding level of the vessel . In figure C, an eccentric calcified plaque locates in 10 o’clock direction, while take-off of the diagonal bifurcates at 7-8 o’clock.
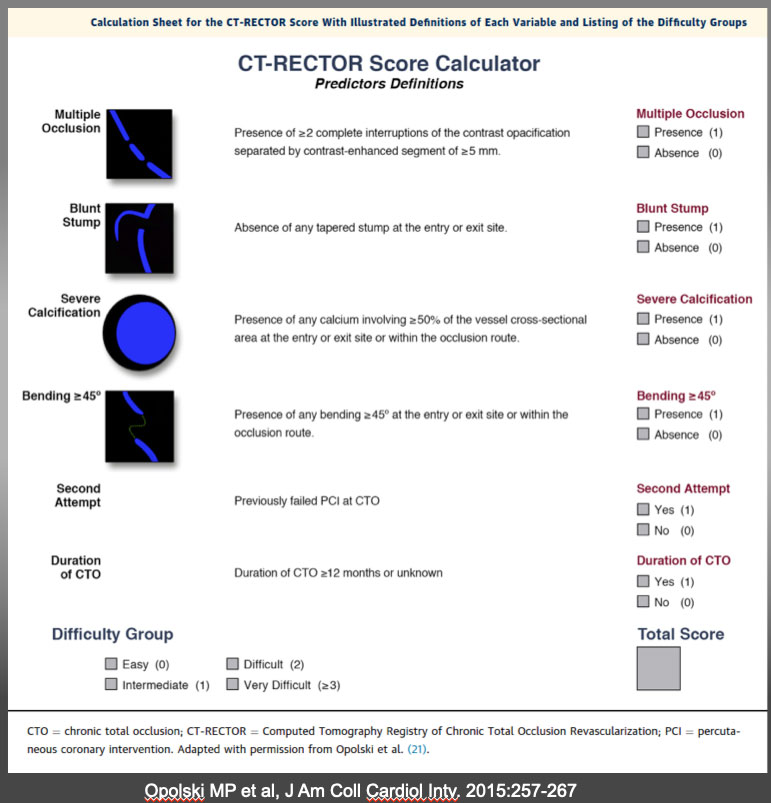
The CT-RECTOR Score Calculator Calculation sheet for the CT-RECTOR (Computed Tomography Registry of Chronic Total Occlusion Revascularization) score with illustrated definitions of each variable and listing of the difficulty groups. Recent development of CTA co-registration images will further facilitate precise wiring on “a road mapping”. One study has emerged that pre-procedural CTA contributes positively in success rate of CTO-PCI (10). A Wider application of these imaging and “pre-procedural navigation” will further facilitate our understanding, classification, and treatment strategies of the heterogeneous groups of the CTO. K-CTO score Opolski MP et al, J Am Coll Cardiol Intv. 2015:257-267
VR provides 3-D views of the coronary anatomy showing the entire coronary tree, which displays an excellent overview of vessel anatomy outside, but not interior information.
(Figure 16)
Angiographic view, a form of MIP images, to show a 3 D views of anatomy. As the name implies, the views can locate calcified plaque alongside the vessel course. Large epicardial collaterals could also be visualized.
MPR provides more detailed cross-sectional information including curved tomographic and short axial views. Of note, since MPR images are reconstructed from the original data set and analyzed by software, the image axis is not sliced by long anatomical axis.
MIP, especially slab MIP, provides continuous CT images, given on a certain slab thickness. Each slice projects the intensity of each pixel and provides the maximum intensity among the continuous images. This view simulates the actual cross-section of the coronary in a given axial plane and slice width. Therefore, one image can not depict the entire length of a vessel. The most advantage of Slab MIP is capable of confirming not only the proximal cap, but also vessel course, and the distal cap by slice by slice analysis. Also, it can describe plaque characteristics, location of calcification and the degree of vessel remodeling. However, construction images are influenced by the acquisition time (vessel slice can change by heartbeats) and space (respiratory influence), so some considerations of minimizing artifacts must be required in obtaining the data set.
The rapid heart rate of atrial fibrillation and inability to hold breath are two major sources of motion artifacts in obtaining CTA data acquisition. Also, the presence of heavy calcification, prior stent implantation, surgical clips, pacemaker or ICD electrodes, lesions of RCA and LCX in the presence of pericardial effusion are reported to interfere with the image reconstruction for their higher CT density or blurred motion, respectively. , , ,
CTO segment is defined by the complete absence of luminal enhancement.
CTO length is measured along the vessel axis
Both proximal and distal cap of CTO is described as blunt, tapered, or non-tapered or tapered.
Among the non-CTO lesions, significant stenosis is considered by diameter stenosis ≥70% in the major epicardial artery
Calcification is recognized as a white mass(es) in a cross-sectional view. Significant calcification is defined as > 50% cross-sectional area in the CTO segment.
Whole calcified occlusion on CTA does not mean the inability to penetrate with a wire, balloon dilation, and full stent deployment. Cross-sectional analysis by 0.5-1.0mm slice on MPR image describes a possible “donuts hole” on broader CT scale windows. Once CTO is crossed, judicious use of additional rotablator, Lazer, shockwave lithotripsy will enhance successful expansion of the DES and possible long term outlook.
More recently, the augmented-reality glass integrated system (Co-registration) becomes possible in complex CTO cases, which will facilitate a procedure and allow a streamlined approach with possible better procedural results
Routine use of CCTA will not be considered applicable for all CTO before PCI at this stage.
Case 1. Proximal Cap ambiguity of LAD CTO (Figure 21).
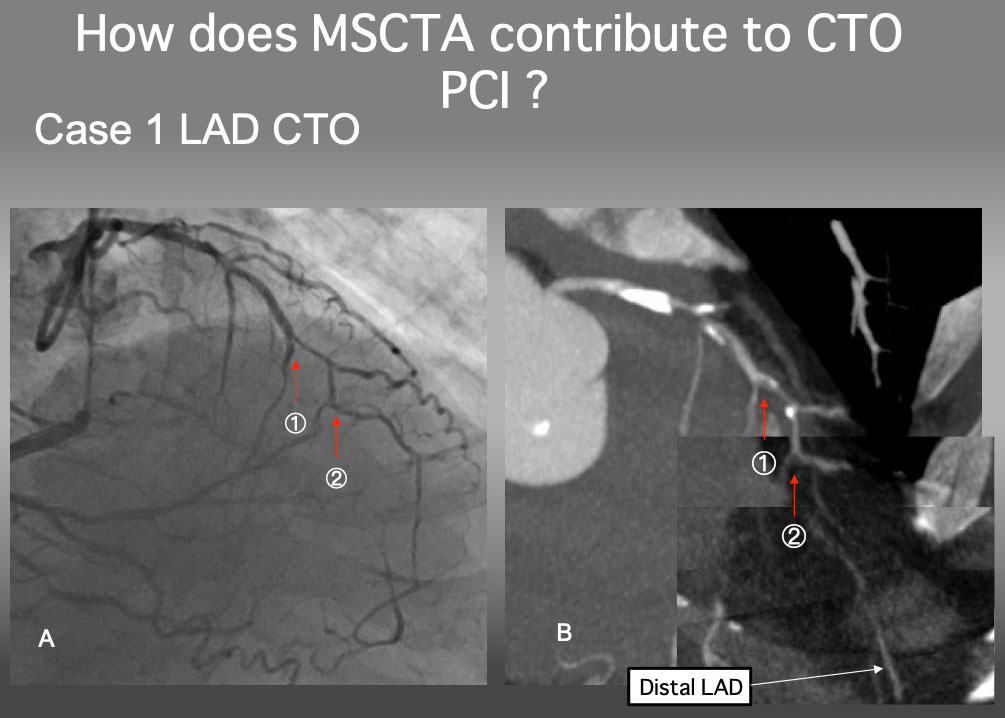
Case 1. Clarify a proximal cap ambiguity
The proximal cap of this CTO seems to be at 1, but a serial MIP images confirmed that the point 2 is a true proximal cap. The detailed analysis of MSCTA can resolve an ambiguity of the CTO proximal cap.
Case 2. Ambiguous proximal and distal cap and vessel course of RCA CTO (Figure 22a and Figure 22b).
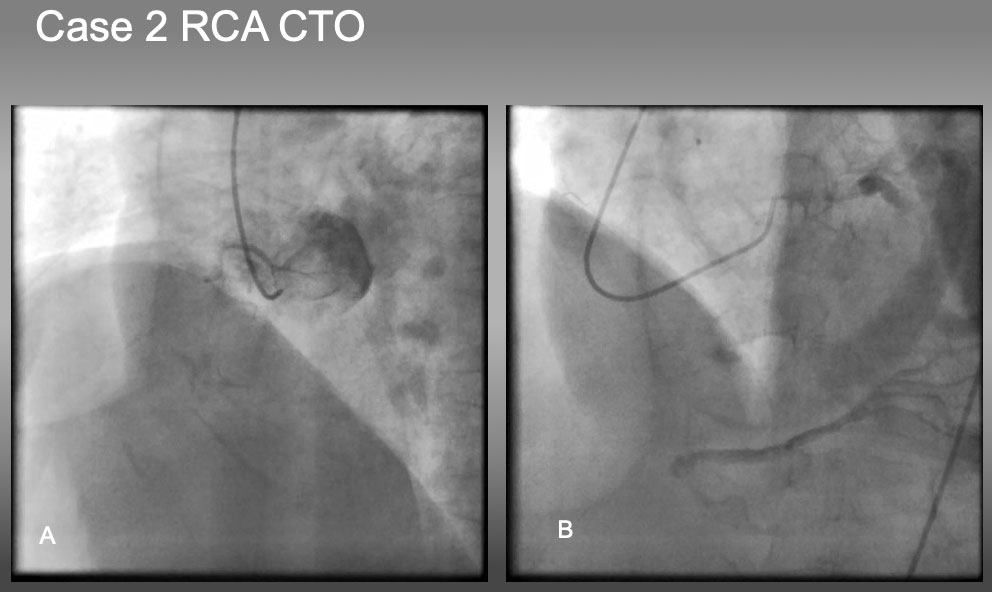
Case 2. RCA CTO with ambiguous proximal and distal caps.
The case is an RCA ostial CTO , but angiography fails to locate the proximal cap in (A), as well as distal cap in (B).
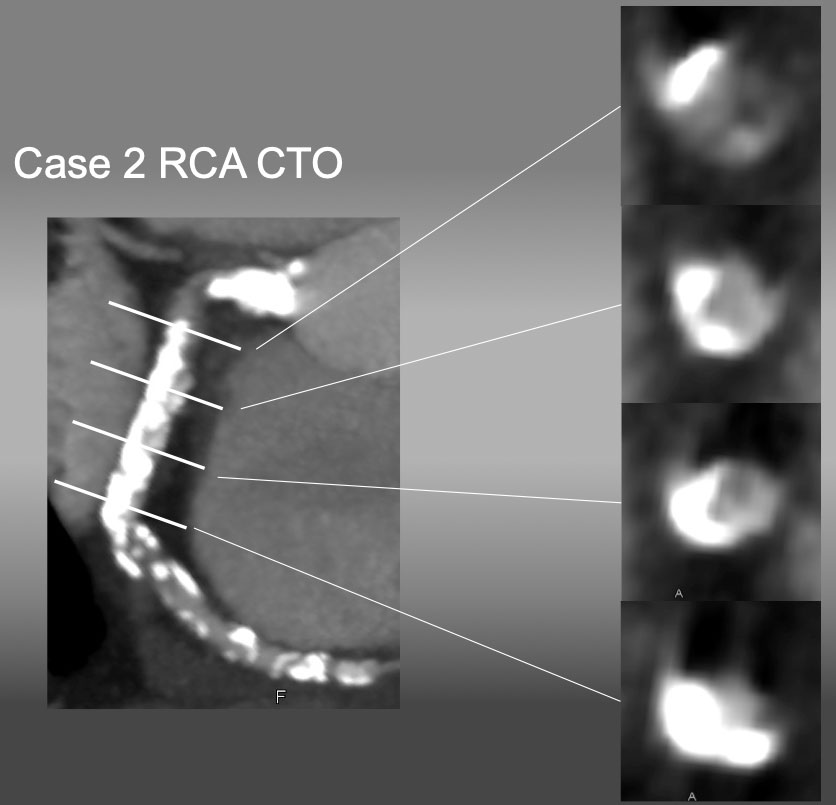
cMPR image provided a high grade calcified plaque at the ostium, bending CTO, and heavy, half-way circumbent calcification in the middle segment. Upon CTO PCI, heavy calcification marked an ostium, where a guide catheter was engaged and successful recanalization was obtained. IVUS showed a real length of the occlusion was 8-10 mm along the bend.
Case 3. Ambiguous CTO vessel course of mid-RCA CTO (Figure 23).
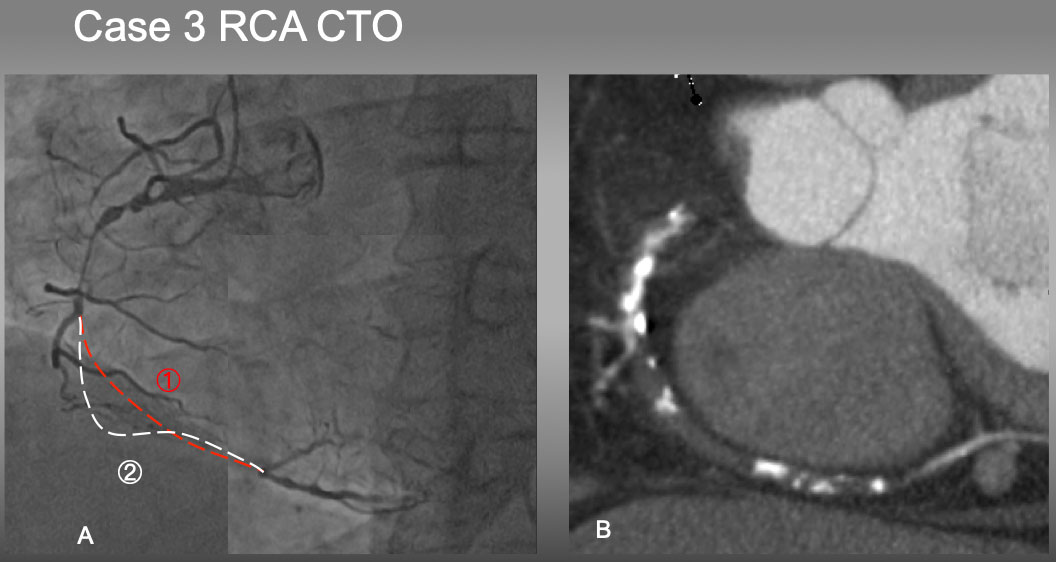
Case 3. It would have been difficult to estimate which is an occluded vessel course in 1 or 2 by an angiography alone (A). However, Slab MIP image (B) resolved the ambiguity of the course and characterized mainly a soft plaque with a few eccentric calcified plaques, which facilitated antegrade approach of PCI .
Case 4. Ambiguous proximal and distal caps of LAD CTO (Figure 24).
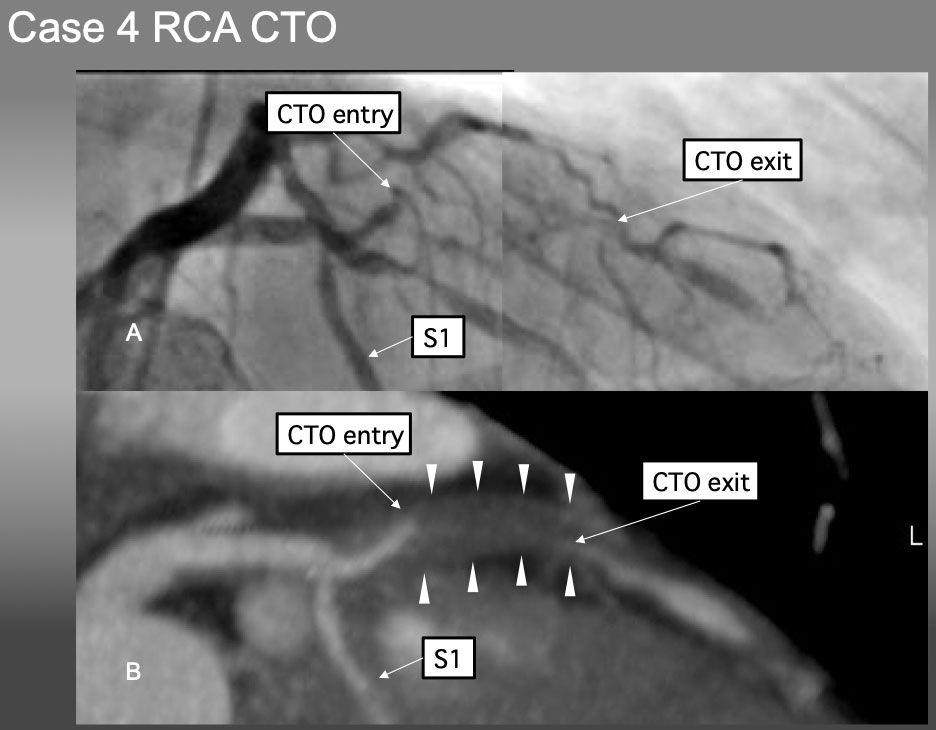
Case 4. It is very difficult to locate the proximal CTO cap by angiographic analysis alone in (A). Pre-procedural Slab MIP in B), however, not only provided the location, morphology of the proximal and distal caps, but also shed the light of disease process of positive remodeling without calcification.
Case 5. Practical application of CCTA-Angiography co-registration of a short, but calcified mid LAD CTO (Figure 25a, Figure 25b, Figure 25c).
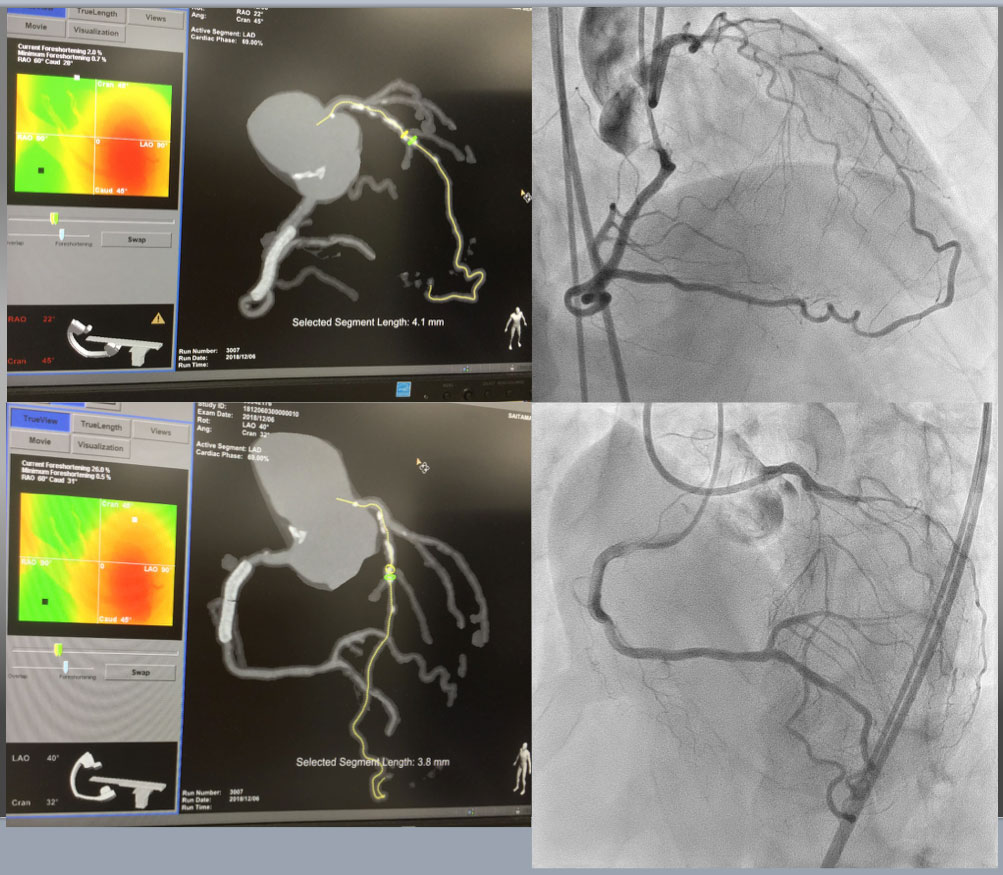
Case 5. CTA Guided Co-Registration CTO-PCI Upper Left showed RAO Cranial projection of CTA on MIP filter(more enhancement of calcified segment), while upper right was bilateral coronary angiography on identical projection with CTA. Estimated CTO was short of 4.1mm, but moderately calcified continued form more proximal segment. Lower left and right provided CTA (MIP) on LAO cranial and bilateral angiography on the same view, respectively.
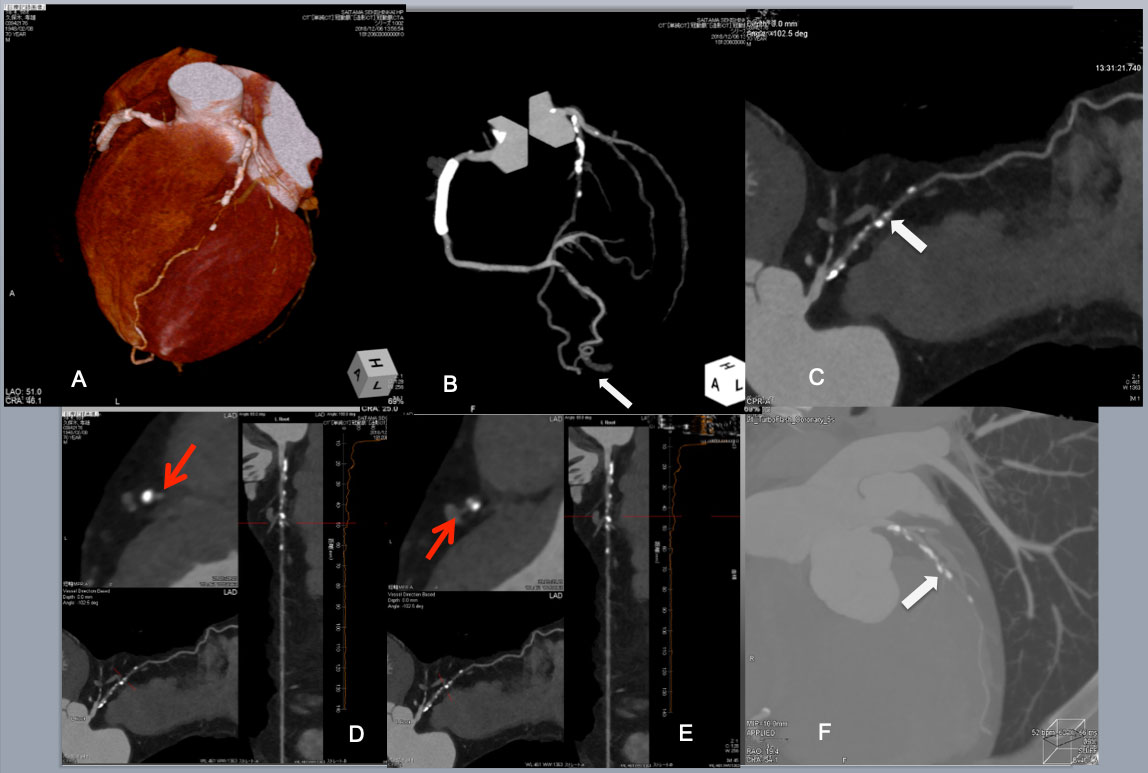
Continued Post CAG CTA provided a wealth of CTO anatomical information. VR image and angiographic projection indicated proximal moderate-heavily calcified plaques and a few scattered calcified plaque thereafter and poor distal flow or possible 2 nd occlusion(A, B) .Of note, a large tortuous epicardial collateral from a distal PDA to the apical LAD is also visualized (a white arrow in B). MPR showed a short CTO segment(a white arrow in (C). A cross section of stretched MPR revealed a large eccentric plaque over a septal branch beyond the CTO (a red arrow in D), and a diagonal branch before CTO (a red arrow in E). A slab MIP image of a wide CT windows disclosed an eccentric calcified plaques before and after the CTO (a white arrow in F).
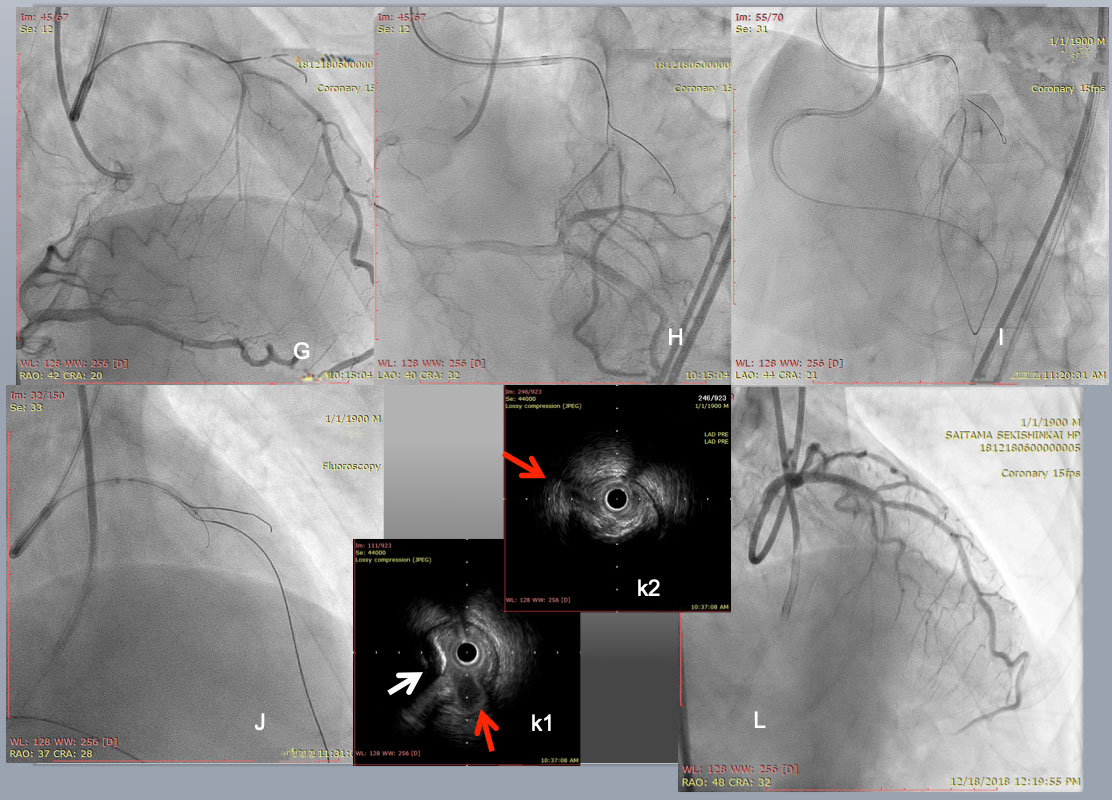
PCI started with an antegrade approach, using a dual lumen catheter Sasuke (Asahi Intecc) with a 1 st wire in the diagonal branch (G), but a 2nd CTO wire of Miracle Neo 3g (Asahi Intecc in A) and Gaia Next 2 (Asahi Intecc in B)failed to cross distally. Since subintimal dissection obscured the bifurcation beyond the CTO (I), Retrograde approach was attempted through a large epicardial collateral. After a combination of a Suoh 03 and a Caravel micro catheter(both Asahi Intecc) crossed the collateral (not shown), a retrograde Confianza Pro 12g succeeded in reverse CART (J). After successful guide wire externalization and 1.5 mm balloon dilation, IVUS revealed a septal branch and an eccentric calcified plaque (a red and a white arrow, respectively in k1), and a diagonal branch in k2. After further balloon dilation and DES deployment, a satisfactory final results obtained. The case demonstrated that the use of Co-registration system streamlined to change the crossing strategy one from the other, since CTA highlighted a major hindrance of wire crossing, ie, short but eccentric calcified plaques in CTO segment.
Case 6. Practical application of CCTA on heavily calcified, long, severely bent RCA CTO (Figure 26a, Figure 26b, Figure 26c, Figure 26d and Figure 26e).
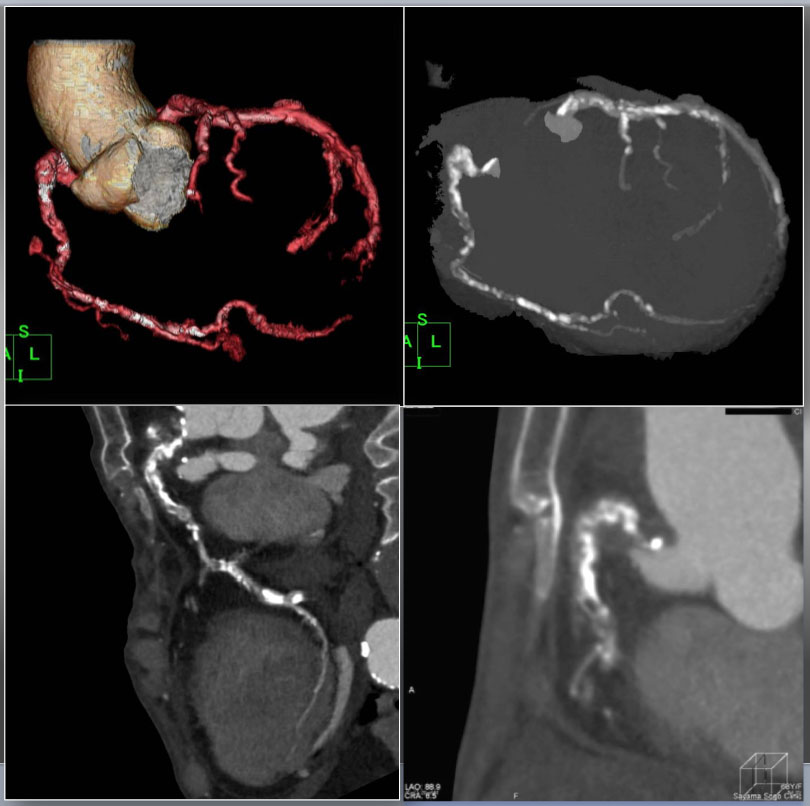
Case 6. Heavily calcified, long, severely bended RCA CTO on permanent hemodialysis patient CTA performed after diagnostic CAG for support of complex PCI. VR (upper left), Angiographic MIP (upper right), curved MPR (lower left), and slab MIP (lower right) for CTA guided optimization for reverse CART. VR and disclosed proximal tortuosity, heavy calcification, >90 degree bend inside the CTO in an angiographic view, and >20mm occlusion length in curved MPR image. Slab MIP revealed dense calcification alongside of the ascending limb and at the distal segment of “Shepherd’s crook” (Figure 4 C a).
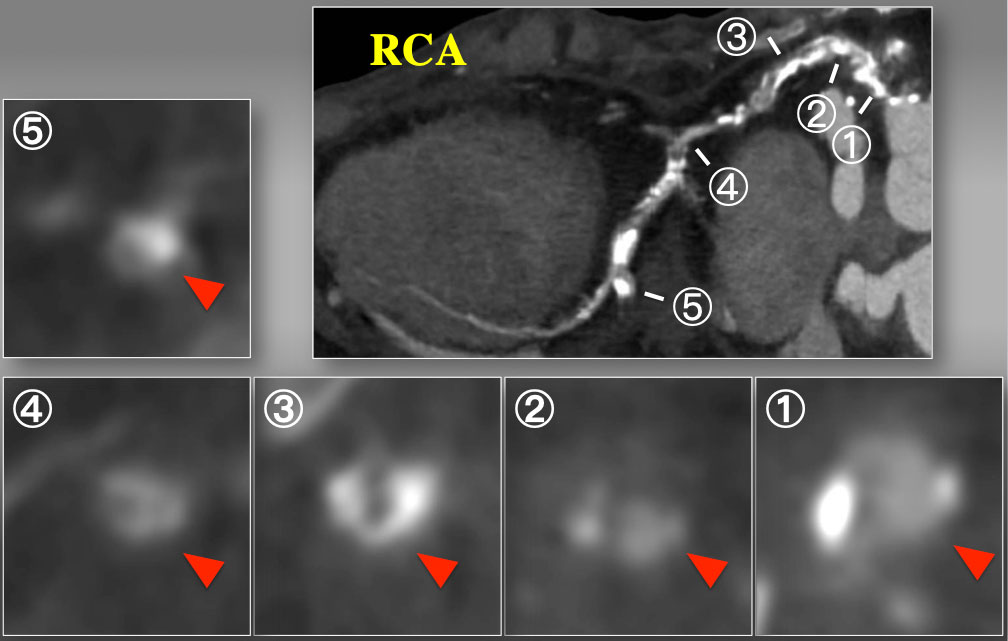
Short axial cross sections of CTO on curved MPR. Cross sectional images disclosed partial calcium at the ostium (1), non-calcified contrast-filled segment (2), horse-shoe shaped calcium (3), and non-calcified inhomogeneous segment (4), and a focal calcification at the level of side branch. Therefore, CTA indicated complex, calcified proximal to mid RCA CTO over the bend, but each cross section analyses suggested some non-calcified vascular space will be connected through a spiraling manner, especially inner curvature of the proximal segment.
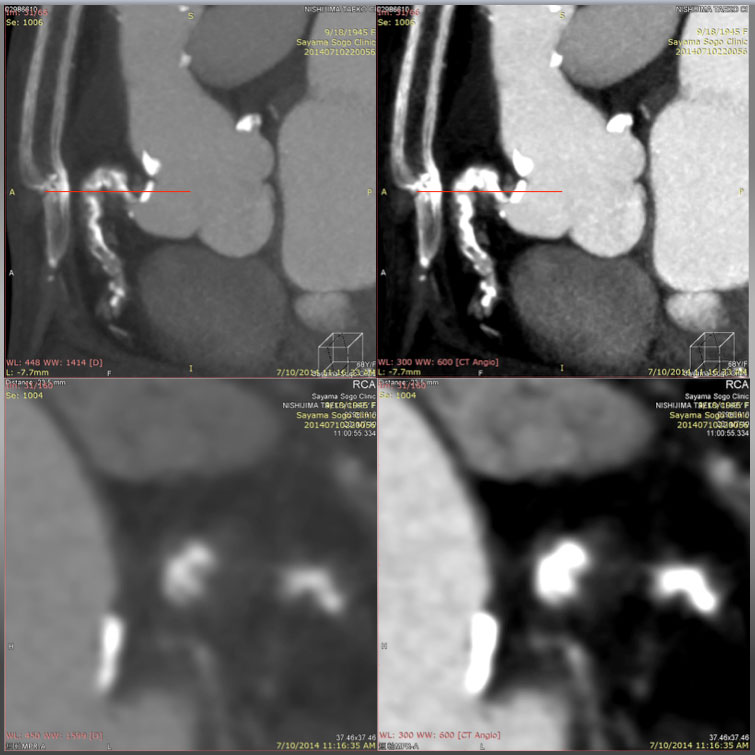
A Slab MIP (upper left) reveals Cross section over the ascending and descending limbs of “Shepherd’s crook” CTO on a window level (WL) 448 with a window width (WW) of 1414. Compared with the same cross section on a WL of 300 with a WW of 600 (upper right), the section on a wider width is in favor of avoiding overestimation of the calcified segments, and enabling one to recognize a non-calcified segment in more detail. Cross section of MPR (lower images, at the level of red line in the upper figures) could allow more detailed analysis of the vessel cross section on a wider WW (WL: 448, WW: 1414, lower left) than that of lower (WL: 300, WW: 600, lower right).
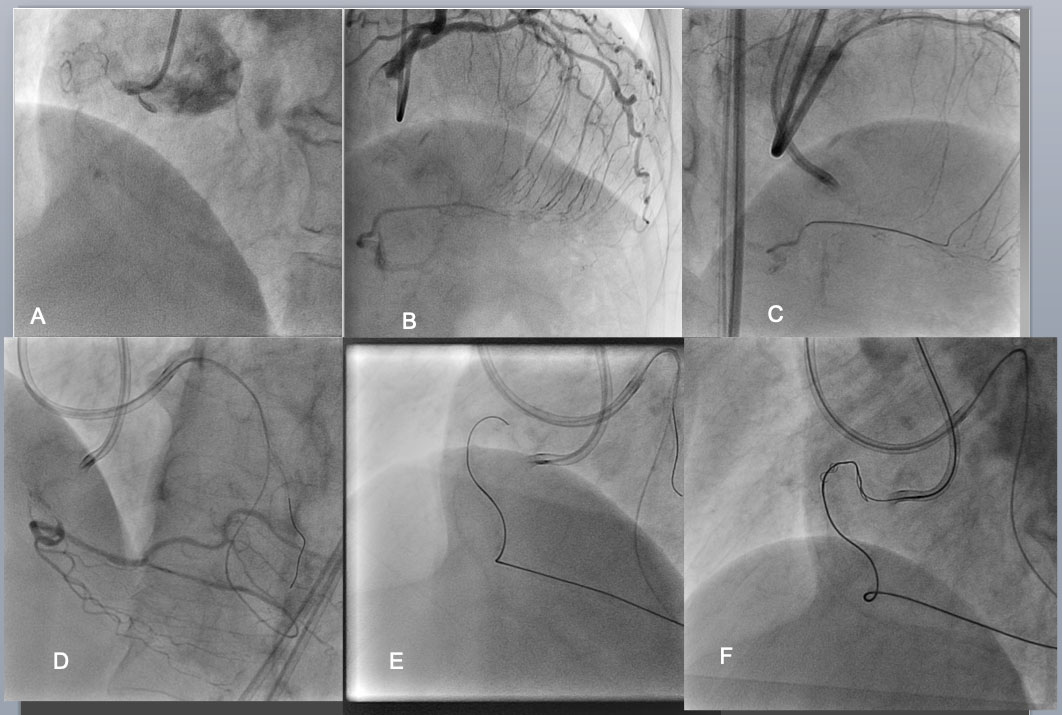
Bilateral angiography shows an RCA CTO is consisted of an eccentric proximal cap, poorly defined target vessel, >20mm length of occlusion, bending inside, calcification, and well developed interventional collaterals (of the septum) (J-CTO Score of 4)(A,B). Considering those negative factors, bilateral approach was employed as a strategy. After successful crossing of the septal collateral by a Sion black (C), selective injection through the microcatheter highlighted a vessel course to the distal CTO (D). The wire of Gaia 1 st and 2 nd (Asahi Intecc) was advanced over the arch of “Shepherd’s crook” retrogradely with a close support of Corsair micro catheter(E).
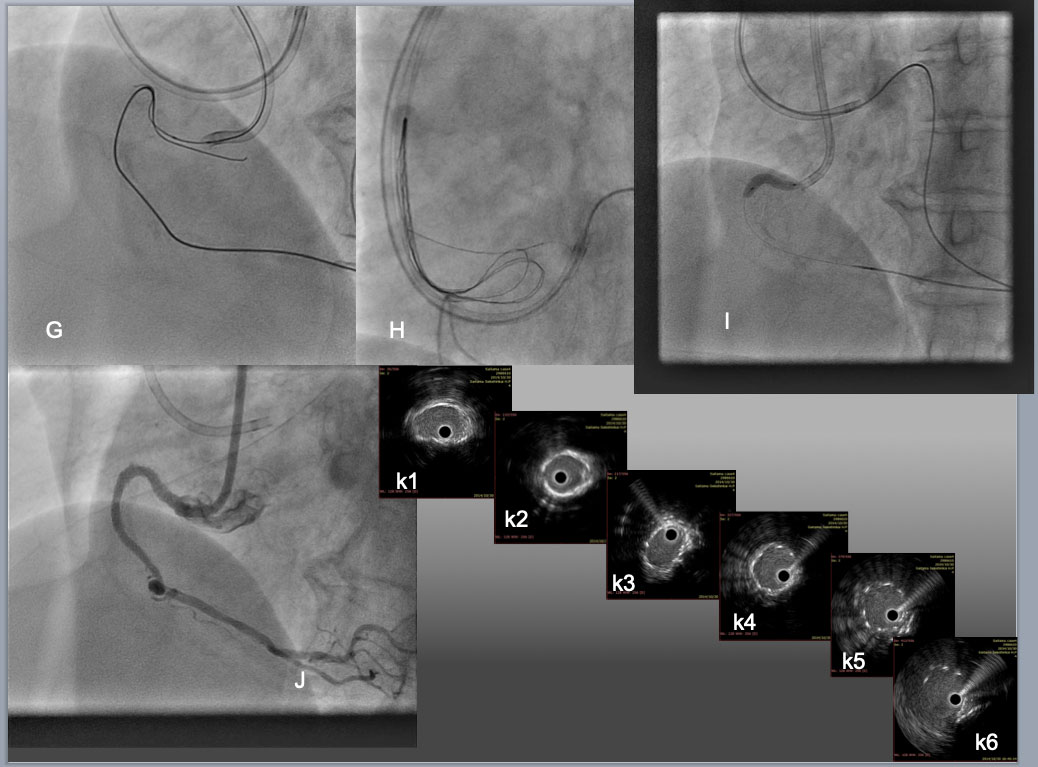
While an antegrade wire of Gaia 2 was advanced across the "arch", creating overlapping in the proximal segment of CTO(G), reverse CART was implemented by dilation of 2.5mm antegrade balloon, which allowed the retrograde wide to exit into the aorta, where the wire exchanged to an RG3 330cm after the Corsair advanced into Aorta. The tip of the RG3 was snared by a Triple-head EnSnare 27-45mm (Merit medical, USA) through an 8F JR4.0 SH Guide(H), which enabled the catheter to engage an RCA ostium firmly by pulling the snare-wire through the guide and antegrade balloon dilation (I). Final result was obtained after 3 DES deployments over assistance of 7F Guide liner (Teleflex) and high pressure dilation of 3.0 mm NC balloon and 3.5 mm in the distal to the proximal, respectively. IVUS pull back confirmed satisfactory stent expansion and apposition over the calcified bending segments (from middle RCA (k1) to bending(k3-k4), proximal(k5), and ostium (k6)).
As in any other medical procedure, understanding the procedural process is the first step of developing and acquiring the skill sets of complex PCI.
IVUS and CCTA are the ideal invasive and non-invasive tools, respectively, to define the anatomical key factors of CTO coronary intervention and navigate to choose the most appropriate next step. Although there is a lack of evidence to support their efficacy of scientific data and wide differences in clinical availability and device coverage in insurance, repeated application on various clinical setting can provide the operators to sharpen the skill-set of CTO-PCI and to enhance the procedural success rate without increasing risk of complications. The authors are of utmost pleasure when the chapter contributes further interest to all the doctors learning and practicing CTO-PCI.
Timely use of IVUS on CTO-PCI can not only inform the vessel anatomy (proximal cap, reference vessel diameter, wire position in IP or SIS, dissection, and hematoma extension), but also help to choose the next step safely (ADR, IVUS-navigated Re-entry, and reverse CART), enhancing the success rate and long-term durability(stent optimization after successful balloon dilation).
CCTA has the superior modality in detailing the calcification and vessel tortuosity, two of the major hindrance of contemporary PCI.
With a judicious application of imaging modalities and recent technological developments, we can further achieve the steady rise of procedural success rate without risking the patients.