Echocardiographic, Fluoroscopic and CT guidance for transcatheter structural and coronary interventions
Updated on November 17, 2023 | 48 minutes reading
McGill University Health Center, Glen Hospital, Department of Medicine, Division of Cardiology, Montreal, Quebec, McGill University Health Center, Glen Hospital, Department of Medicine, Division of Cardiology, Montreal, Quebec, McGill University Health Center, Glen Hospital, Department of Medicine, Division of Cardiology, Montreal, Quebec, McGill University Health Center, Glen Hospital, Department of Medicine, Division of Cardiology, Montreal, Quebec, McGill University Health Center, Glen Hospital, Department of Medicine, Division of Cardiology, Montreal, Quebec, McGill University Health Center, Glen Hospital, Department of Medicine, Division of Cardiology, Montreal, Quebec, McGill University Health Center, Glen Hospital, Department of Medicine, Division of Cardiology, Montreal, Quebec, Department of Cardiology, Jewish General Hospital, McGill University, Montreal, Quebec, Canada, Department of Cardiology, Rigshospitalet University Hospital, Copenhagen, Denmark, Department of Cardiology, Rigshospitalet University Hospital, Copenhagen, Denmark, Department of Medicine (Cardiology and Nuclear Medicine) and Radiology, University of Ottawa Heart Institute, Otawa, Ontario, Canada, Tel-Aviv Medical Center, Tel-Aviv University, Tel-Aviv, Israel, McGill University Health Center, Glen Hospital, Department of Medicine, Division of Cardiology, Montreal, Quebec
To Michele - “Your image will never be forgotten” Nicolo Piazza
Summary
The patient selection and procedural planning for transcatheter structural interventions have been facilitated by the extensive use of multislice computed tomography (MSCT) multiplanar reconstruction. This imaging technique allows the identification of the optimal fluoroscopic viewing angles of left- and right-sided heart structures, in particular the aortic, mitral and tricuspid valve complexes. The use of standardized fluoroscopic viewing angles, during transcatheter interventions, can be extremely helpful in technically challenging scenarios (e.g., bifurcation stenting, aortic, mitral and tricuspid valve interventions). The continuous refinement of transcatheter procedural techniques and the emergence of novel transcatheter devices challenge our understanding and applicability of multimodality imagining. Mastering multimodality imaging of the heart chamber anatomy can reduce the procedural time, radiation dose, contrast volume, and complications during transcatheter coronary and structural interventions while providing guidance for the operators. In this chapter we aim to describe the anatomy of the heart with respect to structural interventions and coronary arteries by integrating MSCT, fluoroscopy and echocardiography. By doing so, we also describe the utility of optimal fluoroscopic viewing angles in guiding structural and coronary interventions.
Introduction
Traditionally, percutaneous coronary interventions (PCI) are performed using well-recognized anatomical patterns based on familiar fluoroscopic viewing angles. Coronary angiography has indeed an excellent resolution, but its two-dimensional (2D) nature inherently limits its diagnostic accuracy due to foreshortening and overlap of structures 1. Di Mario C, Sutaria N. Coronary angiography in the angioplasty era: projections with a meaning. Heart. 2005 Jul;91(7):968–76. Link. Since the introduction of transcatheter structural heart therapies, cardiologists have become increasingly aware of the importance of understanding the anatomical details of cardiac structures under fluoroscopy 2. Van Mieghem NM, Piazza N, Anderson RH, Tzikas A, Nieman K, De Laat LE, McGhie JS, Geleijnse ML, Feldman T, Serruys PW, de Jaegere PP. Anatomy of the mitral valvular complex and its implications for transcatheter interventions for mitral regurgitation. J Am Coll Cardiol. 2010 Aug;56(8):617–26. Link. Many critical anatomical structures comprise several spatial components arranged in a complex three-dimensional (3D) geometry. Even though these anatomical and functional components have been the topic of numerous publications 2. Van Mieghem NM, Piazza N, Anderson RH, Tzikas A, Nieman K, De Laat LE, McGhie JS, Geleijnse ML, Feldman T, Serruys PW, de Jaegere PP. Anatomy of the mitral valvular complex and its implications for transcatheter interventions for mitral regurgitation. J Am Coll Cardiol. 2010 Aug;56(8):617–26. Link, little consideration has been given to understanding their configuration as appreciated under fluoroscopy 3. Cosío FG, Anderson RH, Kuck KH, Becker A, Borggrefe M, Campbell RW, Gaita F, Guiraudon GM, Haïssaguerre M, Rufilanchas JJ, Thiene G, Wellens HJ, Langberg J, Benditt DG, Bharati S, Klein G, Marchlinski F, Saksena S. Living anatomy of the atrioventricular junctions. A guide to electrophysiologic mapping. A Consensus Statement from the Cardiac Nomenclature Study Group, Working Group of Arrhythmias, European Society of Cardiology, and the Task Force on Cardiac Nomenclature from NASPE. Circulation. 1999 Aug;100(5):e31-7. Link. Understanding fluoroscopic cardiac anatomy can facilitate optimal positioning and deployment of prostheses during transcatheter valve repair/replacement, left atrial appendage occlusion, septal defect closure, paravalvular leak closure. Commonly, these therapies are conducted using standard fluoroscopic angulations irrespective of variations in anatomy. However, it is possible that patient-specific fluoroscopic viewing angles can improve procedural safety and efficacy.
Interestingly, the common chamber views appreciated on echocardiography can be appreciated across imaging modalities, including fluoroscopy, thereby providing the basis for a common language (i.e. imaging modality independent). Furthermore, optimal projection curves (i.e. S-curves) that provide fluoroscopic viewing angles of a structure in-plane or en-face can be interrelated with fluoroscopic chamber views. Understanding the relationship between chamber views and optimal projection curves is the fundamental principle in mastering “fluoroscopic anatomy” , , 4. Thériault-Lauzier P, Andalib A, Martucci G, Mylotte D, Cecere R, Lange R, Tchétché D, Modine T, van Mieghem N, Windecker S, Buithieu J, Piazza N. Fluoroscopic anatomy of left-sided heart structures for transcatheter interventions: insight from multislice computed tomography. JACC Cardiovasc Interv. 2014 Sep;7(9):947–57. Link5. Pighi M, Thériault-Lauzier P, Alosaimi H, Spaziano M, Martucci G, Xiong TY, Buithieu J, Ybarra LF, Afilalo J, Leipsic J, Ozden Tok O, Mousavi N, Mangiameli A, Pilgrim T, Praz F, Windecker S, Piazza N. Fluoroscopic Anatomy of Right-Sided Heart Structures for Transcatheter Interventions. JACC Cardiovasc Interv. 2018 Aug;11(16):1614–25. Link6. Spaziano M, Thériault-Lauzier P, Meti N, Vaquerizo B, Blanke P, Deli-Hussein J, Chetrit M, Galatos C, Buithieu J, Lange R, Martucci G, Leipsic J, Piazza N. Optimal fluoroscopic viewing angles of left-sided heart structures in patients with aortic stenosis and mitral regurgitation based on multislice computed tomography. J Cardiovasc Comput Tomogr. 2016;10(2):162–72. Link.
MSCT multiplanar reconstruction of the aortic valvular complex has enhanced patient selection and procedural planning for transcatheter aortic valve implantation 7. Schultz C, Moelker A, Tzikas A, Piazza N, de Feyter P, van Geuns RJ, Serruys PW, Krestin GP, de Jaegere P. The use of MSCT for the evaluation of the aortic root before transcutaneous aortic valve implantation: the Rotterdam approach. EuroIntervention J Eur Collab with Work Gr Interv Cardiol Eur Soc Cardiol. 2010 Sep;6(4):505–11. Link. For example, MSCT affords physicians the opportunity to pre-select optimal x-ray fluoroscopic viewing angles for deployment of the valve prosthesis , 8. Gurvitch R, Wood DA, Leipsic J, Tay E, Johnson M, Ye J, Nietlispach F, Wijesinghe N, Cheung A, Webb JG. Multislice computed tomography for prediction of optimal angiographic deployment projections during transcatheter aortic valve implantation. JACC Cardiovasc Interv. 2010 Nov;3(11):1157–65. Link9. Dvir D, Kornowski R. Percutaneous aortic valve implantation using novel imaging guidance. Catheter Cardiovasc Interv Off J Soc Card Angiogr Interv. 2010 Sep;76(3):450–4 Link. Such angle optimization may decrease procedure time, radiation exposure, and injected contrast agent volume 10. Samim M, Stella PR, Agostoni P, Kluin J, Ramjankhan F, Budde RPJ, Sieswerda G, Algeri E, van Belle C, Elkalioubie A, Juthier F, Belkacemi A, Bertrand ME, Doevendans PA, Van Belle E. Automated 3D analysis of pre-procedural MDCT to predict annulus plane angulation and C-arm positioning: benefit on procedural outcome in patients referred for TAVR. JACC Cardiovasc Imaging. 2013 Feb;6(2):238–48 Link. It may reduce the risk of acute kidney injury 10. Samim M, Stella PR, Agostoni P, Kluin J, Ramjankhan F, Budde RPJ, Sieswerda G, Algeri E, van Belle C, Elkalioubie A, Juthier F, Belkacemi A, Bertrand ME, Doevendans PA, Van Belle E. Automated 3D analysis of pre-procedural MDCT to predict annulus plane angulation and C-arm positioning: benefit on procedural outcome in patients referred for TAVR. JACC Cardiovasc Imaging. 2013 Feb;6(2):238–48 Link and paravalvular regurgitation 11. Poon KK, Crowhurst J, James C, Campbell D, Roper D, Chan J, Incani A, Clarke A, Tesar P, Aroney C, Raffel OC, Walters DL. Impact of optimising fluoroscopic implant angles on paravalvular regurgitation in transcatheter aortic valve replacements - utility of three-dimensional rotational angiography. EuroIntervention J Eur Collab with Work Gr Interv Cardiol Eur Soc Cardiol. 2012 Sep;8(5):538–45 Link, conduction disturbances or valve embolization. The same principles can be applied for planning any fluoroscopy-guided procedure, including coronary interventions.
The goal of this chapter is to provide knowledge regarding 1- the fluoroscopic chamber views of the right and left heart 2- the optimal projection curves of the various cardiac structures (i.e. aortic, mitral and tricuspid valves, atrial septum, left atrial appendage, left and right coronary ostia 3- integration of this knowledge toward transcatheter structural heart interventions and percutaneous coronary interventions.
Bridging between cardiac imaging modalities: in search for a common language
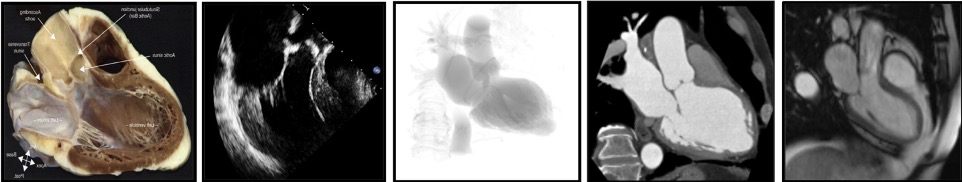
The use of a particular terminology to describe the heart impacts the way physicians describe the structures of the heart. Distinct anatomical terminologies are used by imagers using different imaging modalities. These dissimilarities are often experienced as a major obstacle during procedural planning and realization. For instance, the mid-esophageal mitral bicommissural view on transeophageal echocardiography, the horizontal long-axis view on nuclear cardiac imaging and the right anterior oblique (RAO)/cranial (CRA) projection on fluoroscopy all depict a two-chamber view of the left heart. In fact, the way the heart appears is a matter of viewing angle rather than imaging modality. A three-chamber view of the left heart, showing the left atrium, left ventricle and left ventricular outflow tract (LVOT)/aorta, can be obtained from an anatomical preparation of the heart as well as by echocardiography, fluoroscopy, MSCT or magnetic resonance imaging as long as the heart is considered from a similar angle (Figure 1). The use of a common “anatomy-centric” terminology, rather than “modality-centric” terminology, is thus mandatory to bridge the gaps across imaging techniques. The following principles may pave the way to a common multimodality terminology that will allow for easier and more efficient interaction between imagers and operators in the catheterization laboratory.
Figure 1
The way the heart appears is a matter of viewing angle rather than imaging modality. Three chamber view of the left heart viewed on (left to right) an anatomical preparation, echocardiography, fluoroscopy, MSCT and MRI.
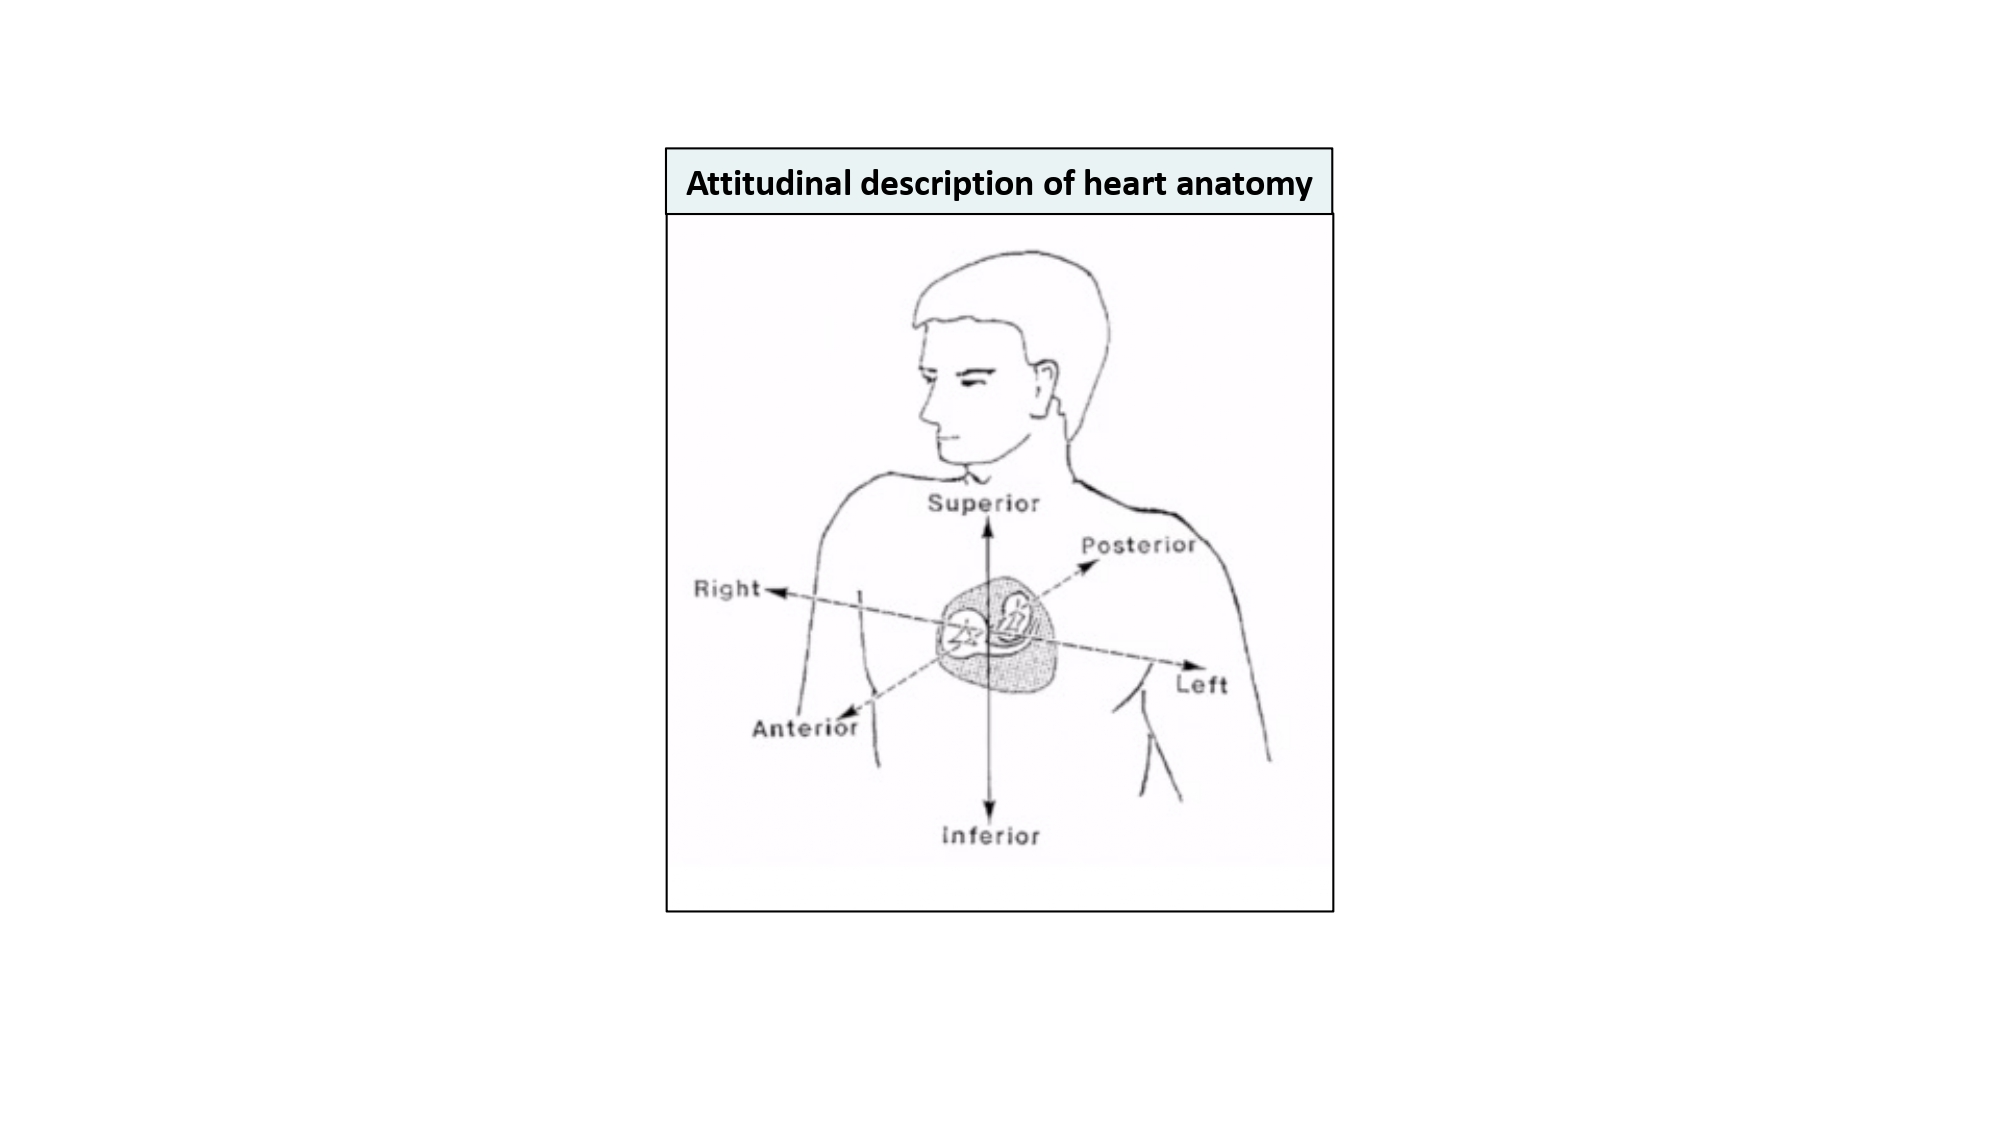
In our discussion, structures will be termed according to their attitudinally correct anatomical position 12. Anderson RH, Loukas M. The importance of attitudinally appropriate description of cardiac anatomy. Clin Anat. 2009 Jan;22(1):47–51. Link. This implies that the subject is facing the observer and standing upright. Thus, structures closer to the observer are described as being anterior and those relatively farther away within the body are posterior. Components lying closer to the head are superior (i.e., CRA) and those toward the feet are said to be inferior (i.e., caudal [CAU]). Structures to the left-hand side of the observer are right-sided and those to the observer’s right are left-sided (Figure 2).
Figure 2
Attitudinal description of heart anatomy. structures should be termed according to their attitudinally correct anatomical position. structures closer to the observer are described as being anterior and those relatively farther away within the body are posterior. Components lying closer to the head are superior and those toward the feet are said to be inferior. Structures to the left-hand side of the observer are right-sided and those to the observer’s right are left-sided.
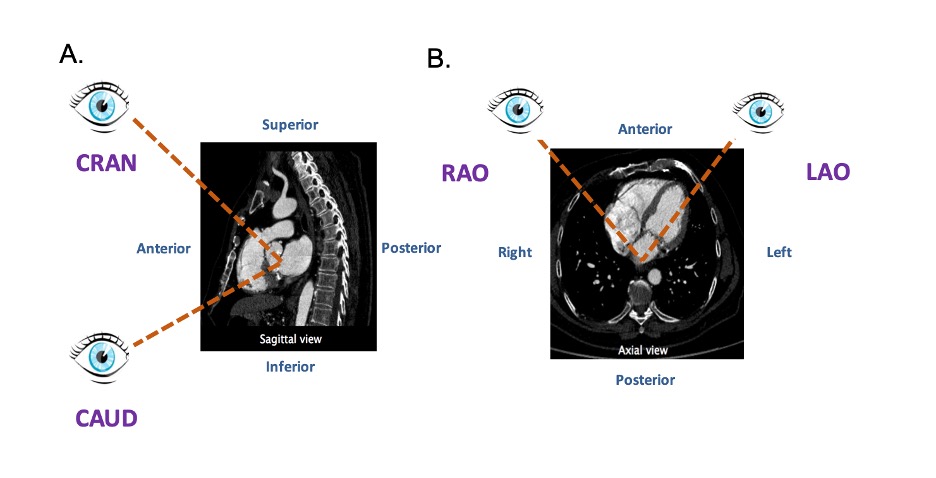
The fluoroscopic screen portrays the thorax in an upright orientation despite the patient being in a supine position. Superior and inferior structures are appreciated in the upper and lower halves of the screen. The direction of fluoroscopic projections is described based on 2 conventional angles, CRA CAU and left anterior oblique (LAO) RAO (Figure 3 A and 3 B). In the anteroposterior viewing angle (CRA CAU 0, LAO RAO 0), right- and left-sided structures are found on the left and right sides of the screen, respectively. Of note, discussing heart structures in their attitudinal position is in perfect agreement with nomenclatures used for MSCT, x-ray fluoroscopic imaging and magnetic resonance imaging (Figure 4); this is not necessarily true with echocardiography.
Figure 3
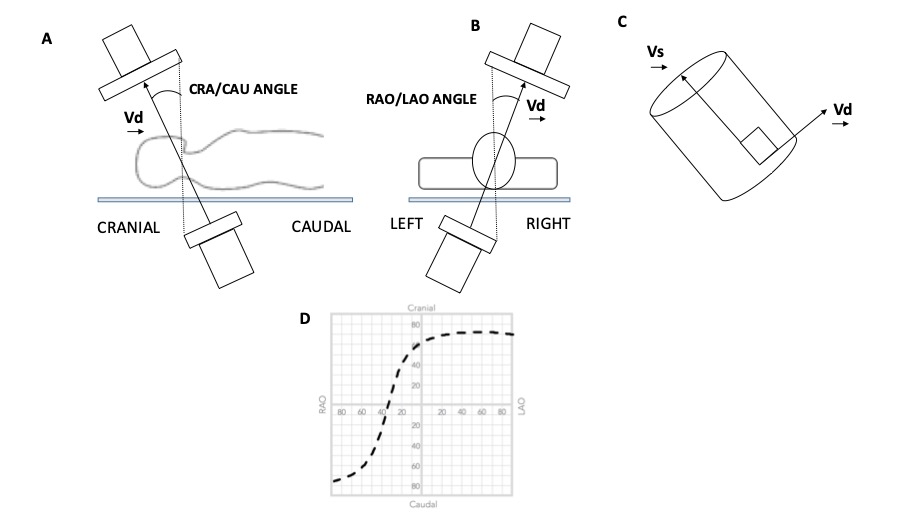
Geometry of the Optimal Projection Curve. The vector joining the x-ray source and the center point of the detector is designated Vd, and the vector pointing along a structure of interest is Vs. (A and B) The angular system (cranial [CRA]/caudal [CAU] and right anterior oblique [RAO]/left anterior oblique [LAO] angles) used in fluoroscopy is described. (C) All vectors Vd perpendicular to vector vs are optimal viewing angles. The optimal projection curve is the plot of the fluoroscopic angles of all vectors Vd for a particular structure of interest. (D) A typical S-shaped optimal projection curve for a given cardiac structure is shown.
Attitudinal viewing of MSCT image simulating the C-arm rotation around a lying patient in the catheterization laboratory. (A) Sagittal view: from an anterior position structure closer to the head are labelled as cranial (CRA) and those closer to the feet are labelled as caudal (CAU). (B) Axial view: from an anterior position structure closer to the right of the patients are labelled as right anterior oblique (RAO) and those closer to the left are labelled as left anterior oblique (LAO).
Fluoroscopy is used to guide the vast majority of transcatheter cardiac procedures. Inherently, it is a 2D imaging modality that requires the user to select a viewing angle that provides accurate information on device positioning. For a particular structure, an optimal viewing angle should minimize positioning errors due to parallax. The goal of many transcatheter procedures -such as valve implantation, left atrial appendage occlusion, septal defect closure, and paravalvular leak occlusion- is to implant a quasi-cylindrical device inside a highly variable anatomical structure. The fluoroscopic projection that minimizes parallax during deployment is such that the source-to-detector direction is orthogonal to the axis of symmetry of the anatomical feature of interest (Figure 3C). Based on this criterion, it is possible to determine an optimal CRA CAU angle for any given LAO RAO angle. The plot of the optimal combinations is called the optimal projection curve , , , , 8. Gurvitch R, Wood DA, Leipsic J, Tay E, Johnson M, Ye J, Nietlispach F, Wijesinghe N, Cheung A, Webb JG. Multislice computed tomography for prediction of optimal angiographic deployment projections during transcatheter aortic valve implantation. JACC Cardiovasc Interv. 2010 Nov;3(11):1157–65. Link10. Samim M, Stella PR, Agostoni P, Kluin J, Ramjankhan F, Budde RPJ, Sieswerda G, Algeri E, van Belle C, Elkalioubie A, Juthier F, Belkacemi A, Bertrand ME, Doevendans PA, Van Belle E. Automated 3D analysis of pre-procedural MDCT to predict annulus plane angulation and C-arm positioning: benefit on procedural outcome in patients referred for TAVR. JACC Cardiovasc Imaging. 2013 Feb;6(2):238–48 Link13. Tzikas A, Schultz C, Van Mieghem NM, de Jaegere PPT, Serruys PW. Optimal projection estimation for transcatheter aortic valve implantation based on contrast-aortography: validation of a Prototype Software. Catheter Cardiovasc Interv Off J Soc Card Angiogr Interv. 2010 Oct;76(4):602–7 Link14. Binder RK, Leipsic J, Wood D, Moore T, Toggweiler S, Willson A, Gurvitch R, Freeman M, Webb JG. Prediction of optimal deployment projection for transcatheter aortic valve replacement: angiographic 3-dimensional reconstruction of the aortic root versus multidetector computed tomography. Circ Cardiovasc Interv. 2012 Apr;5(2):247–52. Link15. Arnold M, Achenbach S, Pfeiffer I, Ensminger S, Marwan M, Einhaus F, Pflederer T, Ropers D, Schuhbaeck A, Anders K, Lell M, Uder M, Ludwig J, Weyand M, Daniel WG, Feyrer R. A method to determine suitable fluoroscopic projections for transcatheter aortic valve implantation by computed tomography. J Cardiovasc Comput Tomogr. 2012;6(6):422–8 Link.
In addition to parallax errors, optimal viewing angles should minimize the overlap of anatomic structures, a problem that also stems from the 2D nature of fluoroscopy. In the context of transcatheter interventions, some cardiac structures must be accurately located to correctly implant devices. The overlap of a highly attenuating anatomical structures within the region of implantation may negatively influence the contrast-to-noise ratio and compromise visualization. Therefore, it becomes critical to appreciate the fluoroscopic views that provide maximal separation between structures of interest. This understanding can be obtained from MSCT which depicts cardiac structures with relatively high soft-tissue contrast, as well as high temporal and spatial resolution.
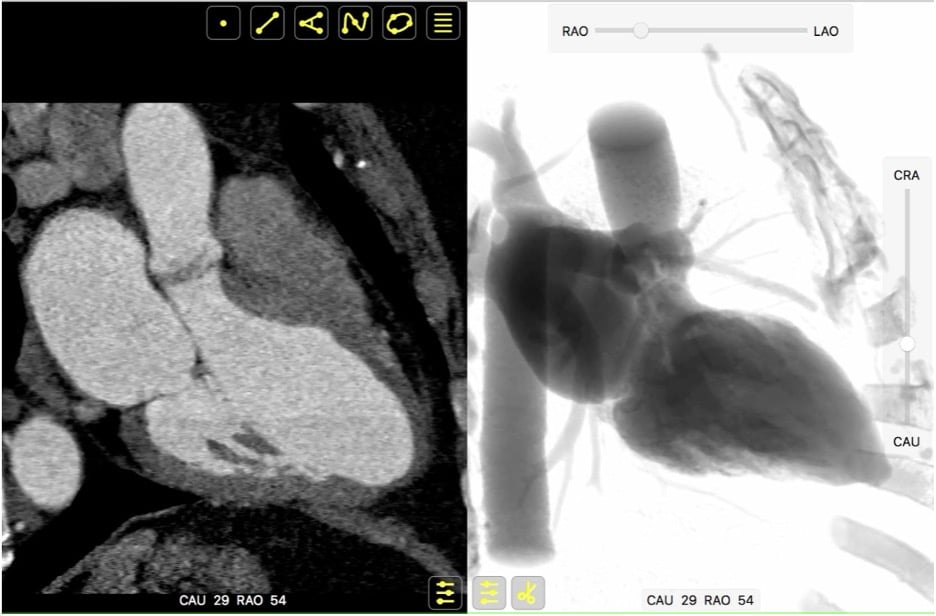
MSCT records a 3D volume dataset of the heart and can accurately determine the attitudinal position of cardiac structures in the body (Figure 3D). Consequently, the MSCT volumetric dataset can help create an optimal projection curve describing the orthogonal orientation of any cardiac structure. Given that fluoroscopy and MSCT share a common image contrast mechanism, i.e., x-ray attenuation, it is possible to use MSCT volumetric data to simulate fluoroscopic images. A ray-casting method based on this principle will be used to generate the fluoroscopic images presented in this chapter to demonstrate how MSCT may provide optimal fluoroscopic viewing angles for heart structures (Figure 5). It is important to note that while fluoroscopic angulations of heart structures are dependent on the general orientation of the heart within the thorax , , , , 8. Gurvitch R, Wood DA, Leipsic J, Tay E, Johnson M, Ye J, Nietlispach F, Wijesinghe N, Cheung A, Webb JG. Multislice computed tomography for prediction of optimal angiographic deployment projections during transcatheter aortic valve implantation. JACC Cardiovasc Interv. 2010 Nov;3(11):1157–65. Link10. Samim M, Stella PR, Agostoni P, Kluin J, Ramjankhan F, Budde RPJ, Sieswerda G, Algeri E, van Belle C, Elkalioubie A, Juthier F, Belkacemi A, Bertrand ME, Doevendans PA, Van Belle E. Automated 3D analysis of pre-procedural MDCT to predict annulus plane angulation and C-arm positioning: benefit on procedural outcome in patients referred for TAVR. JACC Cardiovasc Imaging. 2013 Feb;6(2):238–48 Link13. Tzikas A, Schultz C, Van Mieghem NM, de Jaegere PPT, Serruys PW. Optimal projection estimation for transcatheter aortic valve implantation based on contrast-aortography: validation of a Prototype Software. Catheter Cardiovasc Interv Off J Soc Card Angiogr Interv. 2010 Oct;76(4):602–7 Link14. Binder RK, Leipsic J, Wood D, Moore T, Toggweiler S, Willson A, Gurvitch R, Freeman M, Webb JG. Prediction of optimal deployment projection for transcatheter aortic valve replacement: angiographic 3-dimensional reconstruction of the aortic root versus multidetector computed tomography. Circ Cardiovasc Interv. 2012 Apr;5(2):247–52. Link15. Arnold M, Achenbach S, Pfeiffer I, Ensminger S, Marwan M, Einhaus F, Pflederer T, Ropers D, Schuhbaeck A, Anders K, Lell M, Uder M, Ludwig J, Weyand M, Daniel WG, Feyrer R. A method to determine suitable fluoroscopic projections for transcatheter aortic valve implantation by computed tomography. J Cardiovasc Comput Tomogr. 2012;6(6):422–8 Link, exact angulations may be determined for a specific patient prior to an intervention. Measurement of fluoroscopic angulation from MSCT data can be done with visualization software packages that offer double-oblique multiplanar reconstruction; the exact CRA CAU and RAO LAO angulations for a particular structure can be obtained by analyzing the oblique sagittal and oblique transverse views, respectively.
Figure 5
Integration of multimodality imaging data. Both MSCT and fluoroscopy hinge on the same image contrast mechanism, X-ray attenuation. It is thus possible to apply MSCT volumetric data to simulate fluoroscopic images, using a ray-casting method. This feature permits parallel registration and rotation of MSCT and fluoroscopy images using a virtual C-arm analogous to that used in the catheterization laboratory.
Heart chamber views as multimodality reference patterns
Recognition of heart chamber views is well established in echocardiography. The radiolucency of cardiac structures projected by fluoroscopy has accustomed interventional cardiologists to specific patterns of contrast-enhanced chambers and arteries while overlooking the global 3D cardiac structure. We can translate anatomical information and patterns across imaging modalities using classical echocardiographic chamber views as a foundation. In addition to providing the basis for a common language, “fusing imaging modalities in the mind” through chamber views can take advantage of the temporal/spatial resolution of the various imaging modalities. Figure 1 demonstrates a three-chamber view of the heart by echocardiography, fluoroscopy, MSCT and magnetic resonance imaging. Given that the relative orientation of cardiac structures is constant within a given chamber view, knowledge transfer is possible across imaging modalities.
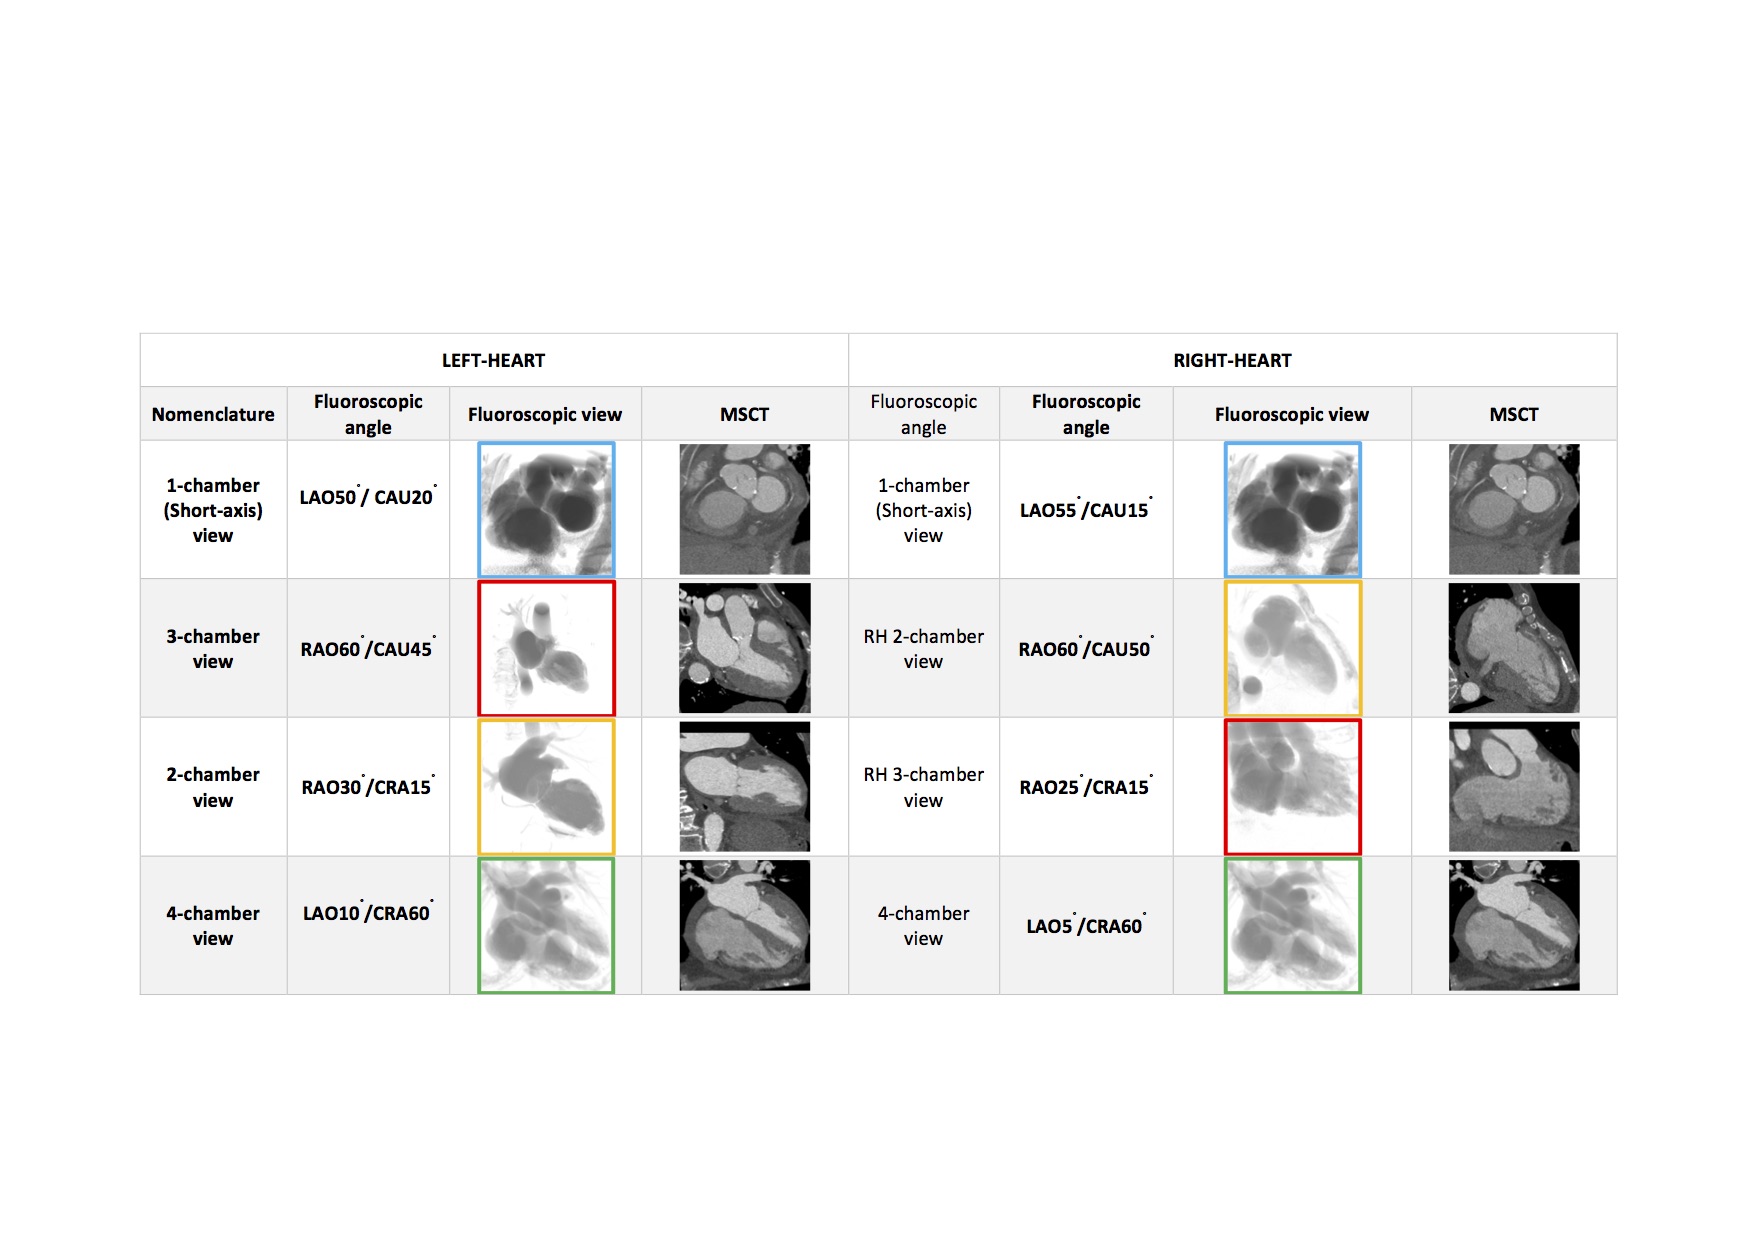
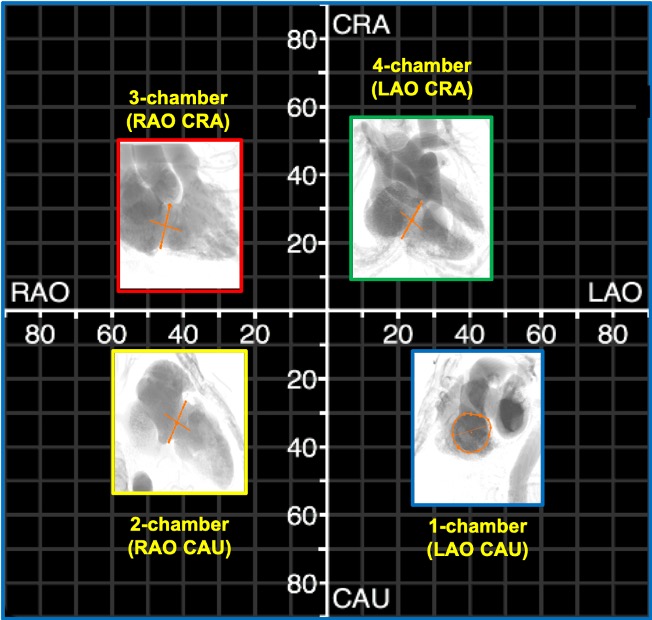
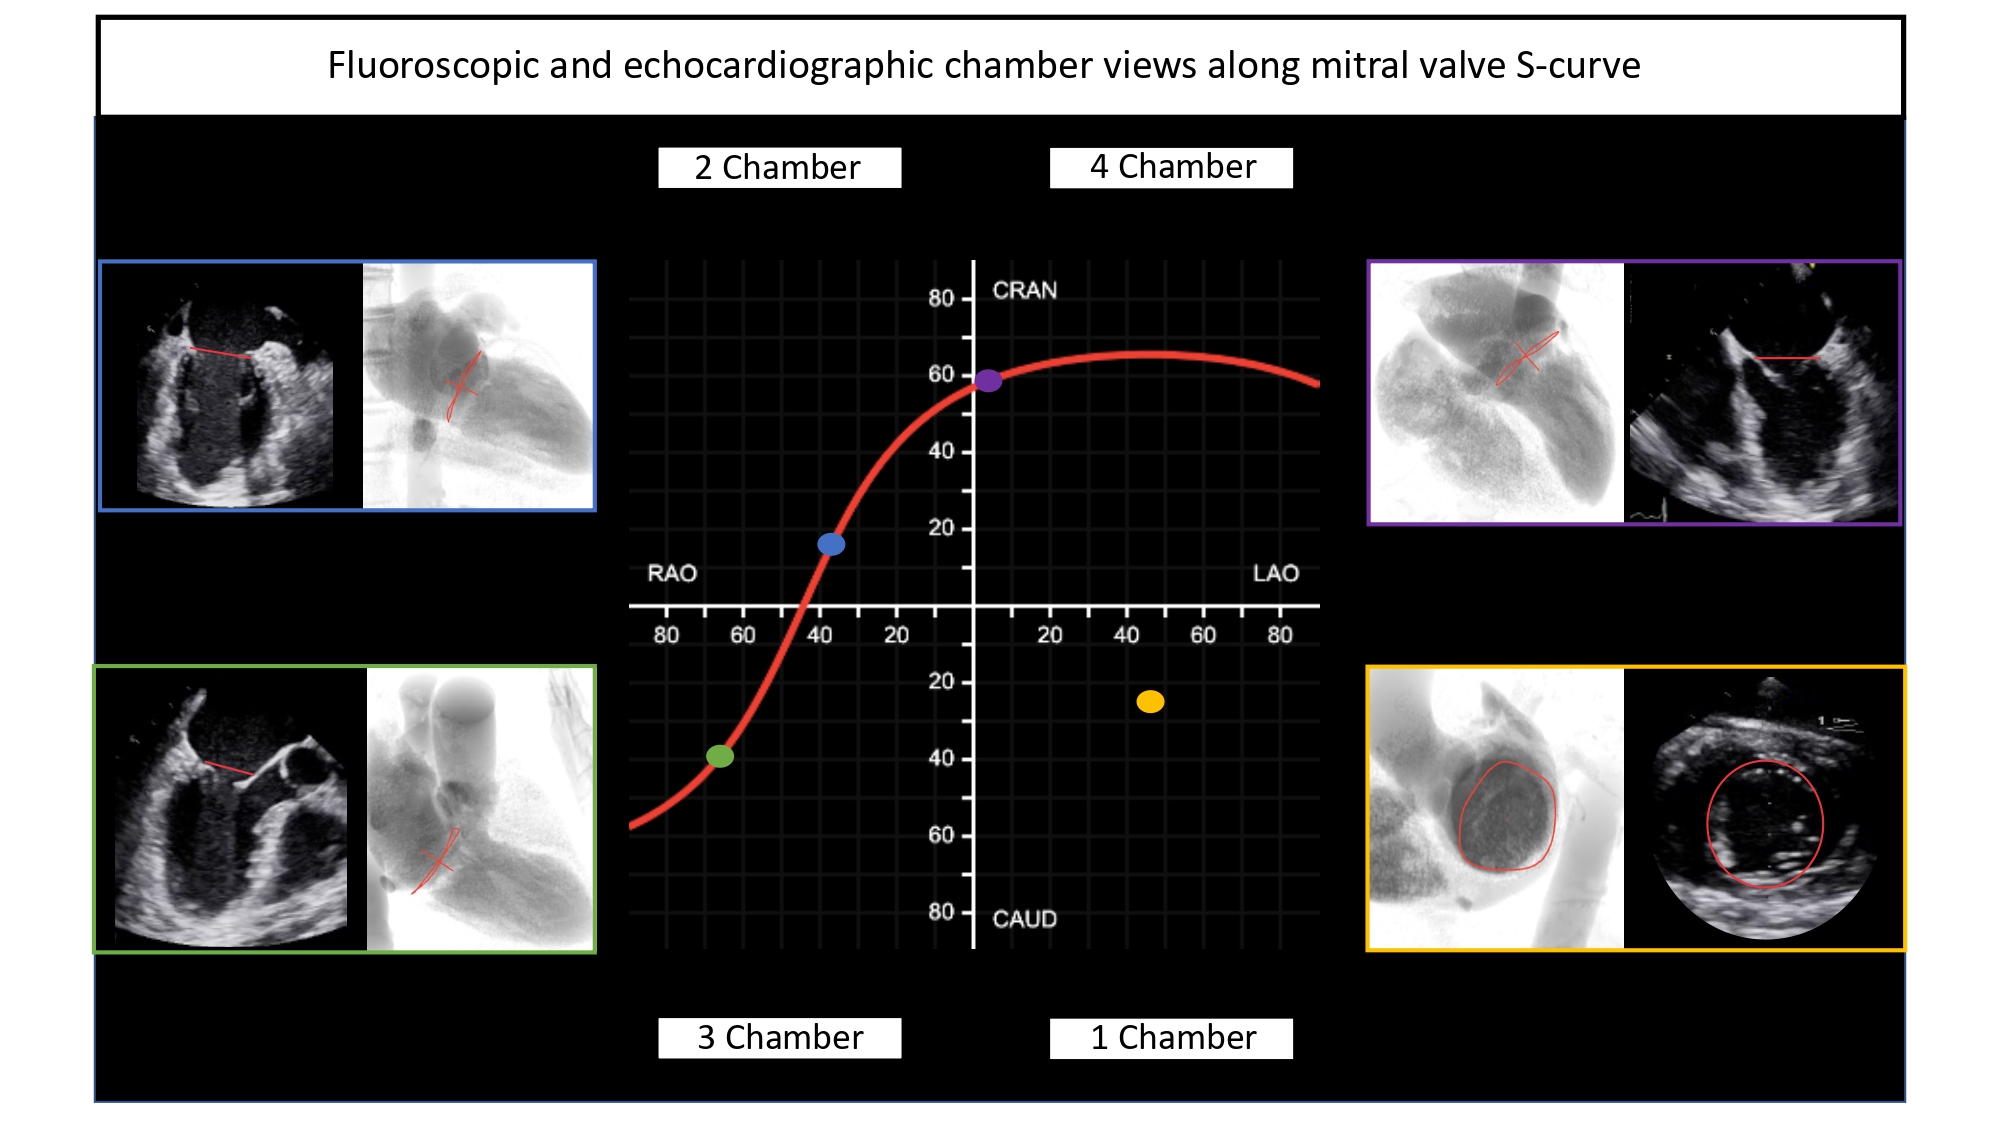
Simulated fluoroscopic chamber views of the right and left heart can be generated from MSCT volumetric data (Figure 6). In summary, the left heart chamber views are as follows: 1-chamber view in LAO CAU, 2-chamber in shallow RAO CRA, 3-chamber in steep RAO CAU, and 4-chamber in LAO/RAO extreme CRA views. The location of the 1- and 4-chamber views of the right heart are similar to those of the left, while the location of the right heart 2- and 3-chamber views are interchanged i.e., 3-chamber in shallow RAO CRA and 2-chamber in steep RAO CAU. It is for this reason that the echocardiographer can easily transition from a 2-chamber view of the right heart to a 3-chamber view of the left heart by simply angulating the ultrasound beams more posteriorly. “Blending” of chamber views (e.g., a hybrid between 1 and 2-chamber views) can occur while transitioning across the fluoroscopic grid. Of note, additional views of the left and right heart such as the short-axis of the aortic valve and bicaval views can be achieved in extreme RAO CRAN and LAO CAU views, respectively.
Figure 6
Fluoroscopic chamber views and corresponding multislice computed tomography imaging of the left- and right heart. Throughout the chapter, chamber views are color-coded: 1-chamber (blue); 2-chamber (yellow); 3-chamber (red); 4-chamber (green), when not stated otherwise. Abbreviations: CAU = caudal; CRA = cranial; LAO = left anterior oblique; MSCT = multislice computed tomography; RH = right heart.
While MSCT can generate 3D cross-sectional images or slabs of variable millimeter thickness, the fluoroscopic image is a 2D summation of cardiac structures depending on the angle of projection. Each left/right fluoroscopic chamber view can be characterized by specific anatomical structures that appear in perpendicular or en-face projections and allows the operator to begin the process of pattern recognition that will be described in the ensuing paragraphs.
The fluoroscopic left heart
The regions of fluoroscopic angulations corresponding to each of the chamber views and the specific structures of interest of the left heart are shown in Figure 7 and Figure 8, respectively.
Figure 7
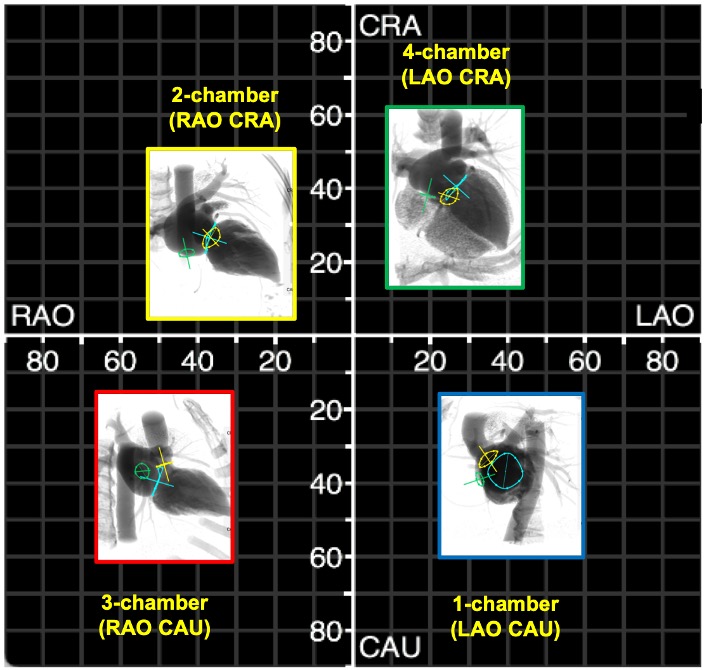
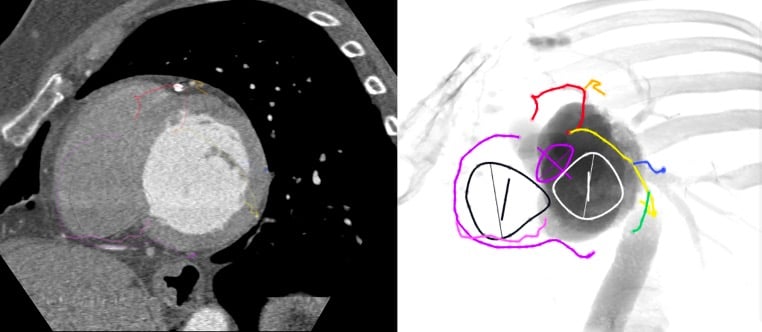
Fluoroscopic chamber views of the left heart. The region of fluoroscopic angulations corresponding to each of the chamber views of the left heart is shown. The mitral valve, aortic valve and atrial septum are traced in blue, yellow and green respectively. Average coordinates appear in Figure 5. CAU: caudal; CRA: cranial; LAO: left anterior oblique; RAO: right anterior oblique.
Fluoroscopic chamber views of the left heart. The region of fluoroscopic angulations corresponding to each of the chamber views of the left heart is shown. The mitral valve, aortic valve and atrial septum are traced in blue, yellow and green respectively. Average coordinates appear in Figure 5. CAU: caudal; CRA: cranial; LAO: left anterior oblique; RAO: right anterior oblique.
The main features of multimodality imaging of the left heart are summarized in Figure 9 and Figure 10.
Figure 9
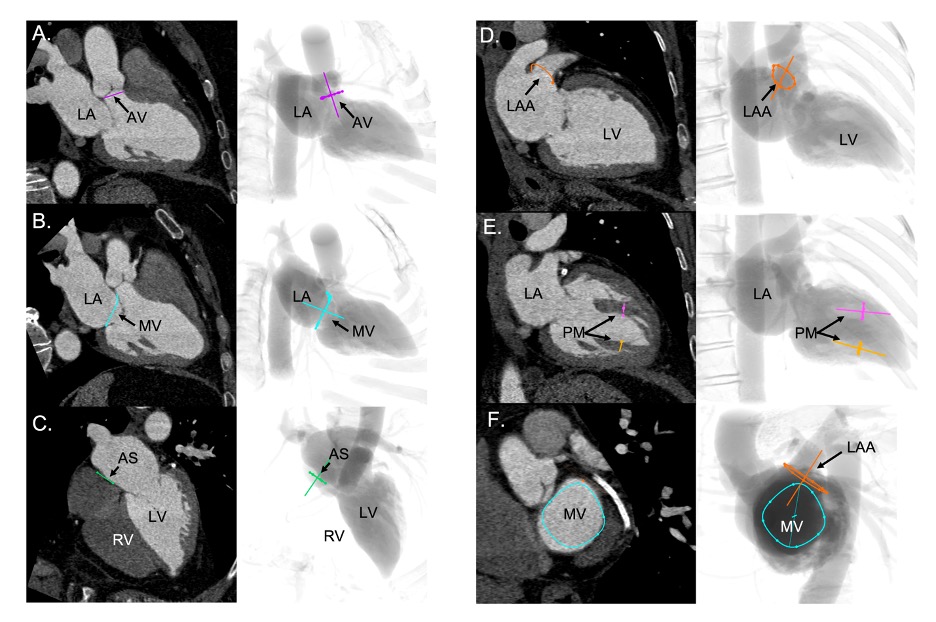
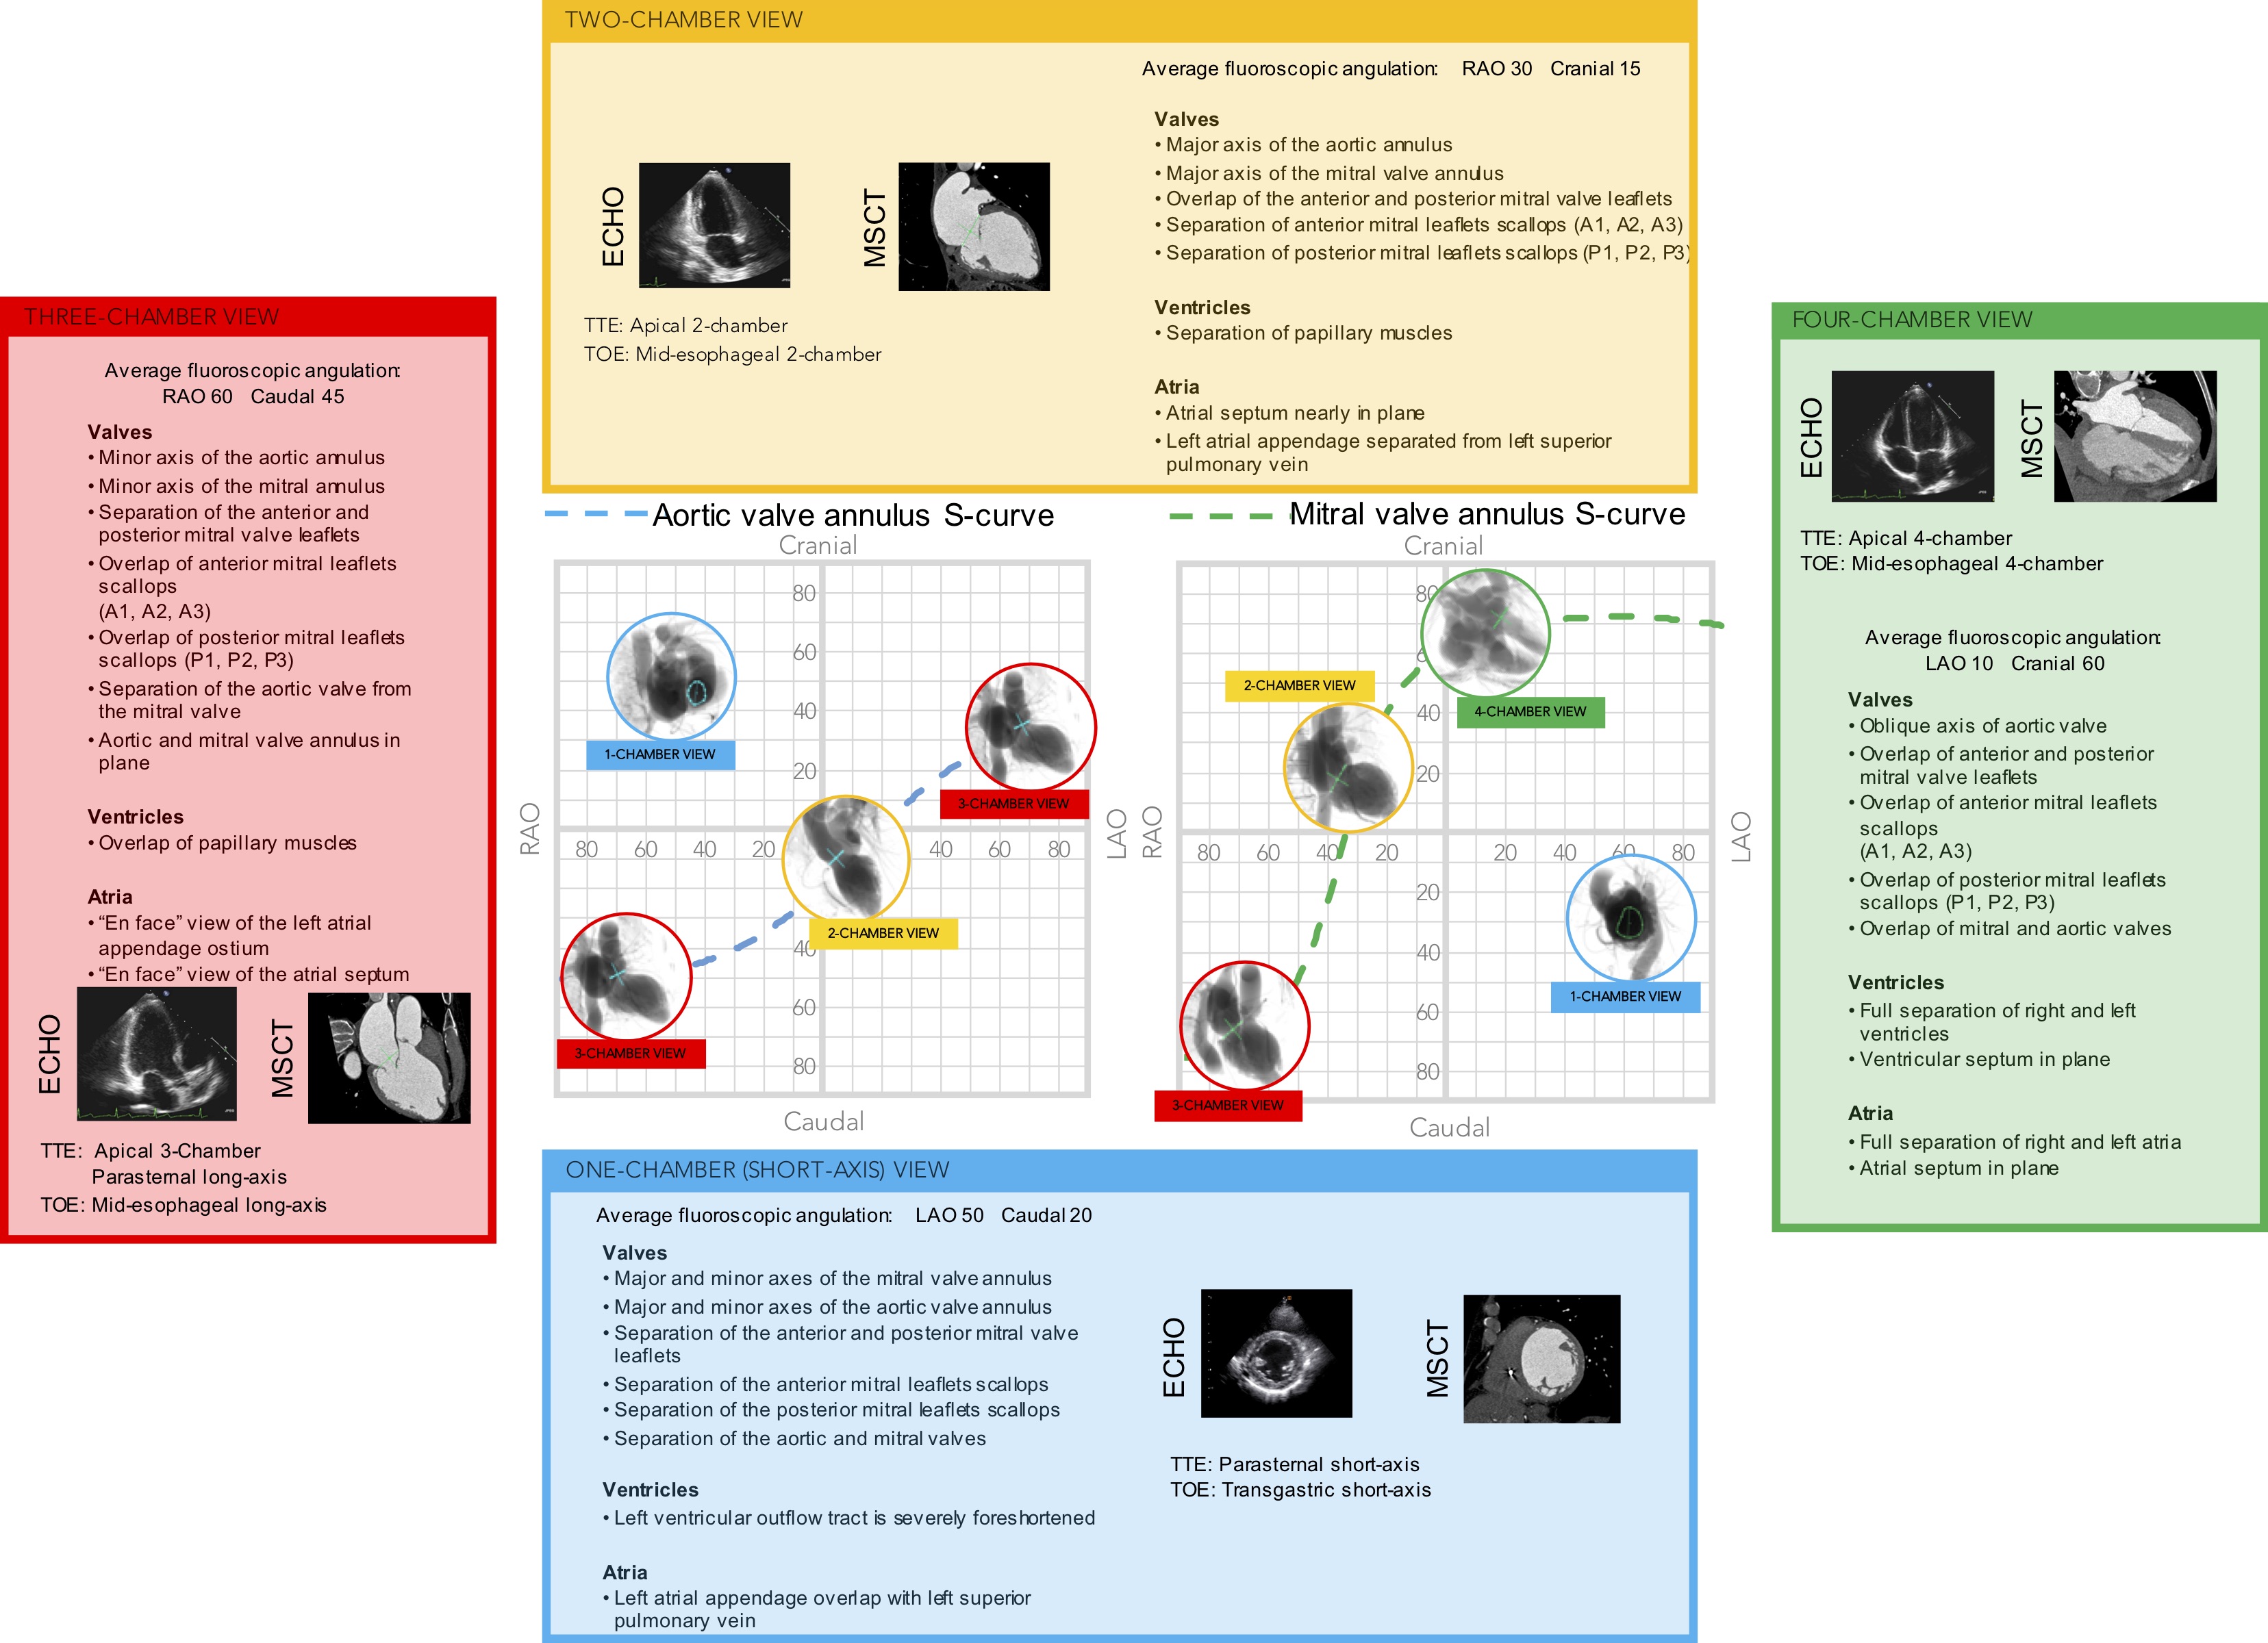
Multimodality imaging of the left side of the heart, aortic and mitral valve. The optimal projection curves of the aortic and mitral annulus are plotted as a blue dotted line (aortic valve annulus) and green dotted line (mitral valve annulus). The region of fluoroscopic angulations corresponding to each of the chamber views is indicated by circles. The panels correspond to the two-chamber (yellow), three- chamber (red) and the four-chamber (green) views. Each panel presents the matching echocardiographic and MSCT images corresponding to the fluoroscopic view of interest (circles). LAO: left anterior oblique; MSCT: multislice computed tomography; RAO: right anterior oblique; TOE: transoesophageal echocardiography; TTE: transthoracic echocardiography.
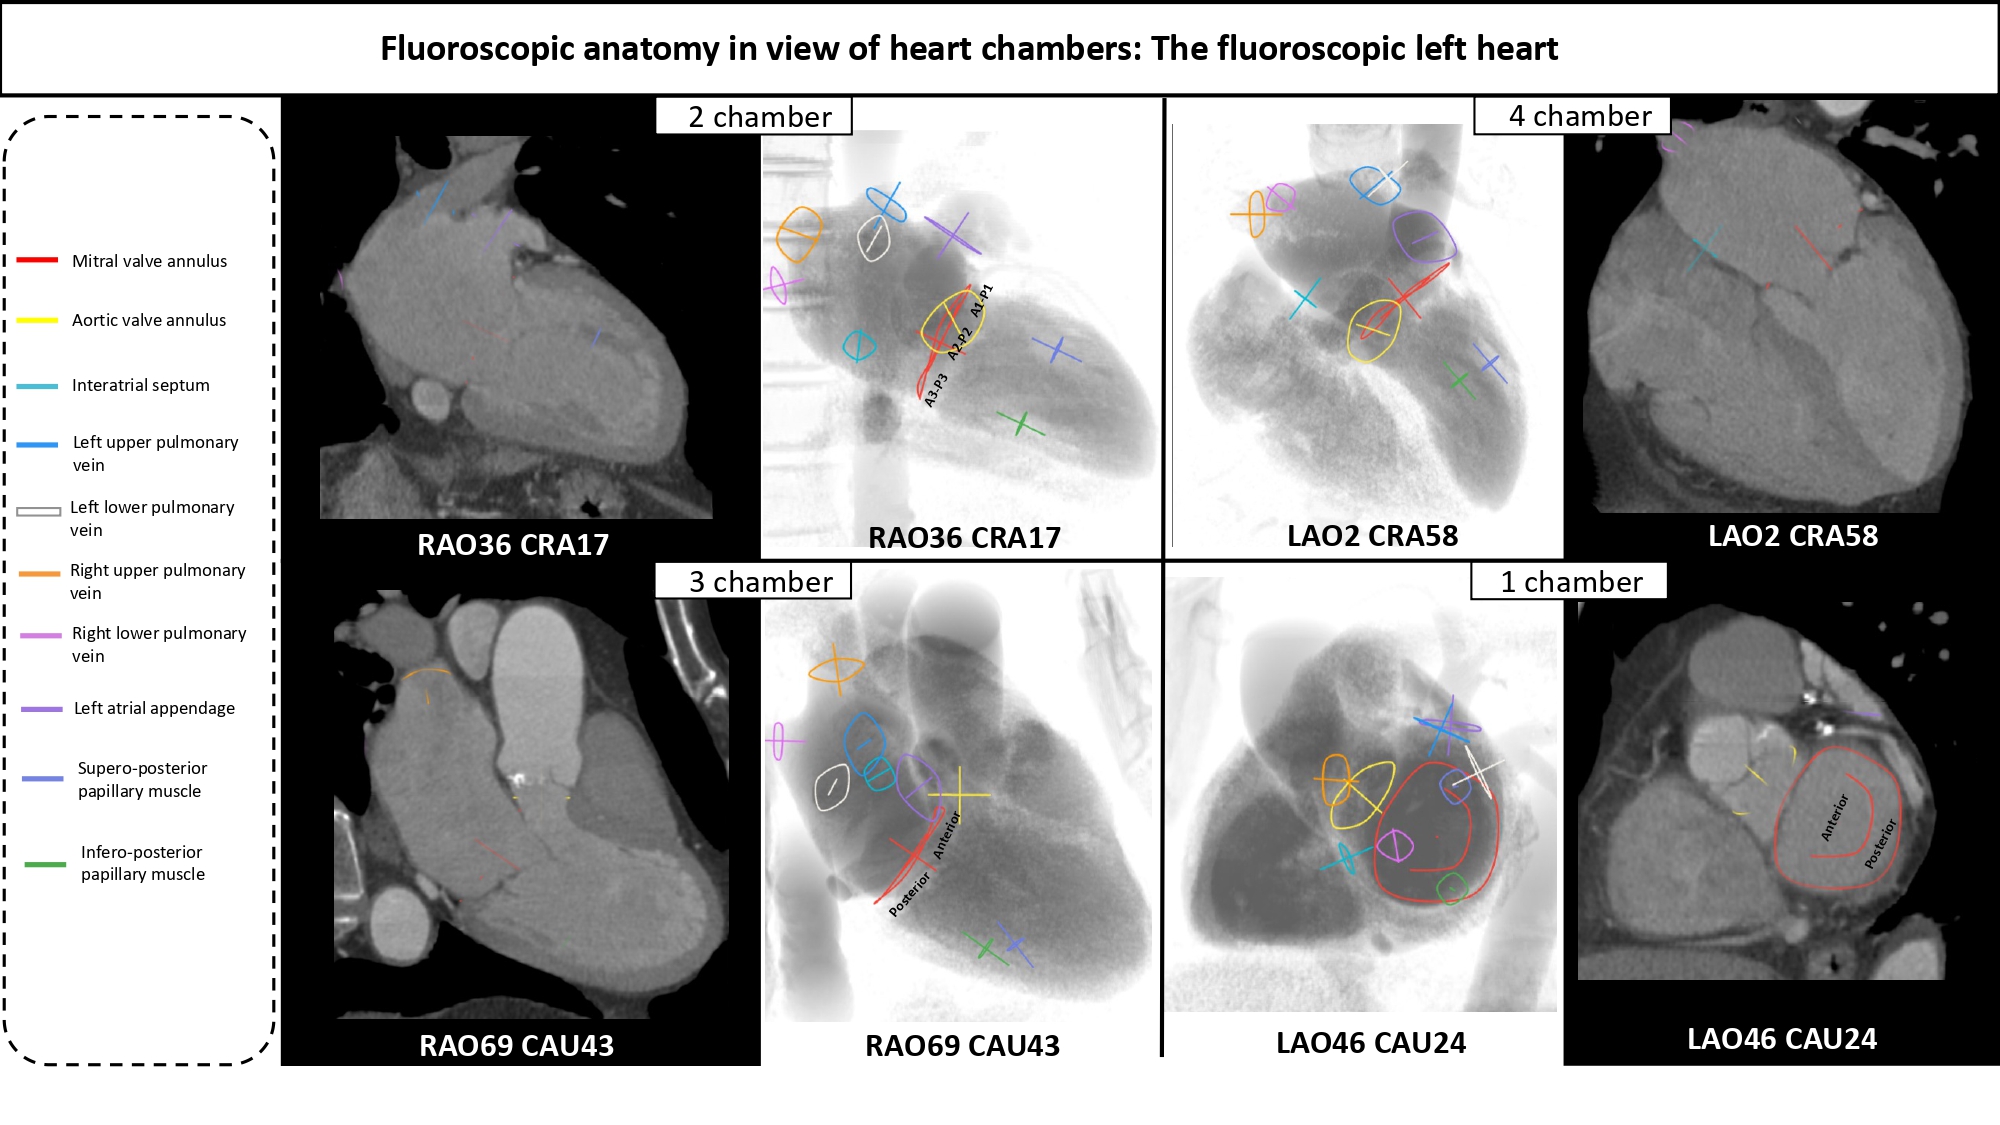
Fluoroscopic left sided cardiac structures across the multislice computer tomography and fluoroscopic 4 chamber views. The main cardiac structures are highlighted with circles according the left column color code.
Short-axis view of the left ventricle can be obtained in a LAO projection with CAU angulation (average fluoroscopic angulation: LAO50° CAU20°) 16. Pighi M, Thériault-Lauzier P, Piazza N. Multimodality imaging for interventional cardiologists. EuroIntervention J Eur Collab with Work Gr Interv Cardiol Eur Soc Cardiol. 2018 Aug;14(AB):AB33–9 Link. This projection provides the en-face or short-axis view of the left ventricle and mitral valve (major and minor diameter). By displaying the mitral valve en-face, the one-chamber view is useful for the guidance of procedures requiring separation of the anterior and posterior mitral valve leaflets and leaflet scallops which are seen in an A1/P1 to A3/P3 direction from inferior-left to superior-right direction on the fluoroscopic screen. Starting from 8 o’clock and moving clockwise posterior-inferior, the mitral valve annulus is surrounded by the atrial septum, aortic valve which provides an attitudinal reference of anteriority, left atrial appendage ostium (major axis), supero-posterior papillary muscle and ending at 5 o’clock with the infero-posterior papillary muscle. As can be deducted given the proximity to the spine (on the right of the fluoroscopic screen), both papillary muscles are located on the posterior aspect of the left ventricle. For this reason, the classical “antero-lateral” vs. “postero-medial” nomenclature can be potentially misleading, since no papillary muscle is actually located anteriorly, and should be accordingly discouraged in favor of a supero-posterior vs. infero-posterior correct attitudinal definition. The 1-chamber view also separates the superior/inferior and right/left pulmonary veins.
The corresponding views on transthoracic echocardiography can be appreciated from the parasternal and subcostal short axis views and on transoesophageal echocardiography from a transgastric short-axis 0° view. Nowadays, modern matrix probes can perform multiplanar reconstructions and generate the desired chamber views.
Two-chamber view of the left heart
The two-chamber view can be obtained with a shallow RAO CRA angulation (average fluoroscopic angulation: RAO30° CRA15°) 16. Pighi M, Thériault-Lauzier P, Piazza N. Multimodality imaging for interventional cardiologists. EuroIntervention J Eur Collab with Work Gr Interv Cardiol Eur Soc Cardiol. 2018 Aug;14(AB):AB33–9 Link. This view allows us to appreciate the major axis of the aortic and mitral valve annuli. The two-chamber view is useful to separate the mitral leaflet scallops with A3/P3, A2/P2, and A1/P1 oriented from left to right on the screen (bicommissural view of the mitral valve). Aortic and mitral valves are overlapped. The interatrial septum is seen in plane, above the inferomedial commissure. The minor axis of the LAA orifice is on the opposite side of the left atrium, above the superior (lateral) commissure while its body elongates on the right of the fluoroscopic screen. The mitral subvalvular apparatus is typically best appreciated in 2-chamber view. Located below their respective commissures, the superior and inferior papillary muscles are maximally separated, which could facilitate operators in targeting these structures. Furthermore, superior and inferior pulmonary veins are overlapped while right and left pulmonary veins are separated.
On transesophageal echocardiography, the two-chamber view can be appreciated from a mid-esophageal 90° or transgastric long-axis 90° view or using echocardiographic multiplanar reconstructions.
Three-chamber view of the left heart
A three-chamber view can be obtained in a steep RAO CAU projection (average fluoroscopic angulation: RAO60°/CAU45°) 16. Pighi M, Thériault-Lauzier P, Piazza N. Multimodality imaging for interventional cardiologists. EuroIntervention J Eur Collab with Work Gr Interv Cardiol Eur Soc Cardiol. 2018 Aug;14(AB):AB33–9 Link. The minor axes of the aortic and mitral annuli are visualized and can therefore be useful for appreciating balloon expansion or frame compression during transcatheter aortic and mitral valve procedures. The LVOT is maximally elongated, superiorly and anteriorly on the top-right half of the fluoroscopic screen, terminating in the aortic annulus.
Separating the aortic valve and LVOT from the mitral valve, this view is useful to evaluate LVOT obstruction during transcatheter mitral valve replacement. Having both the mitral and the aortic annuli in plane, this is the optimal perspective to appreciate the aorto-mitral angle (normally around 120 degrees in peak systole). The anterior (A1-A2-A3) and posterior (P1-P2-P3) mitral valve scallops are overlapped and separated in a superior/inferior location on the fluoroscopic screen, respectively. The 3-chamber view overlaps both papillary muscles on the posterior aspect of the left ventricle, inferiorly on the screen, and can be used to avoid them during stiff guidewire or Impella positioning (Figure 11). The three-chamber view also demonstrates an en-face view of the atrial septum and the left atrial appendage ostium and therefore not a recommended chamber view for LAA occlusion. Superior and inferior pulmonary veins as well as right and left pulmonary veins are separated.
Figure 11
Usefulness of fluoroscopic 3-chamber view for Impella positioning. The 3-chamber view overlaps both papillary muscles (red and green circles) on the inferior aspect of the left ventricle and can be used to avoid them during stiff guidewire or Impella positioning.
The fluoroscopic three-chamber fluoroscopic view corresponds to the parasternal long-axis or apical three-chamber view on transthoracic echocardiography. Similar views can be obtained from a mid-esophageal long-axis 120°-140° or transgastric long-axis 110°-130° view.
Four-chamber view of the left heart
The four-chamber view can be obtained by placing the fluoroscopic C-arm in an extreme CRA projection with a variable RAO or LAO projection (average fluoroscopic angulation: LAO10° CRA60°) 16. Pighi M, Thériault-Lauzier P, Piazza N. Multimodality imaging for interventional cardiologists. EuroIntervention J Eur Collab with Work Gr Interv Cardiol Eur Soc Cardiol. 2018 Aug;14(AB):AB33–9 Link. The fluoroscopic four-chamber view can provide the mitral valve annulus and atrial septum simultaneously in plane and can be useful for transcatheter mitral valve interventions. This view displays full separation between left- and right-ventricles and atria and sets the ventricular and atrial septa in plane. Above the mitral valve, the LAA ostium is seen almost en-face. The aortic and mitral valves are nearly superimposed, and the mitral valve leaflets and scallops appear overlapped.
The fluoroscopic 4-chamber view corresponds to the transthoracic apical 4-chamber view or mid-to-low transesophageal view at 0°-20°. Due to the 2-dimensional nature of fluoroscopy, the 4-chamber and 5-chamber views can be said to be “overlapped”.
The fluoroscopic right heart
The regions of fluoroscopic angulations corresponding to each of the chamber views of the right heart are shown in Figure 12. Co-registration of MSCT and fluoroscopy of right heart structures is shown in Figure 13.
Figure 12
Fluoroscopic chamber views of the right heart. The region of fluoroscopic angulations corresponding to each of the chamber views of the right heart is shown. The tricuspid valve is traced in orange. CAU: caudal; CRA: cranial; LAO: left anterior oblique; RAO: right anterior oblique.
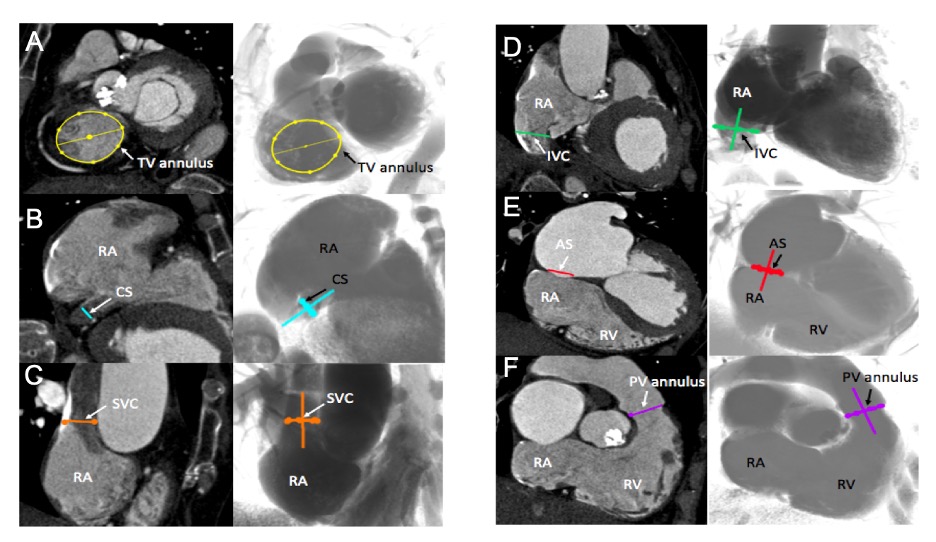
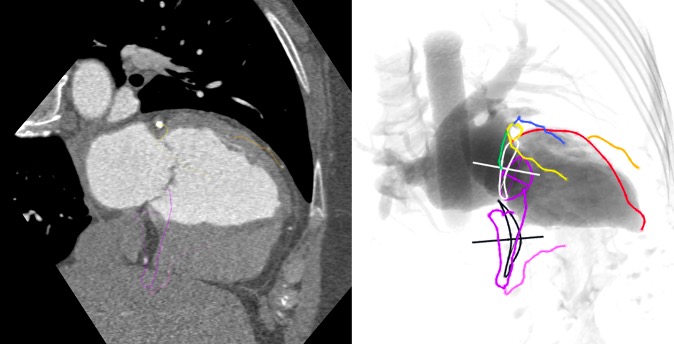
Multislice computed tomography chamber views of right-sided heart structures and corresponding fluoroscopy. A. TV=tricuspid valve, in yellow; B. CS=coronary sinus, in blue; C. SVC= superior vena cava, in orange; D. IVC=inferior vena cava, in green; E. AS=atrial septum, in red; F. PV=pulmonary valve, in purple. Structures are determined on MSCT (left column) and the simulated fluoroscopy (right column). RA=right atrium; RV=right ventricle.
The main features of multimodality imaging of the right heart are summarized in Figure 14 and Figure 15.
Figure 14
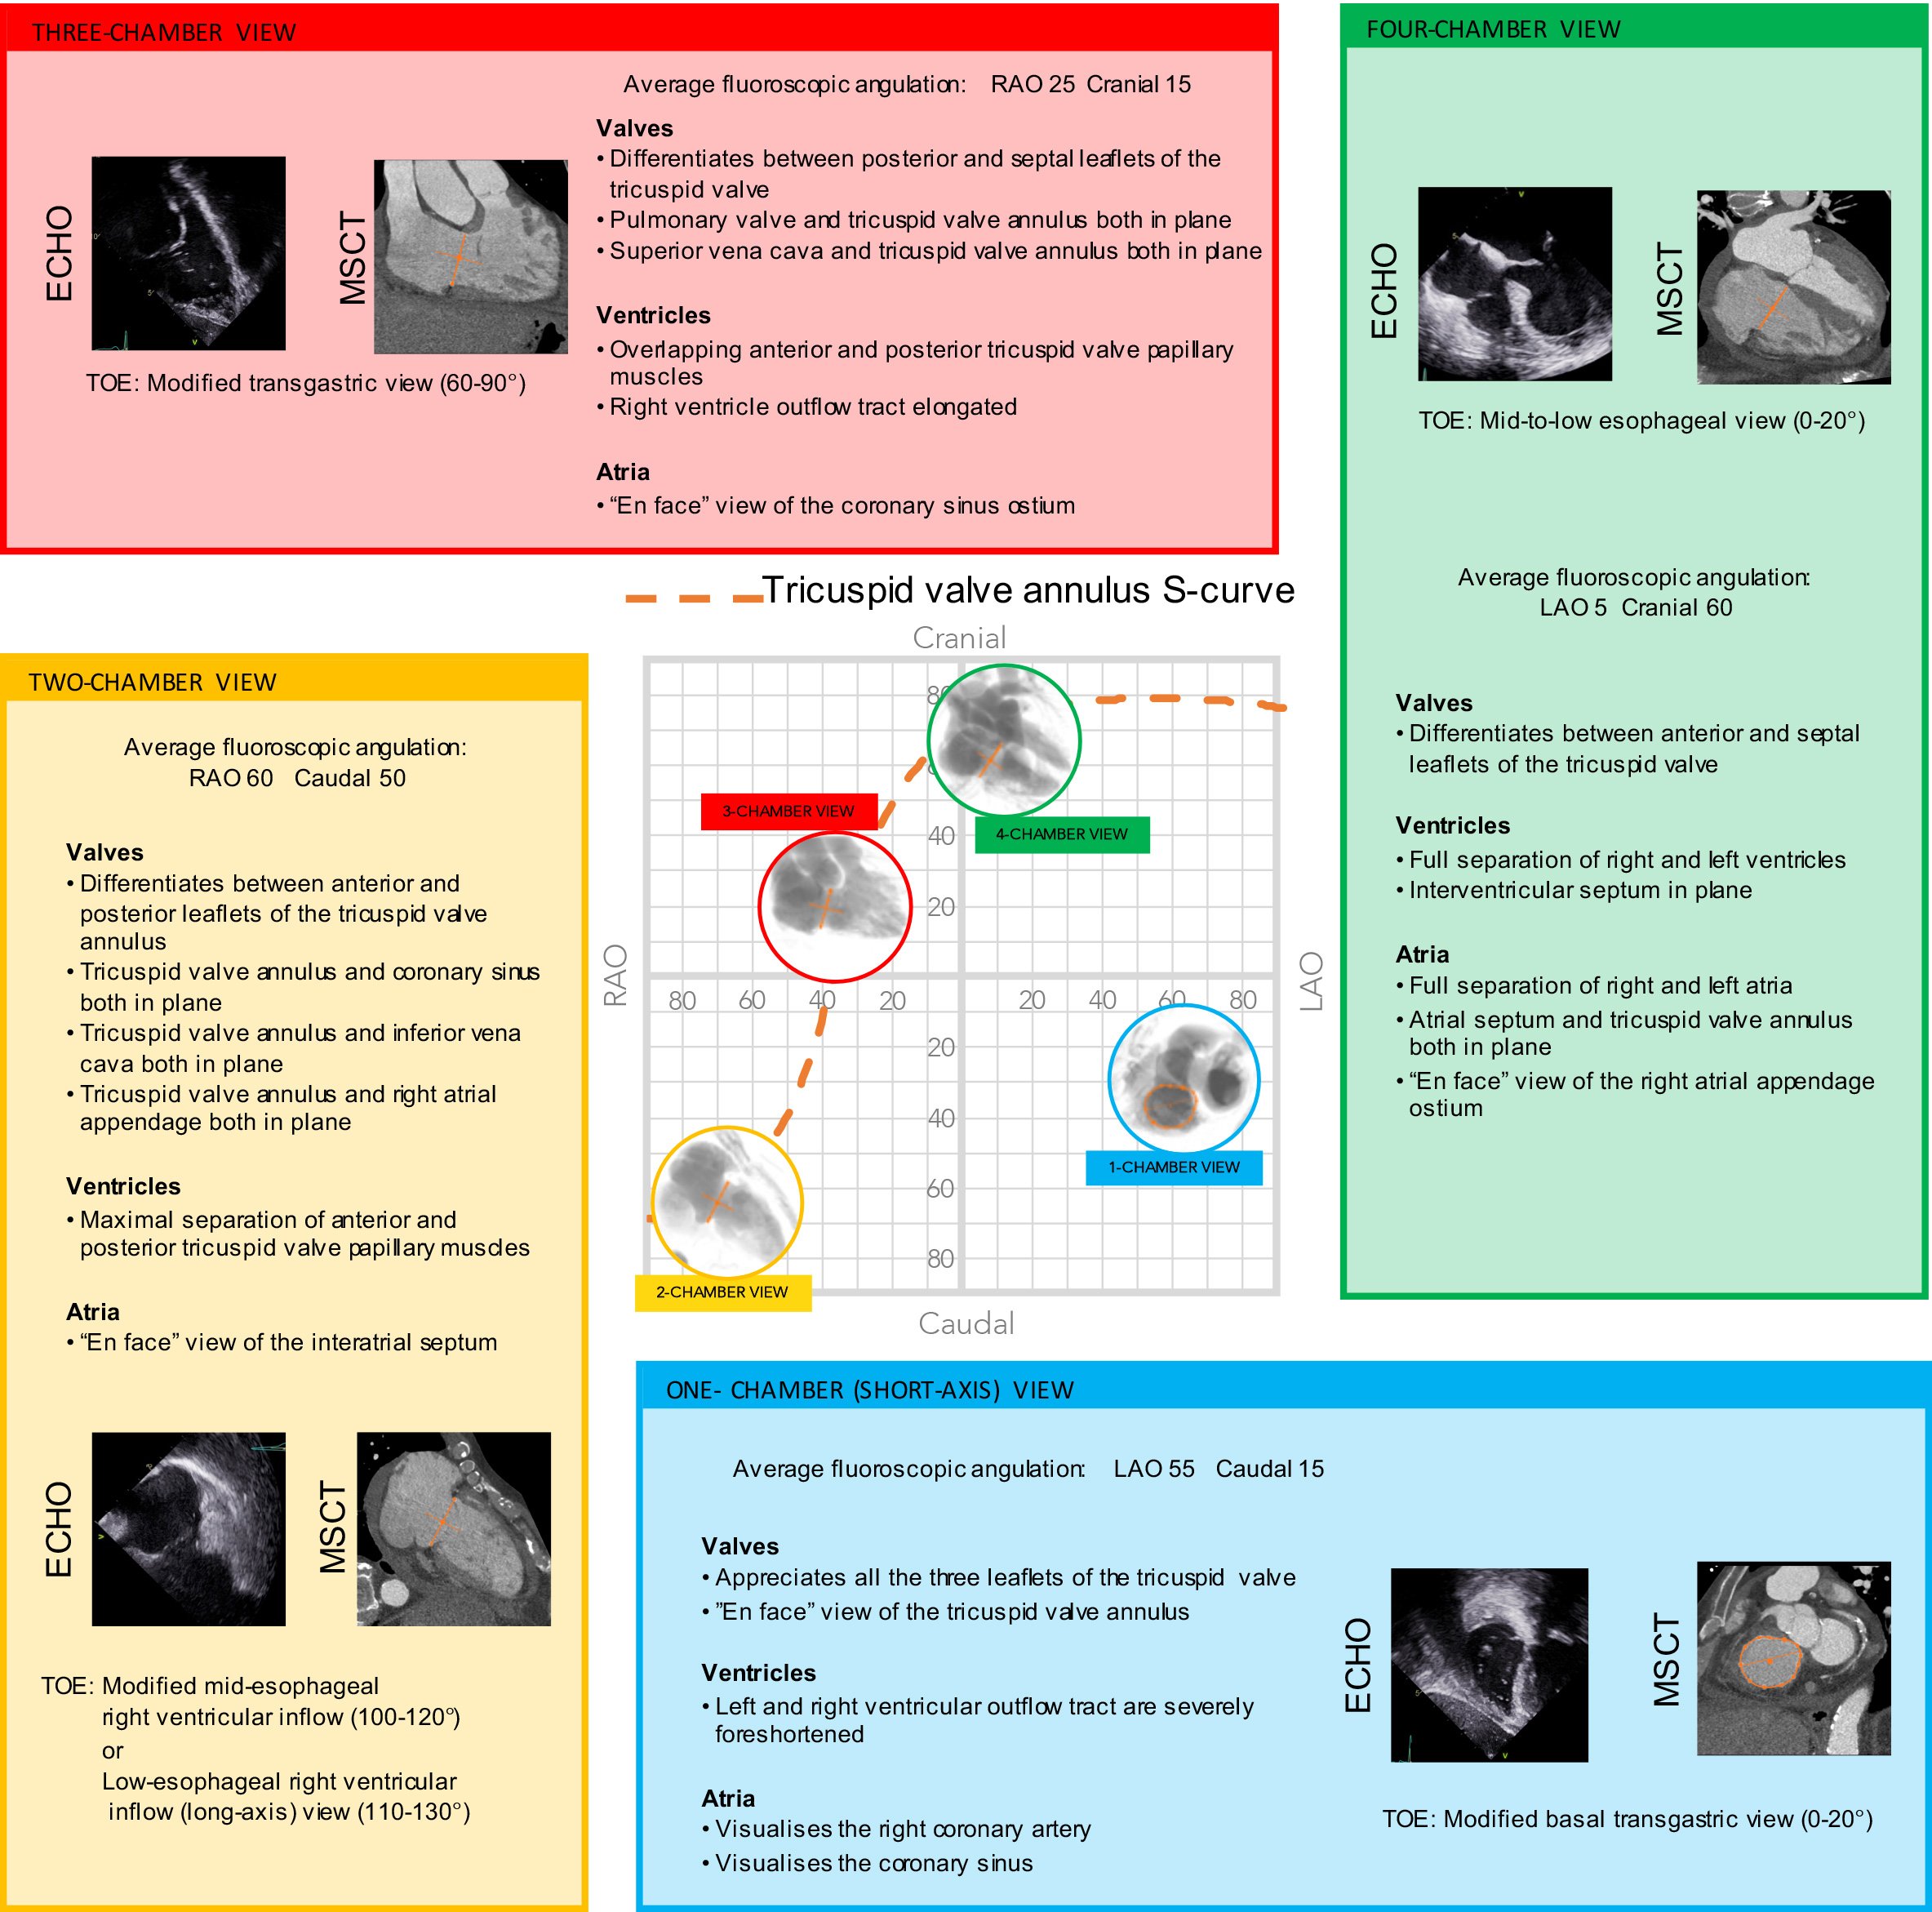
Multimodality imaging of the right side of the heart and tricuspid valve. Multimodality imaging of the left side of the heart, aortic and mitral valve. The optimal projection curves of the aortic and mitral annulus are plotted as a blue dotted line (aortic valve annulus) and green dotted line (mitral valve annulus). The region of fluoroscopic angulations corresponding to each of the chamber views is indicated by circles. The panels correspond to the two-chamber (yellow), three- chamber (red) and the four-chamber (green) views. Each panel presents the matching echocardiographic and MSCT images corresponding to the fluoroscopic view of interest (circles). LAO: left anterior oblique; MSCT: multislice computed tomography; RAO: right anterior oblique; TOE: transoesophageal echocardiography; TTE: transthoracic echocardiography.
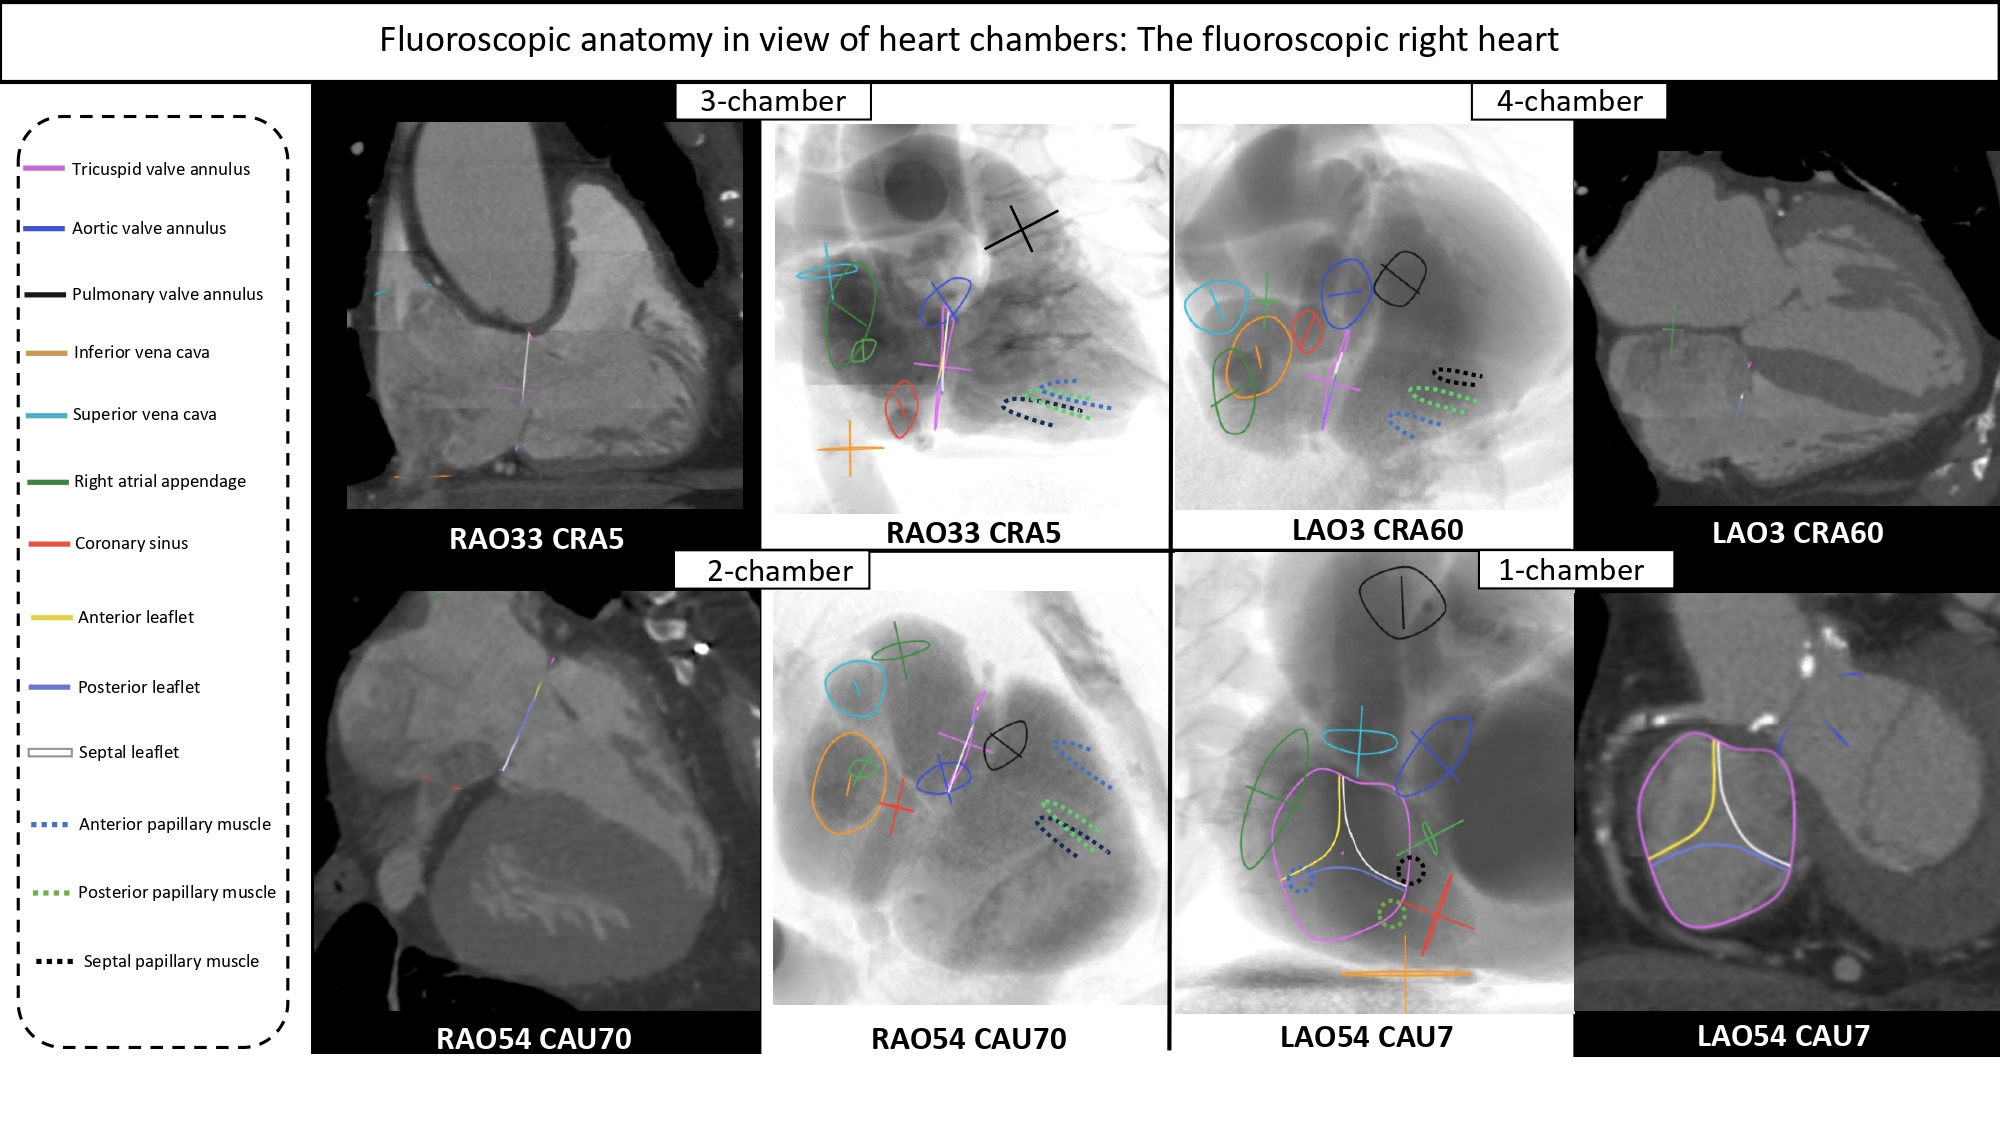
Fluoroscopic right sided cardiac structures across the multislice computer tomography and fluoroscopic 4 chamber views. The main cardiac structures are highlighted with circles and dotted circles according the left column color code.
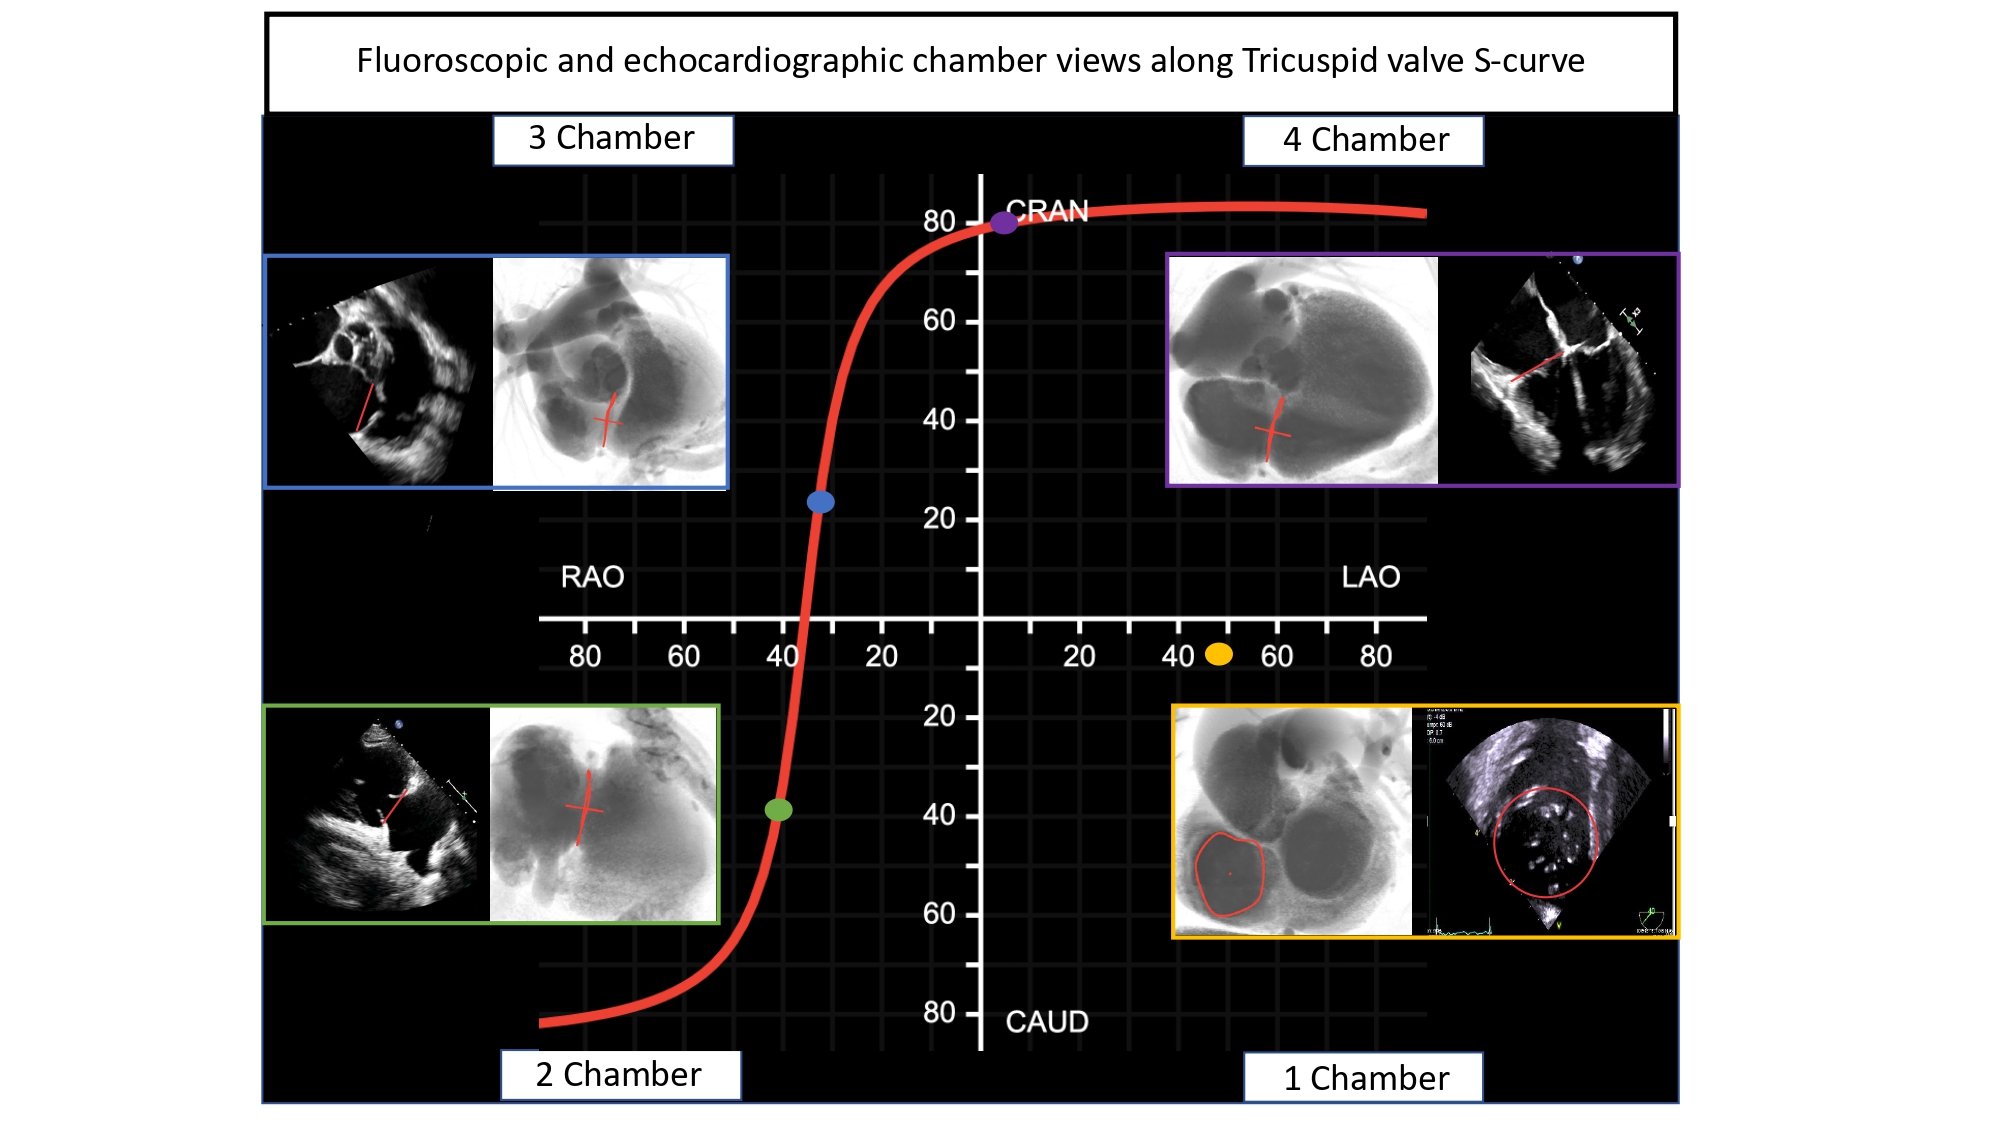
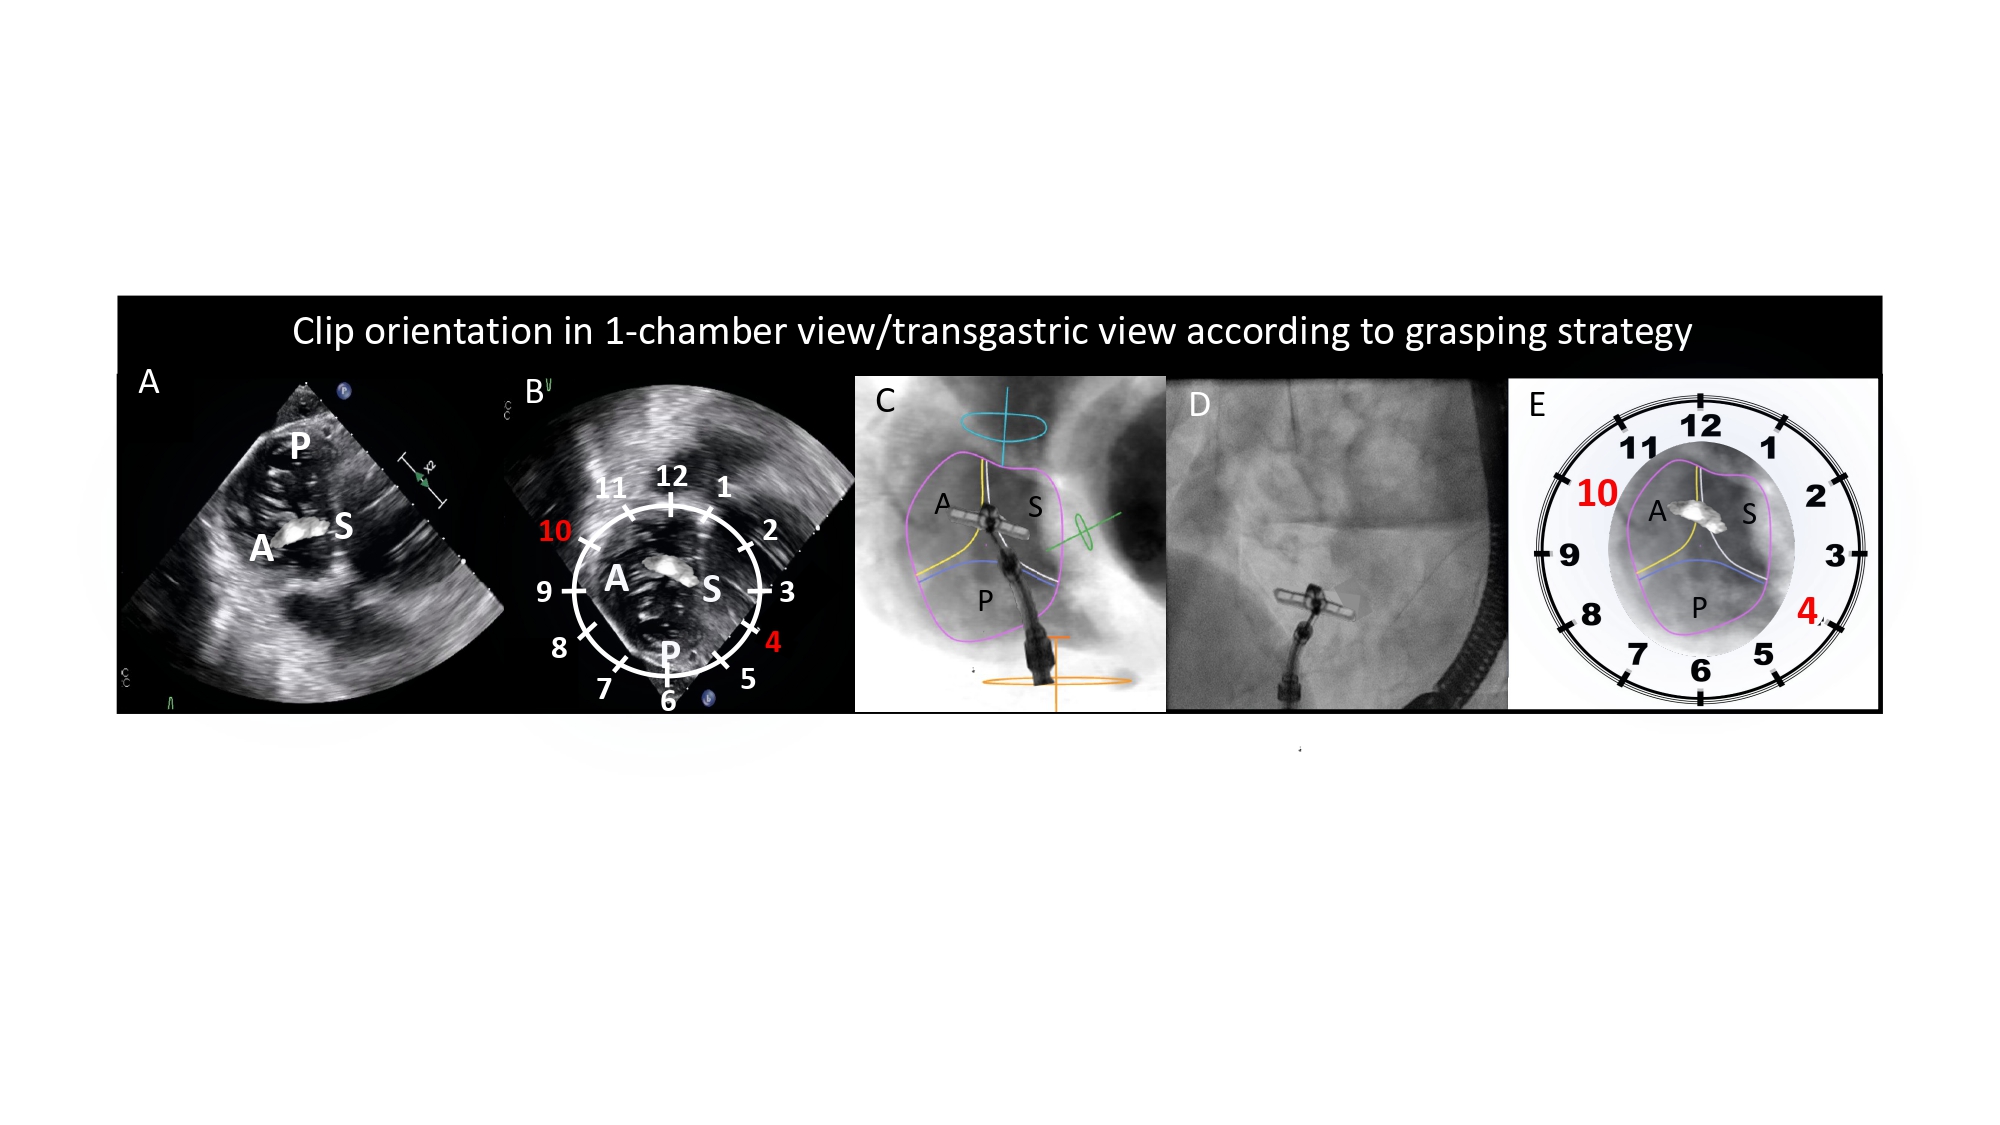
The one-chamber (short-axis) view of the right heart displays the en-face view of the tricuspid valve and it can be obtained in a LAO CAU angulation (average fluoroscopic angulation: LAO55° CAU15°) 16. Pighi M, Thériault-Lauzier P, Piazza N. Multimodality imaging for interventional cardiologists. EuroIntervention J Eur Collab with Work Gr Interv Cardiol Eur Soc Cardiol. 2018 Aug;14(AB):AB33–9 Link. In this fluoroscopic projection, the anterior and posterior attitudinal positions are to the left and right, while superior and inferior are at the top and bottom of the fluoroscopic screen, respectively. Approximately 50% of patients exhibit tricuspid valve variations with more than three leaflets 17. Hahn RT, Weckbach LT, Noack T, Hamid N, Kitamura M, Bae R, Lurz P, Kodali SK, Sorajja P, Hausleiter J, Nabauer M. Proposal for a Standard Echocardiographic Tricuspid Valve Nomenclature. JACC Cardiovasc Imaging. 2021 Jul;14(7):1299–305 Link. Assuming a tri-leaflet configuration, the fluoroscopic 1-chamber view demonstrates that (i) the posterior leaflet of the tricuspid valve lies inferior-posterior to the anterior leaflet and inferior-anterior to the septal leaflet; (ii) the anterior leaflet lies anterior to the septal leaflet and anterior-superior to the posterior leaflet; and (iii) the septal leaflet lies posterior to the anterior leaflet and posterior-superior to the posterior leaflet 18. Dahou A, Levin D, Reisman M, Hahn RT. Anatomy and Physiology of the Tricuspid Valve. JACC Cardiovasc Imaging. 2019 Mar;12(3):458–68 Link. In a broad sense, the posterior leaflet is "inferior," the anterior leaflet is "anterior," and the septal leaflet is "posterior" within the attitudinal framework. Starting from 11 o’clock and moving clockwise posterior-inferior, the tricuspid valve is surrounded by the right atrial appendage, superior vena cava, membranous septum adjacent to the non-coronary cusp of the aortic valve, atrial septum, coronary sinus and ending at 6 o’clock with the inferior vena cava. The tricuspid valve apparatus includes three distinct papillary muscles (anterior, posterior, and septal). On the 1-chamber view, the tips of the papillary muscles lie within the inferior half of the right ventricle akin to those of the mitral valve lying in the posterior half of the left ventricle. The anterior is located at the level of antero-posterior commissure and is usually used as a landmark to separate the anterior and posterior tricuspid valve leaflets. The so-called “posterior papillary muscle” is actually located inferior and posterior, close to the postero-septal commissure. Finally, the septal papillary muscle lies adjacent and immediately posterior to the “posterior papillary muscle” and may manifest as various small muscle bands that originate from the septum. The one-chamber view of the right heart is critical to understanding the attitudinal orientation of right-sided heart structures given that the superior and inferior vena cava, and atrial septum are simultaneously in plane while the tricuspid valve annulus is in short-axis. It is also useful for targeting the structures of interest by matching the fluoroscopic disposition of the tricuspid leaflets (septal, anterior and posterior) with a modified (upside down) transgastric transesophageal echocardiography view, seen from the ventricular side (Figure 16). In this view, it is also possible to appreciate the trajectory of the coronary sinus (Figure 17).
Figure 16
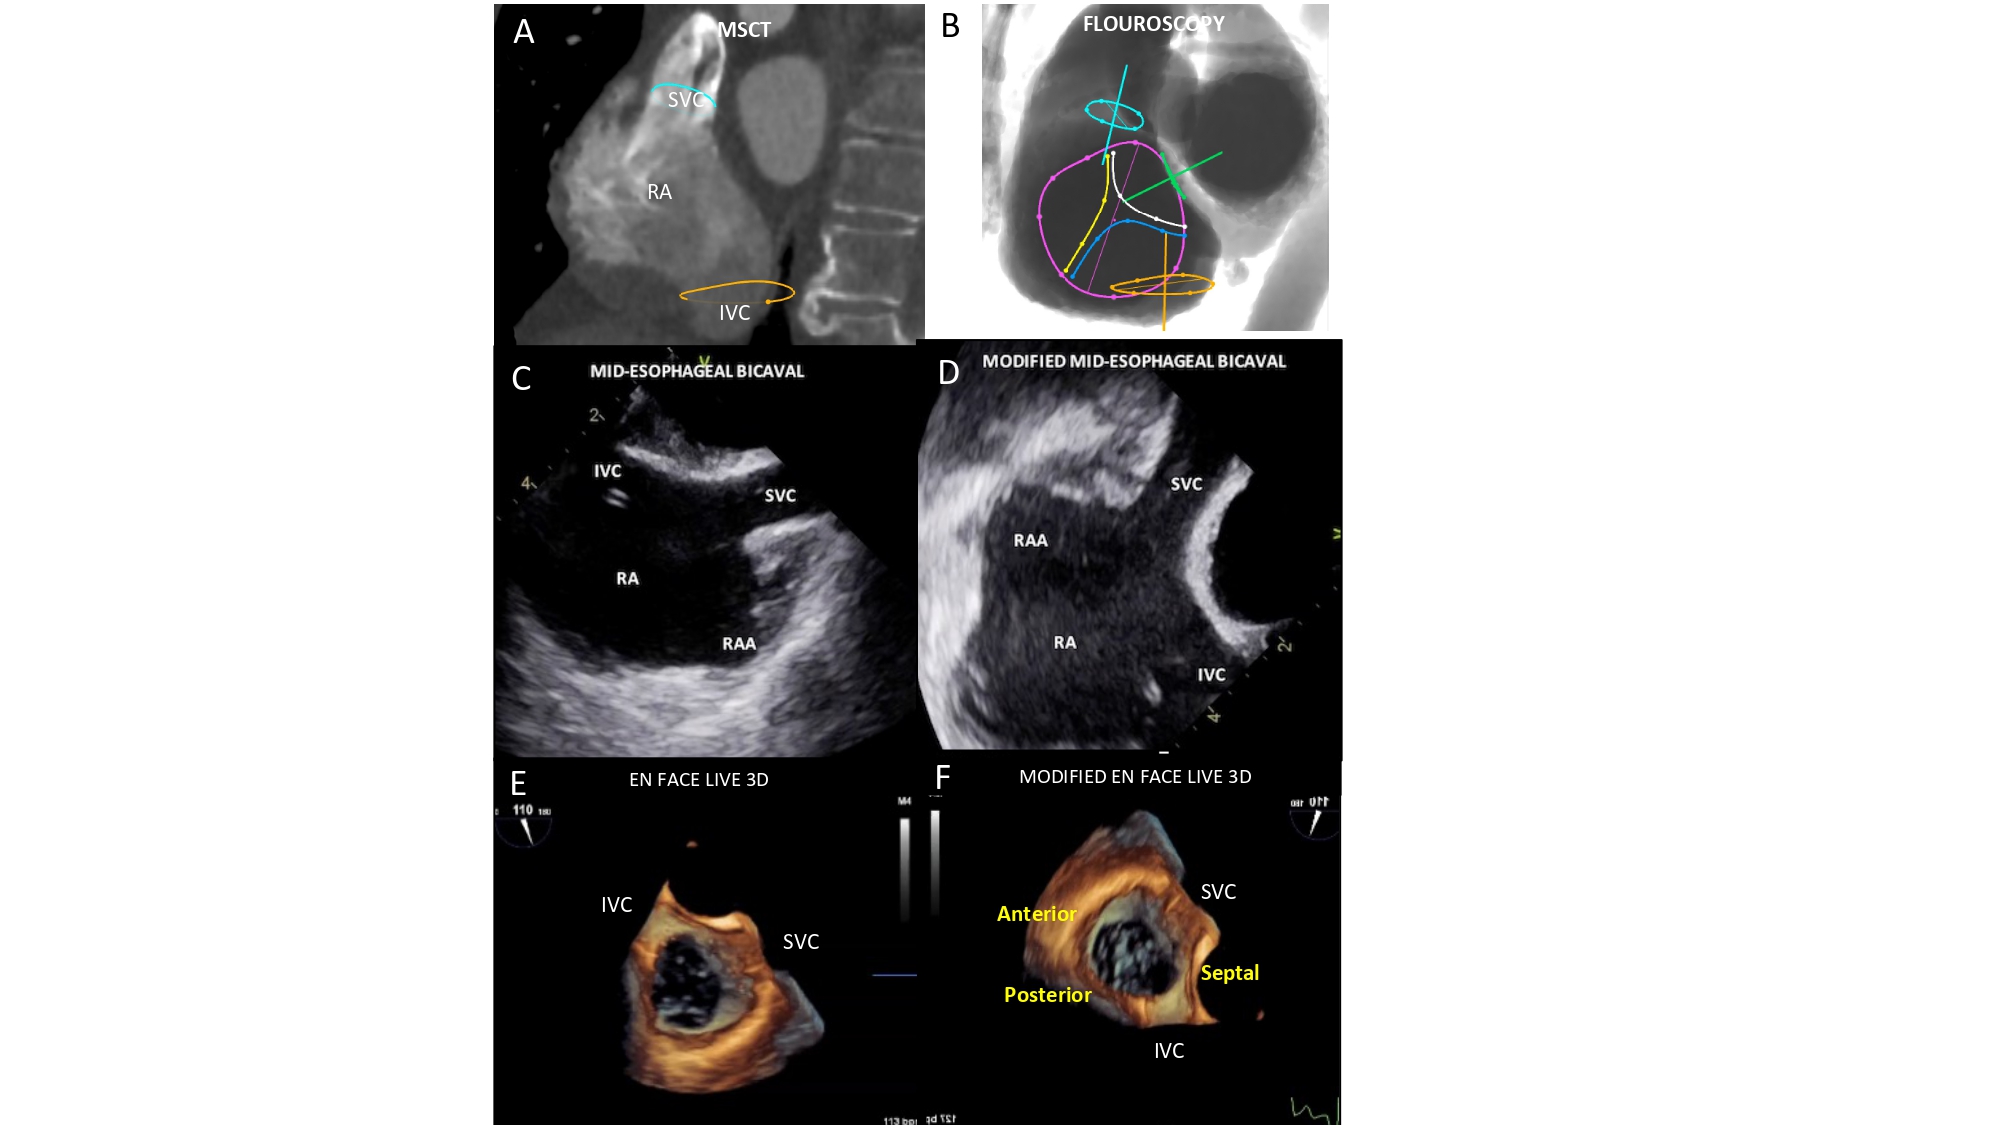
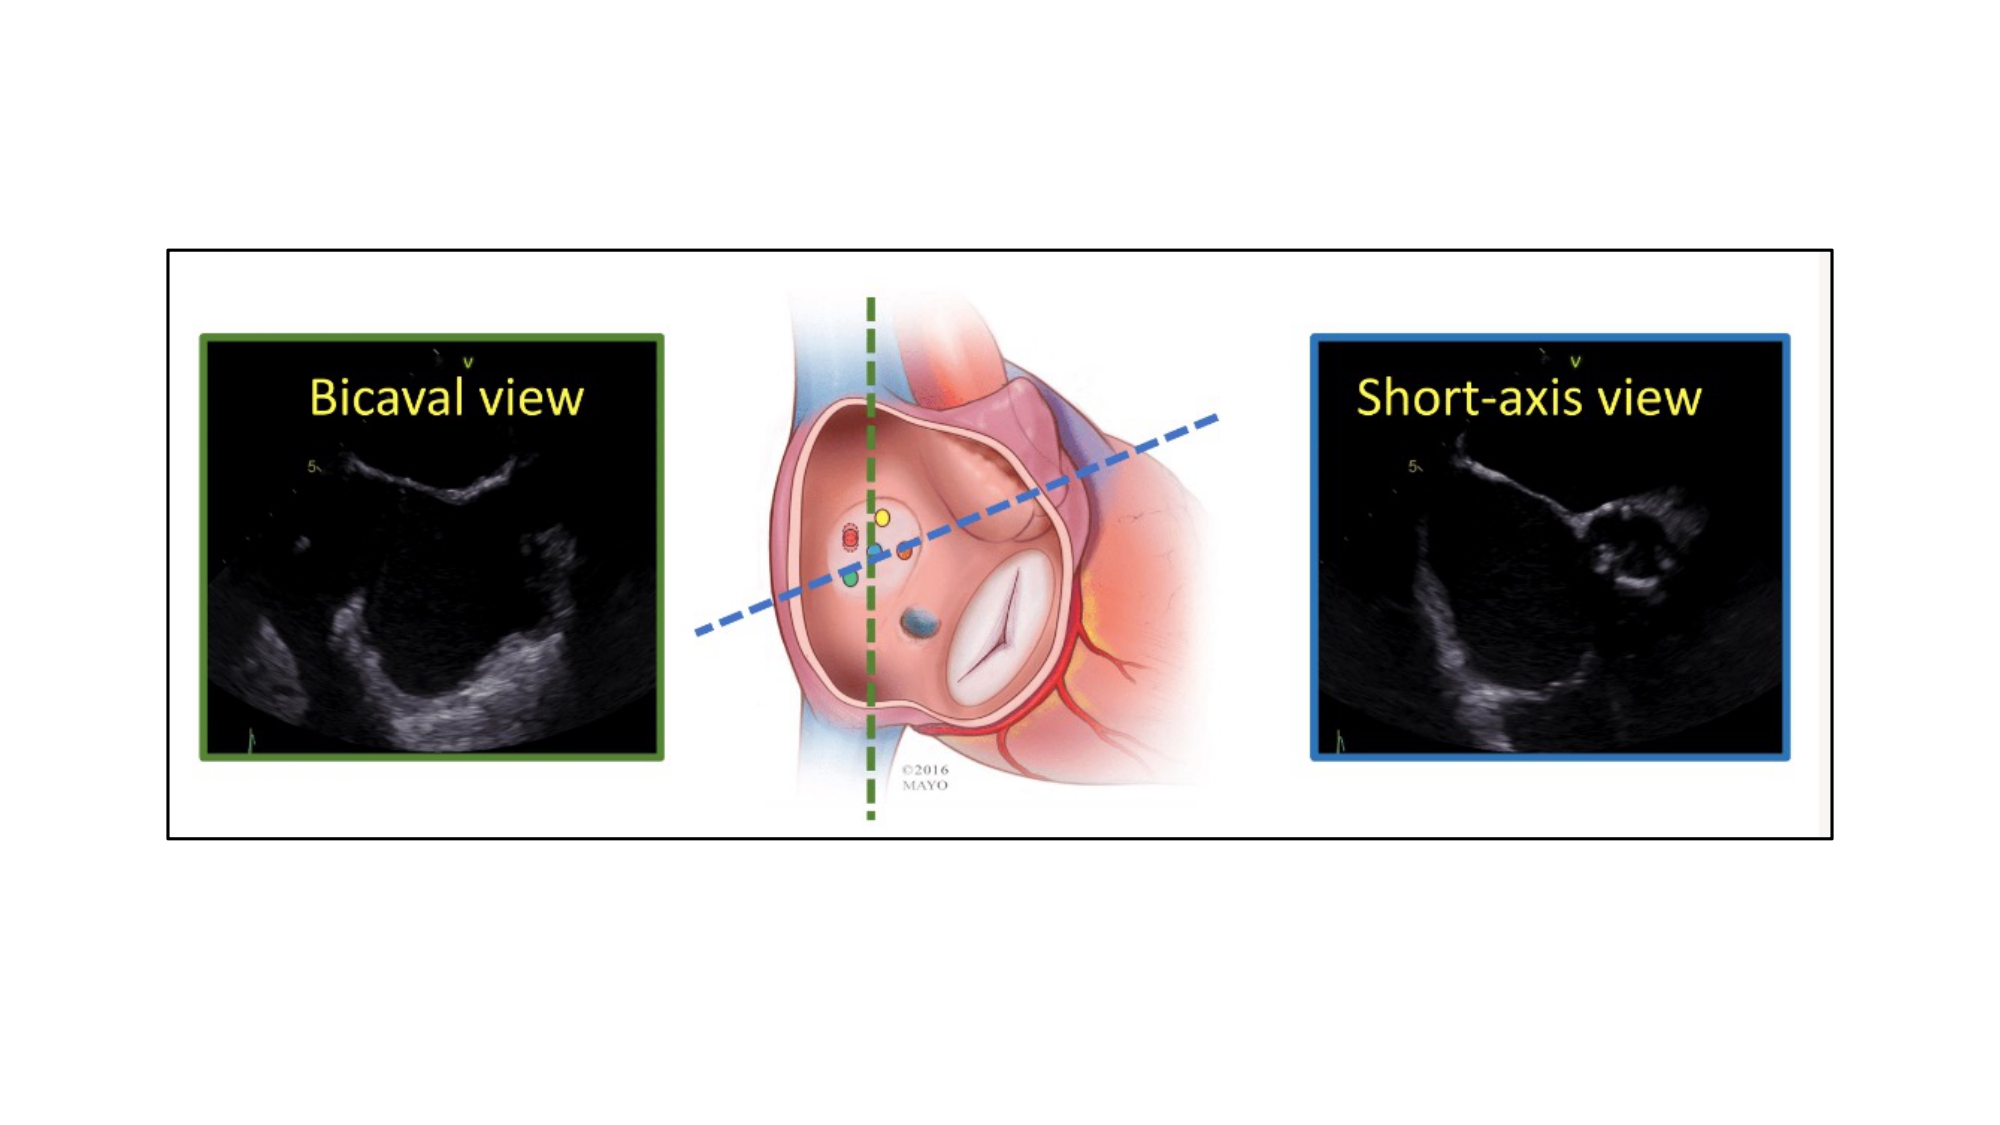
Bicaval view. MSCT (A), fluoroscopic (B), conventional and modified TEE (C-D) and TEE Live 3D (E-F) bicaval matching views of the right atrium. The modified echocardiographic displays were inverted left/right and rotated 90 clockwise from the classical TEE bicaval view. In this view the superior and inferior venae cavae (turquoise and orange circles, respectively) can be visualized both in plane as well as the inferior vena cava and the interatrial septum (green circle). The fluoroscopic is obtained by angulating the C-arm in a LAO90°/CRA10° projection. Tricuspid valve (violet circle) is “en face” and its anterior (yellow line), posterior (blue line) and septal (white line) leaflets are separated.
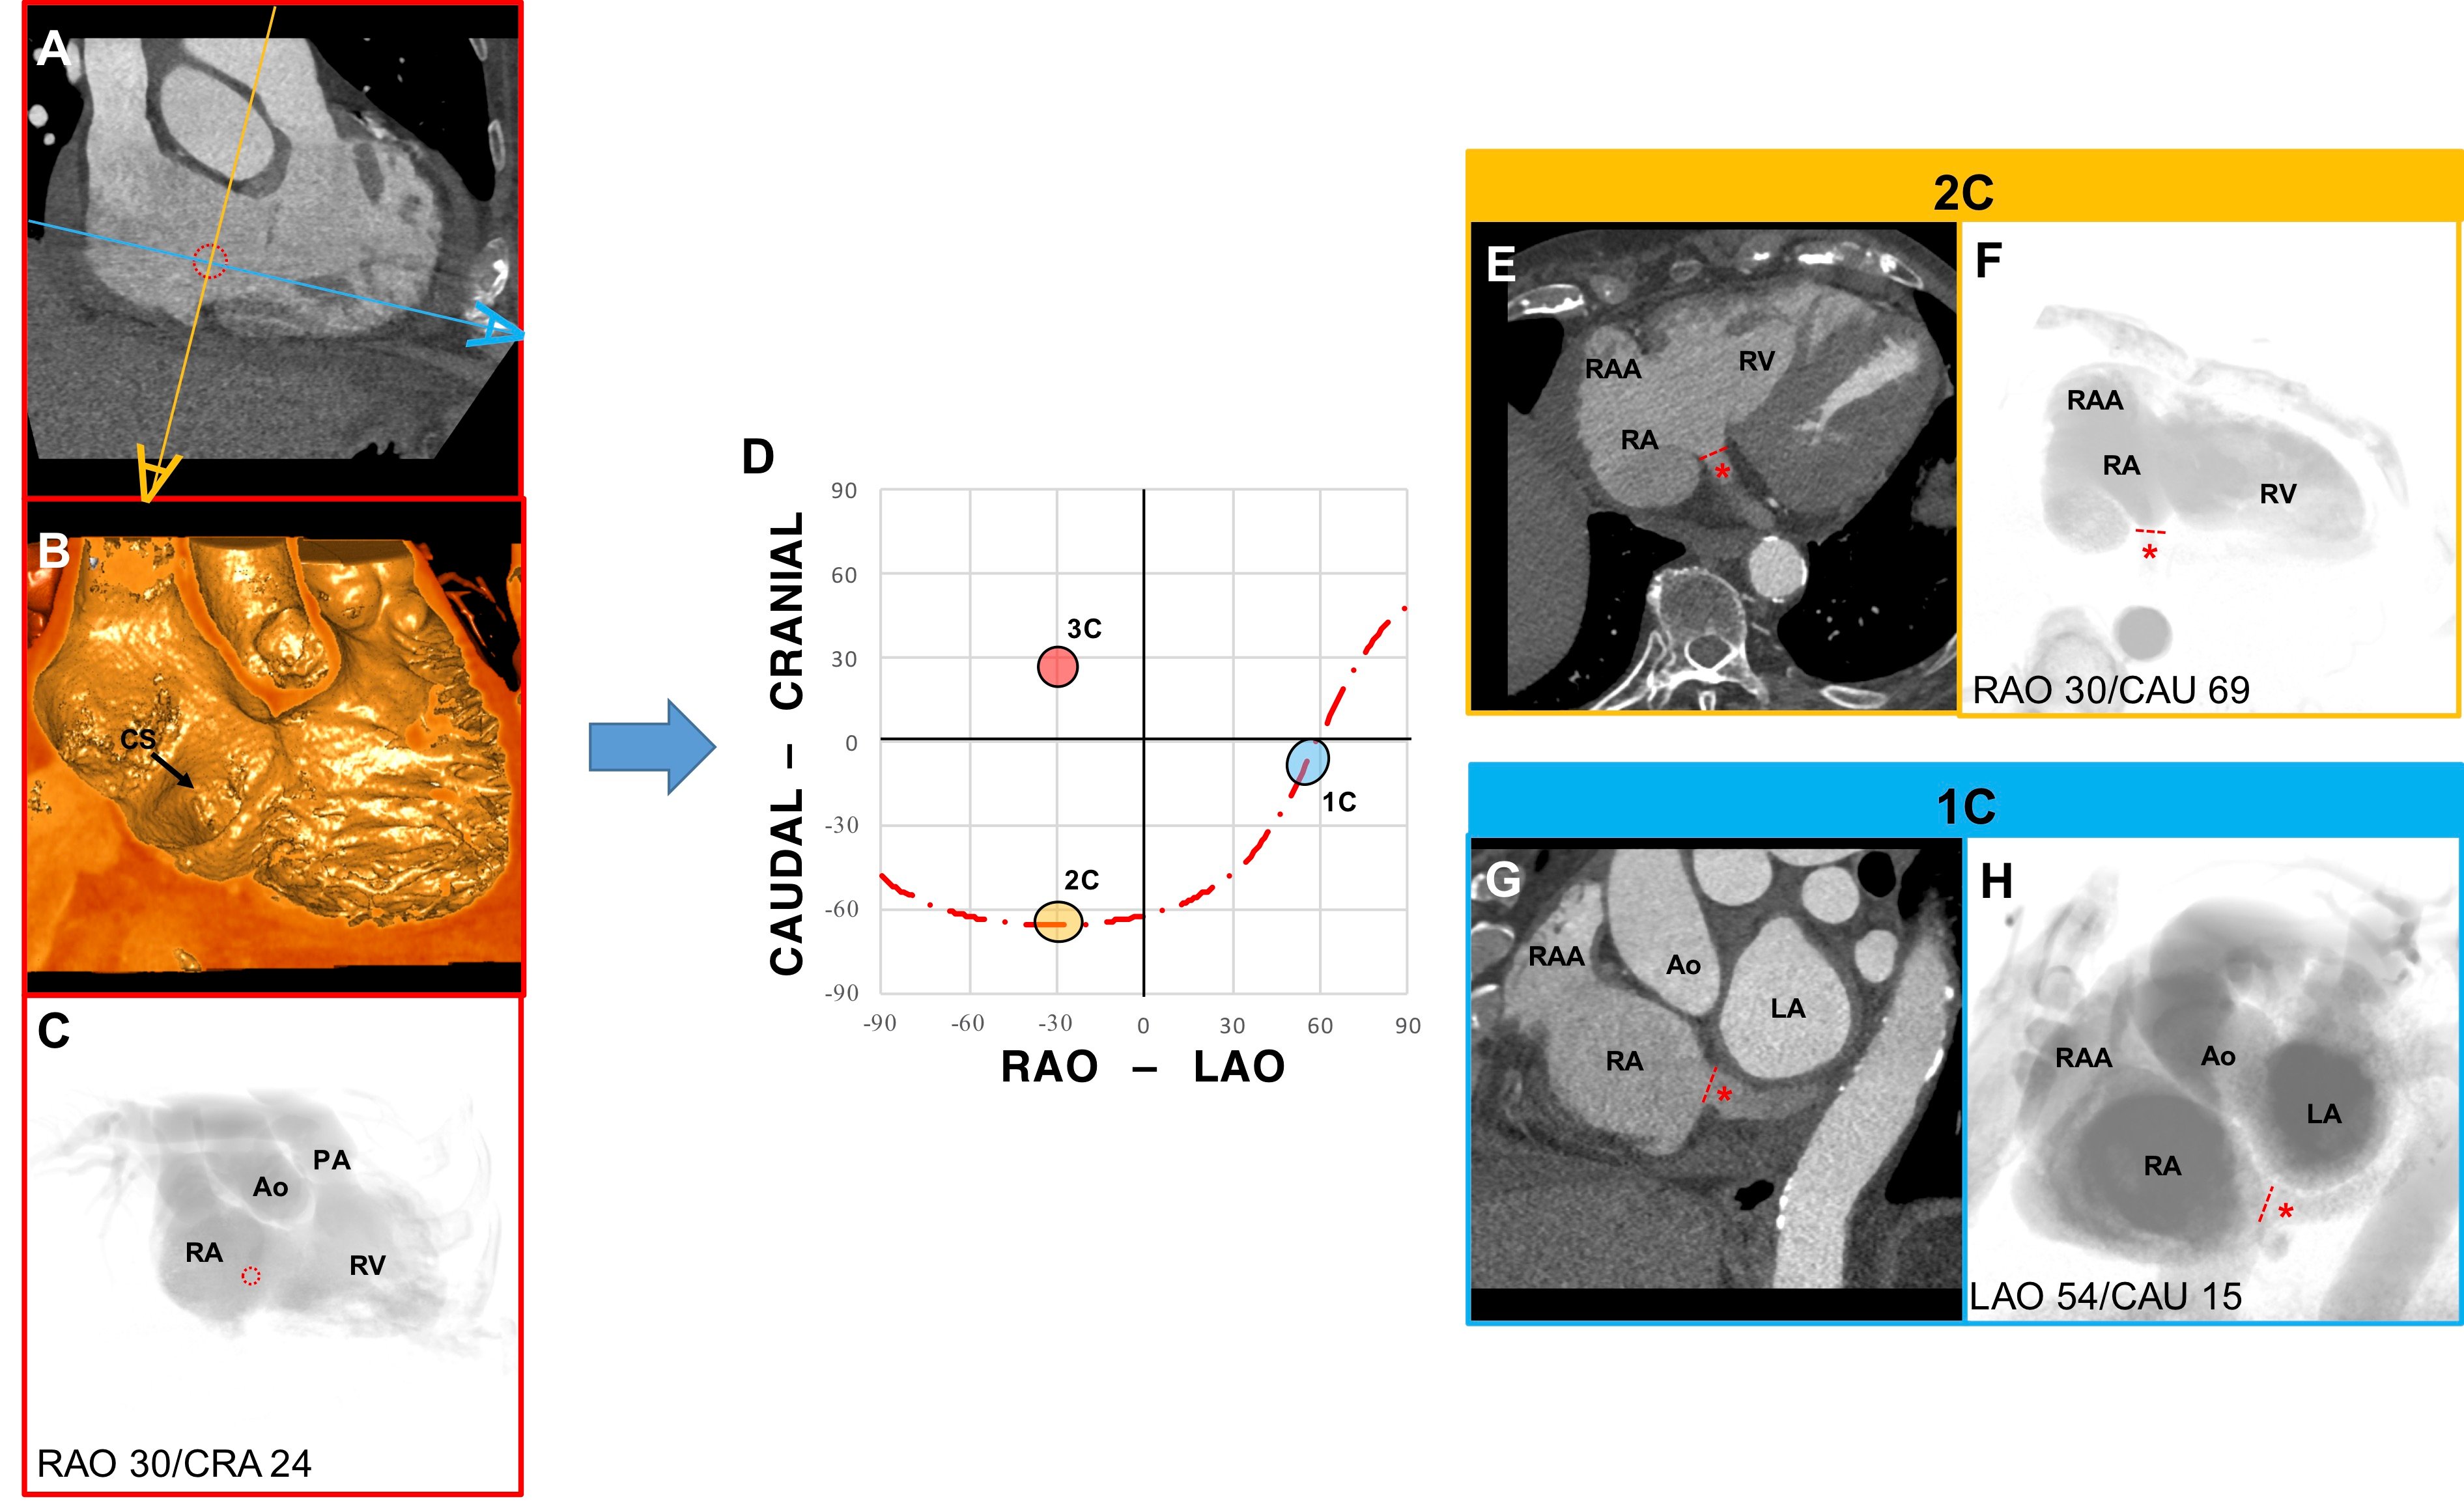
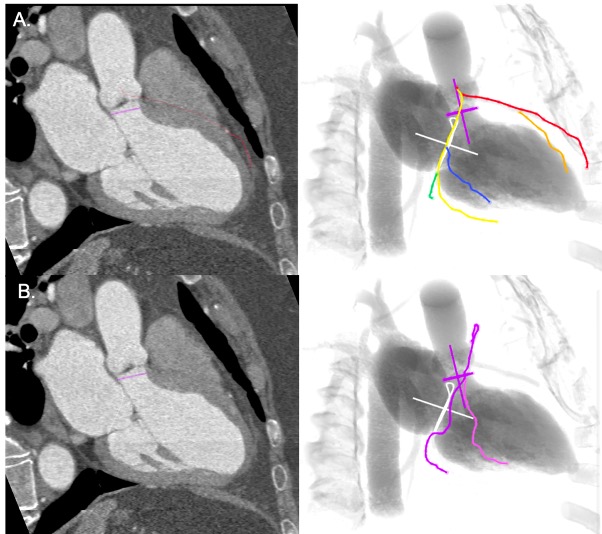
Chamber view anatomy of the Coronary Sinus. (A) MSCT, (B) endovascular, and (C) fluoroscopic en face view of the coronary sinus (CS) (red dotted circle). (D) S-curve of the CS depicting the angulations of the 2-chamber (yellow), 3-chamber (red), and 1-chamber (blue) views. The 2 eye symbols describe the position of the x-ray detector in the corresponding fluoroscopic view; orange corresponds to E and F and blue to G and H. (E) The MSCT axial slice is in the same orientation of F, which shows the ostium of the CS (red dashed line) in plane. The distal course of the CS is shown by the red asterisk. (G) The MSCT sagittal slice is in the same orientation of H, which shows the ostium of the CS in plane and its course, in a short-axis view.
The one-chamber view can be obtained using a transesophageal basal transgastric window (0°-20°) or by 3D acquisitions during transthoracic or transesophageal echocardiography.
Two-chamber (right ventricle inflow) view of the right heart
A two-chamber (right ventricle inflow) view of the right heart can be obtained in a steep RAO CAU projection (average fluoroscopic angulation: RAO60° CAU50°) 16. Pighi M, Thériault-Lauzier P, Piazza N. Multimodality imaging for interventional cardiologists. EuroIntervention J Eur Collab with Work Gr Interv Cardiol Eur Soc Cardiol. 2018 Aug;14(AB):AB33–9 Link, and it represents the right ventricular inflow of the right heart. This view can be potentially helpful in identifying the attachments of the anterior (superiorly on the screen) and posterior (inferiorly on the screen) leaflets of the tricuspid valve to the atrioventricular junction. The anterior papillary muscle can be maximally separated from posterior and septal papillary muscles. The atrial septum is displayed en-face. During attempts to enter the right ventricle, caution is needed to avoid entering and/or injuring the coronary sinus, whose orifice is at 90 degrees with the tricuspid valve annulus. Conversely, this projection can be beneficial for operators aiming to locate the coronary sinus in specific procedures. Using a fluoroscopic RAO projection with CAU angulation permits to achieve maximal separation between the coronary sinus and the tricuspid valve, while both structures are in plane (Figure 17).
The two-chamber view of the right heart corresponds to a transthoracic echocardiographic parasternal long-axis two-chamber view of the right ventricle. Transesophageal echocardiography can display a similar two-chamber view in a mid-esophageal right ventricular inflow view at 100°-120° (bicaval angle, rotated toward the right), a low-esophageal right atrial view, or a transgastric right ventricular inflow (long-axis) view at 110°-130°.
Three-chamber (right ventricle inflow) view of the right heart
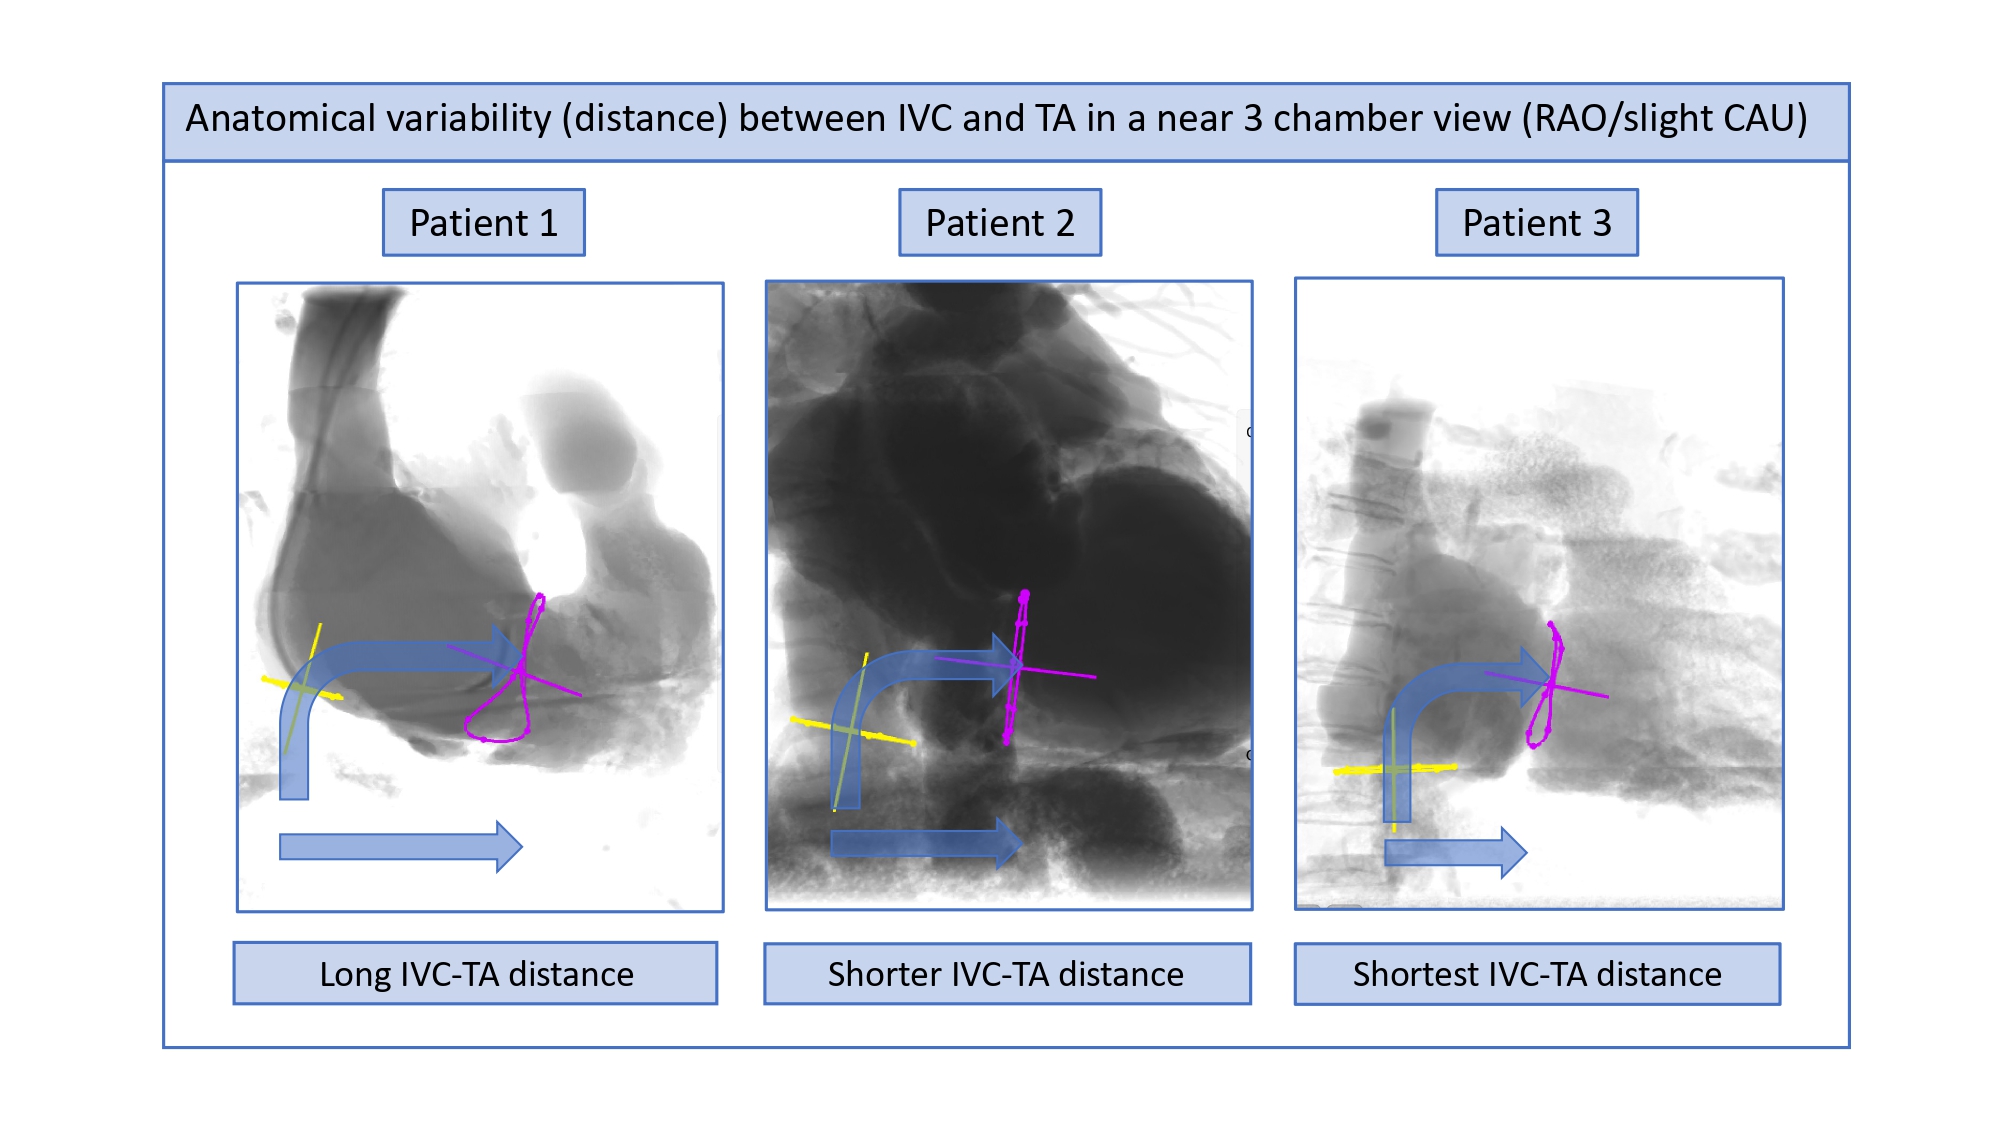
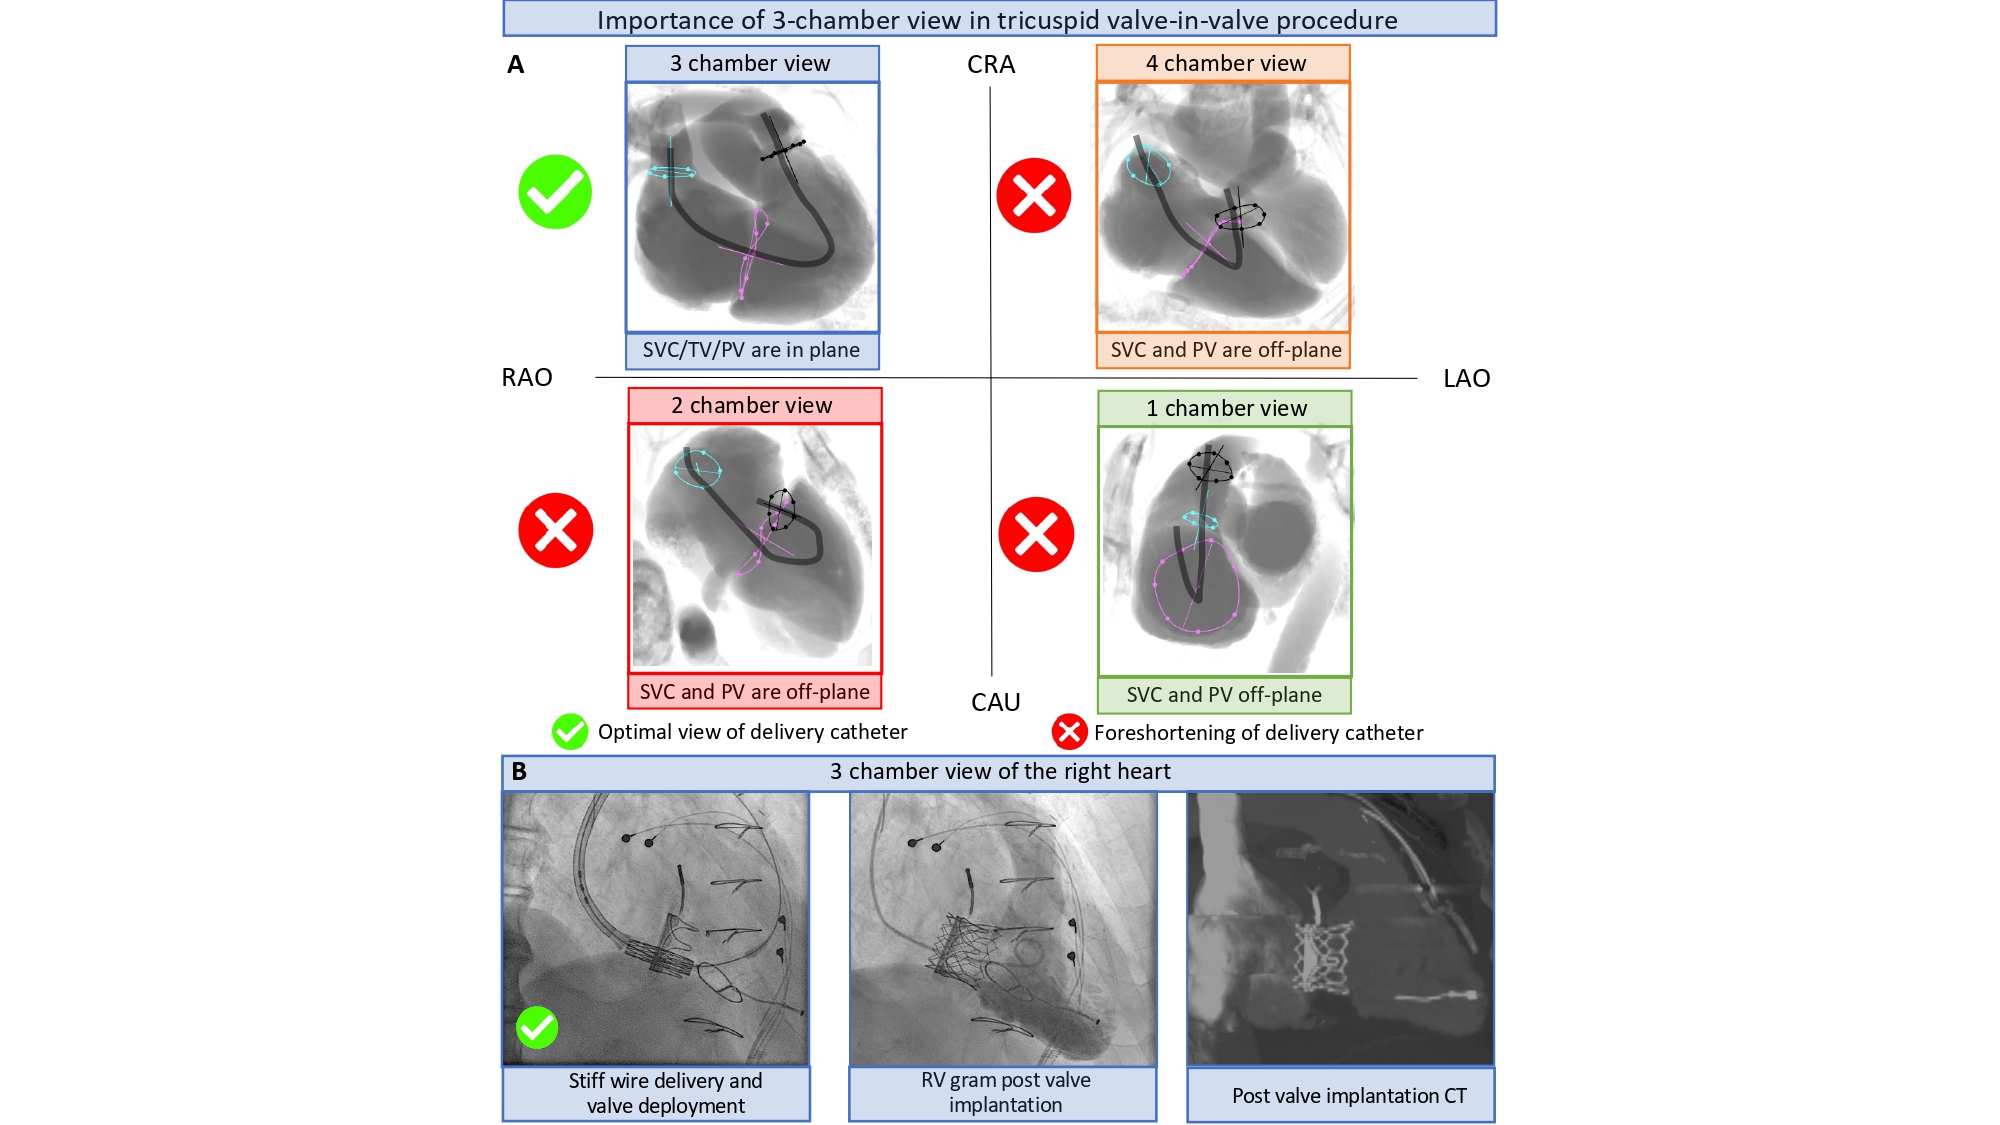
This view is obtained by placing the C-arm in a RAO CRA angulation (average fluoroscopic angulation: RAO25° CRA15°) 16. Pighi M, Thériault-Lauzier P, Piazza N. Multimodality imaging for interventional cardiologists. EuroIntervention J Eur Collab with Work Gr Interv Cardiol Eur Soc Cardiol. 2018 Aug;14(AB):AB33–9 Link, and it represents the right ventricular inflow and outflow. With the tricuspid valve in plane, it is possible to appreciate the attachments of the septal and posterior leaflets in a relative superior and inferior positioning on the fluoroscopic screen. Papillary muscles are overlapped inferiorly on the fluoroscopic screen. In this view, the right ventricular outflow tract (RVOT) is elongated and can provide the correct path from tricuspid valve to the pulmonary artery without foreshortening. Pulmonary and tricuspid valves annulus can be simultaneously in plane. This view allows to appreciate the ostium of the coronary sinus en-face. Using a near 3-chamber view (RAO with slight CAU or CRA angulation) aligns the orifice of the inferior vena cava, tricuspid and pulmonary valves in the same plane, aiding in the precise determination of the angle between these structures. This, in turn, helps to determine the appropriate catheter bending angle required for advancing it from the IVC, across the tricuspid valve, and into the RVOT.
On transesophageal echocardiography, the right-heart three-chamber view corresponds to a transgastric view at 60°- 90°.
Four-chamber (right ventricle inflow) view of the right heart
This view can be obtained by placing the C-arm in a steep CRA angulation with variable RAO/LAO angulation (average fluoroscopic angulation: LAO5° CRA60°) 16. Pighi M, Thériault-Lauzier P, Piazza N. Multimodality imaging for interventional cardiologists. EuroIntervention J Eur Collab with Work Gr Interv Cardiol Eur Soc Cardiol. 2018 Aug;14(AB):AB33–9 Link. An extreme cranial angulation with the tricuspid valve in plane allows operators to appreciate the attachments of the anterior and septal leaflets in a relative left to right positioning on the fluoroscopic screen. The four-chamber view can display the tricuspid valve annulus and atrial septum both in plane. Right and left ventricles are fully separated with elongation of the interventricular septum useful for ventricular septal defect closure. The anterior and septal papillary muscles are maximally separated in a mild RAO projection and extreme CRA angulation on the fluoroscopic screen. The four-chamber view provides a near-en-face view of the aortic valve, IVC, SVC, and right atrial appendage.
The fluoroscopic four-chamber view corresponds to the classical apical four-chamber view on transthoracic echocardiography or mid-to-low esophageal view at 0°-20° on transesophageal echocardiography.
Bicaval and right ventricle outflow tract (RVOT)-pulmonary artery view
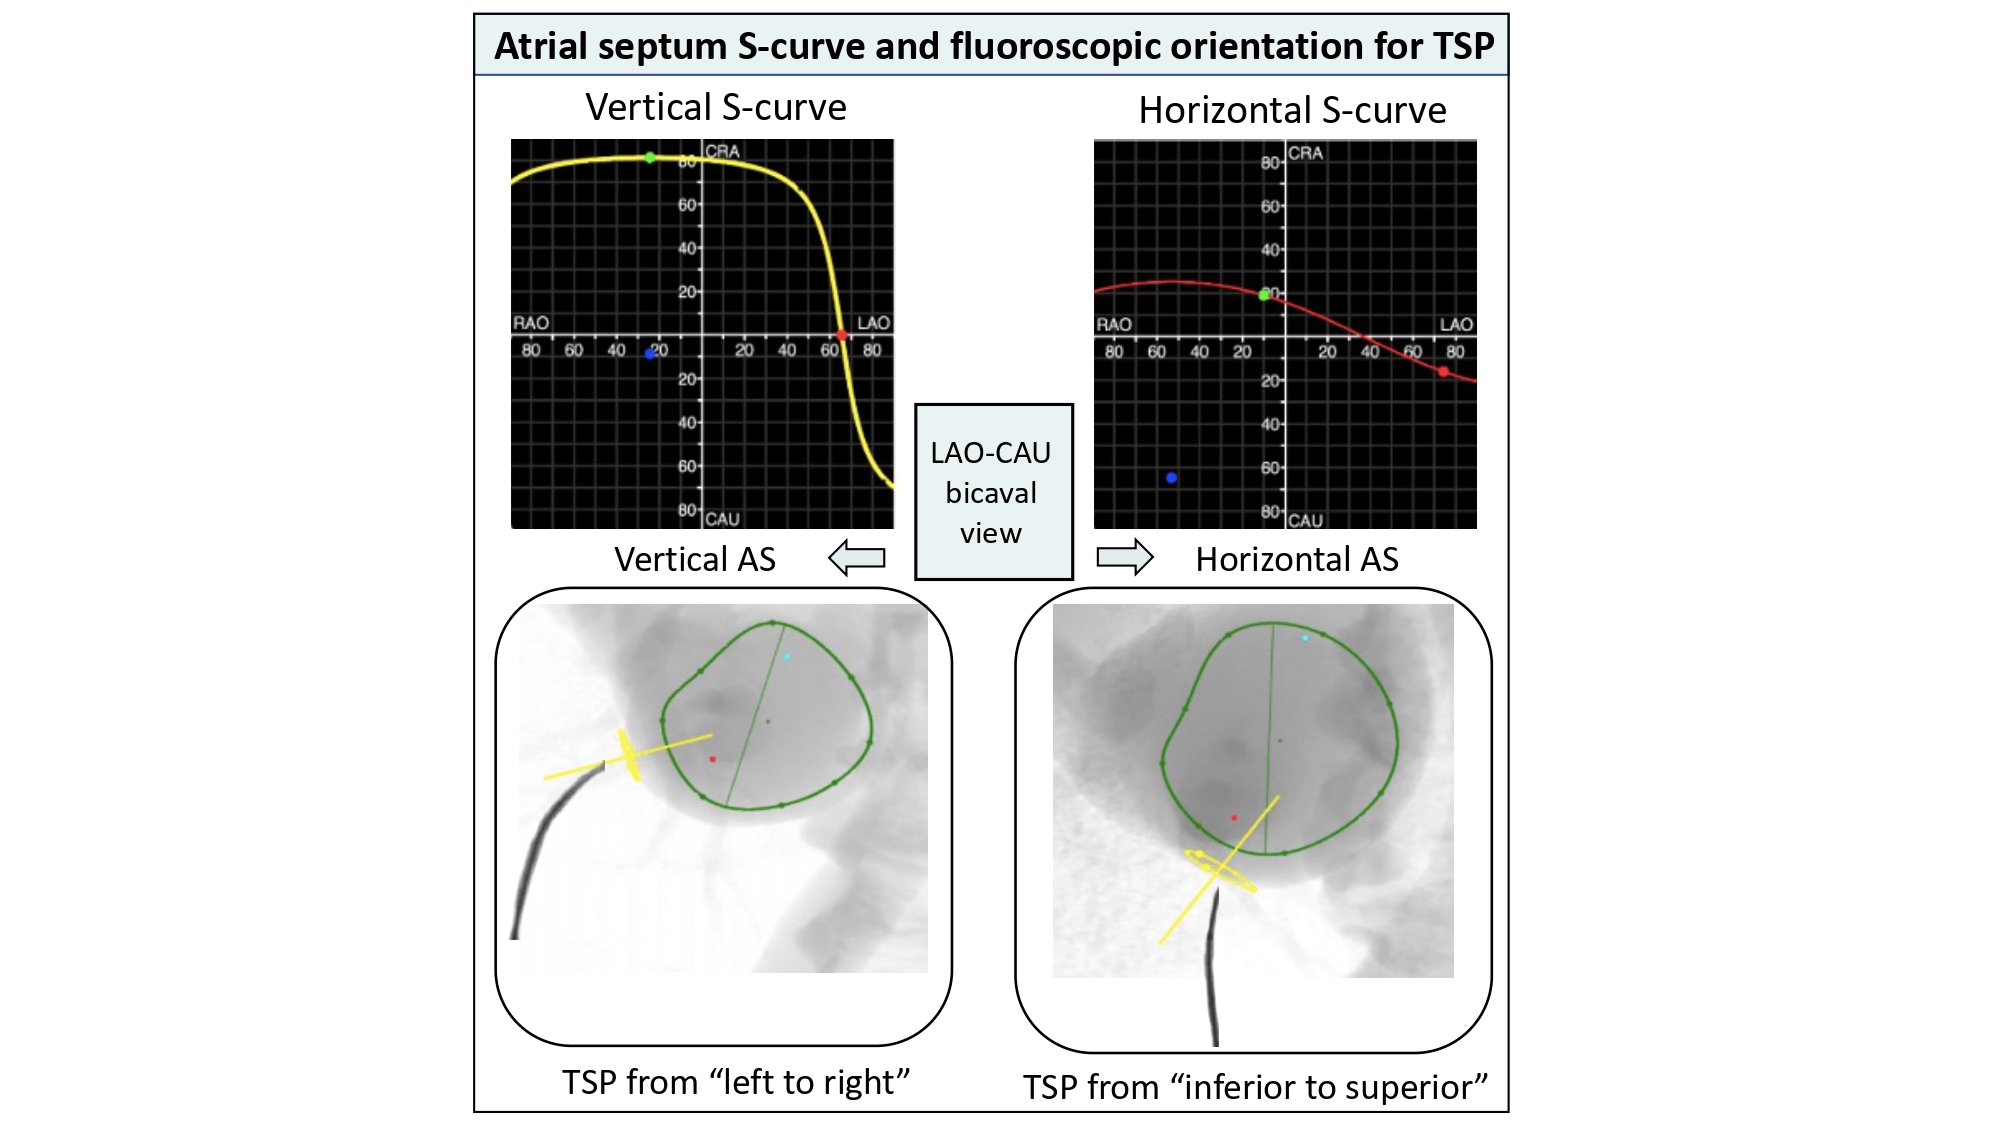
The RVOT-pulmonary artery view typically used during transcatheter pulmonary valve replacement and the bicaval view during transseptal punctures (for additional details consult part 2: transseptal puncture) can be obtained in extreme LAO projections approaching the 1-chamber view of the right or left heart (Figure 16).
During transcatheter pulmonary valve replacements, physicians often select a lateral projection with shallow CRA angulation to obtain the best views of the right ventricle-to-pulmonary artery tract (Figure 18). Similar transesophageal echocardiographic views can be obtained from a high transesophageal window at 0° or from a deep transgastric window at 70°- 90°. Oriented more to the right, the bicaval view can be appreciated from a modified subcostal transthoracic view or from the classical mid- transesophageal bicaval view at 90°-110°.
Figure 18
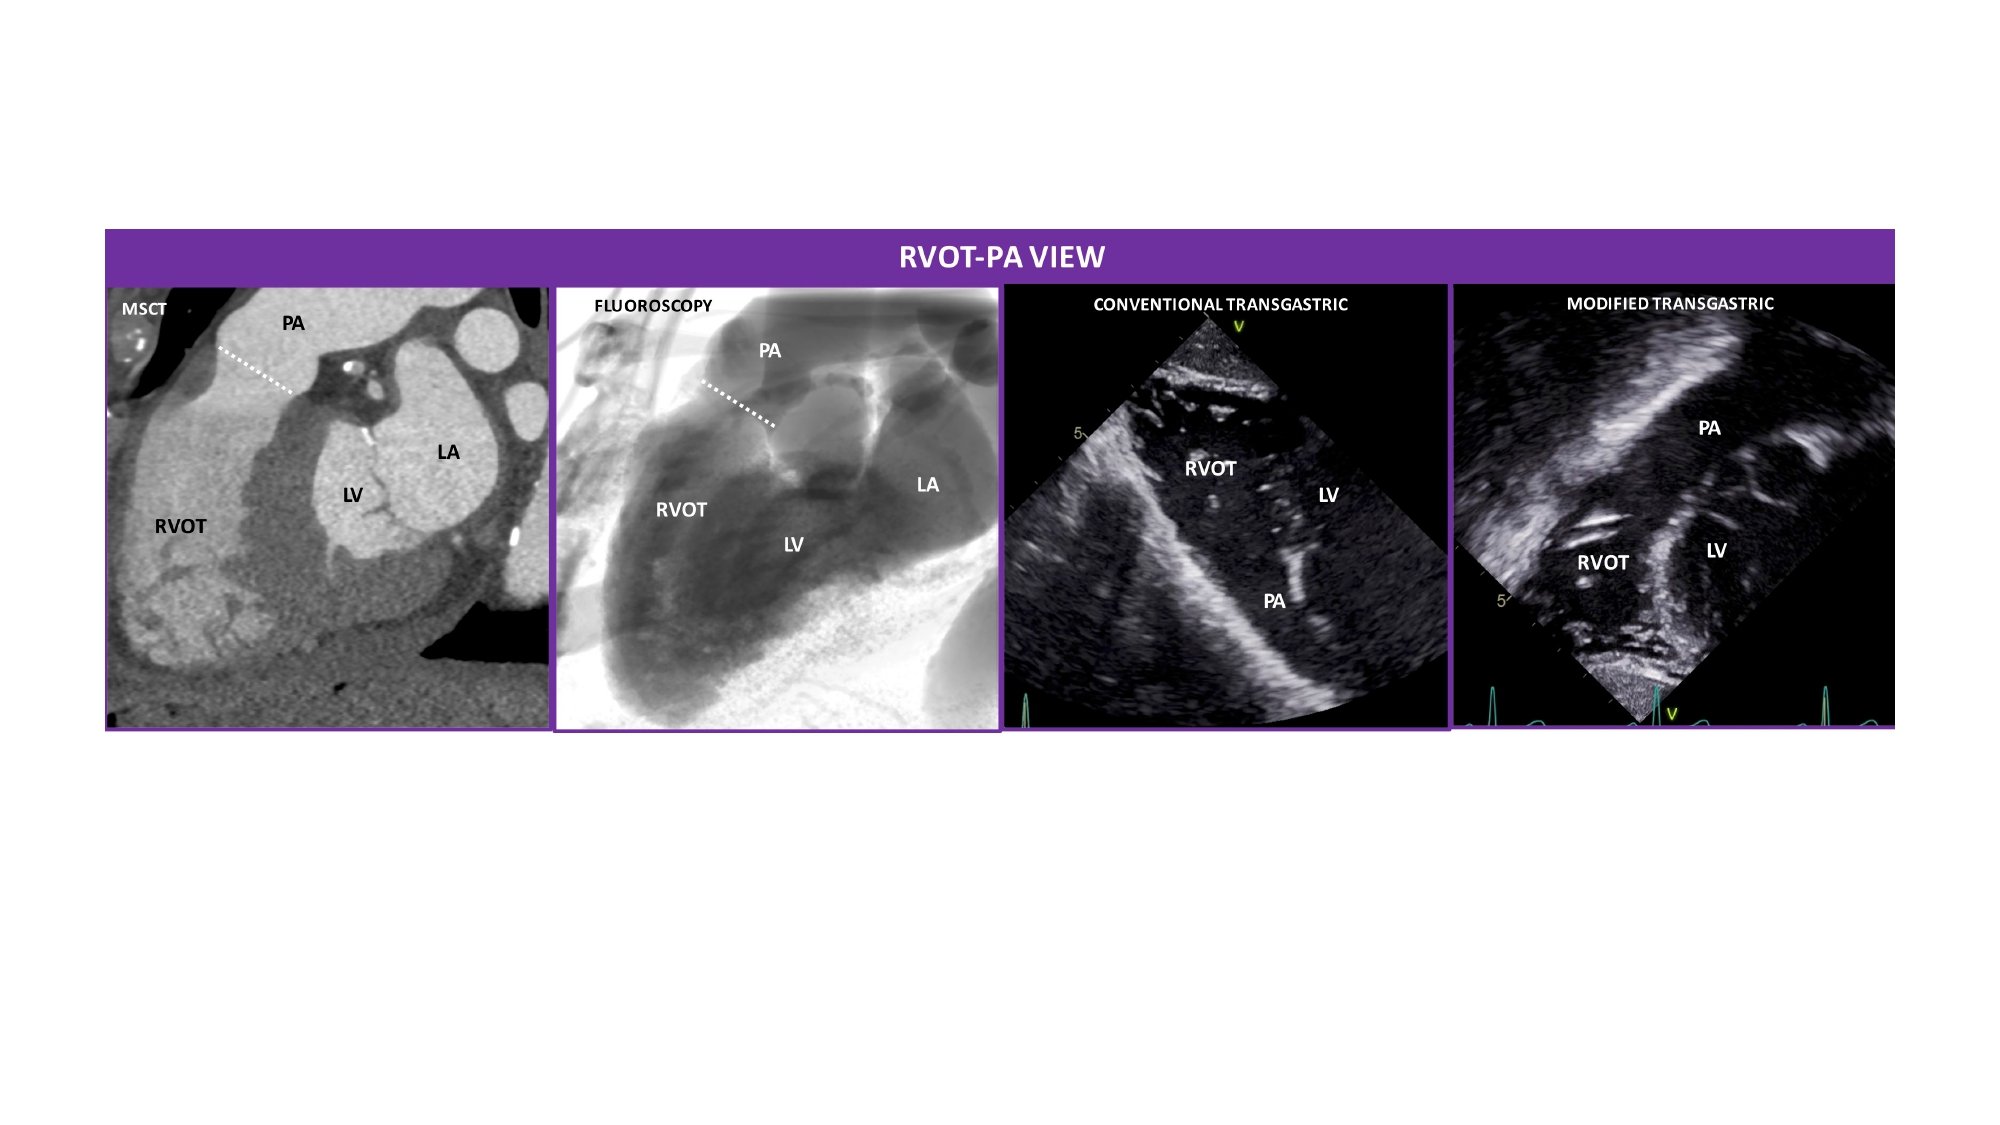
Right ventricle outflow tract (RVOT)-pulmonary artery view. MSCT, fluoroscopic, conventional and modified transthoracic echocardiographic views of the RVOT and PA. The RVOT and the PA appear elongated and separated by the annulus of the pulmonary valve (PV) (white dotted line). The fluoroscopic is obtained by angulating the C-arm in a LAO90°/CRA10° projection. The conventional transgastric view was flipped upside-down to reproduce the MSCT and fluoroscopic views.
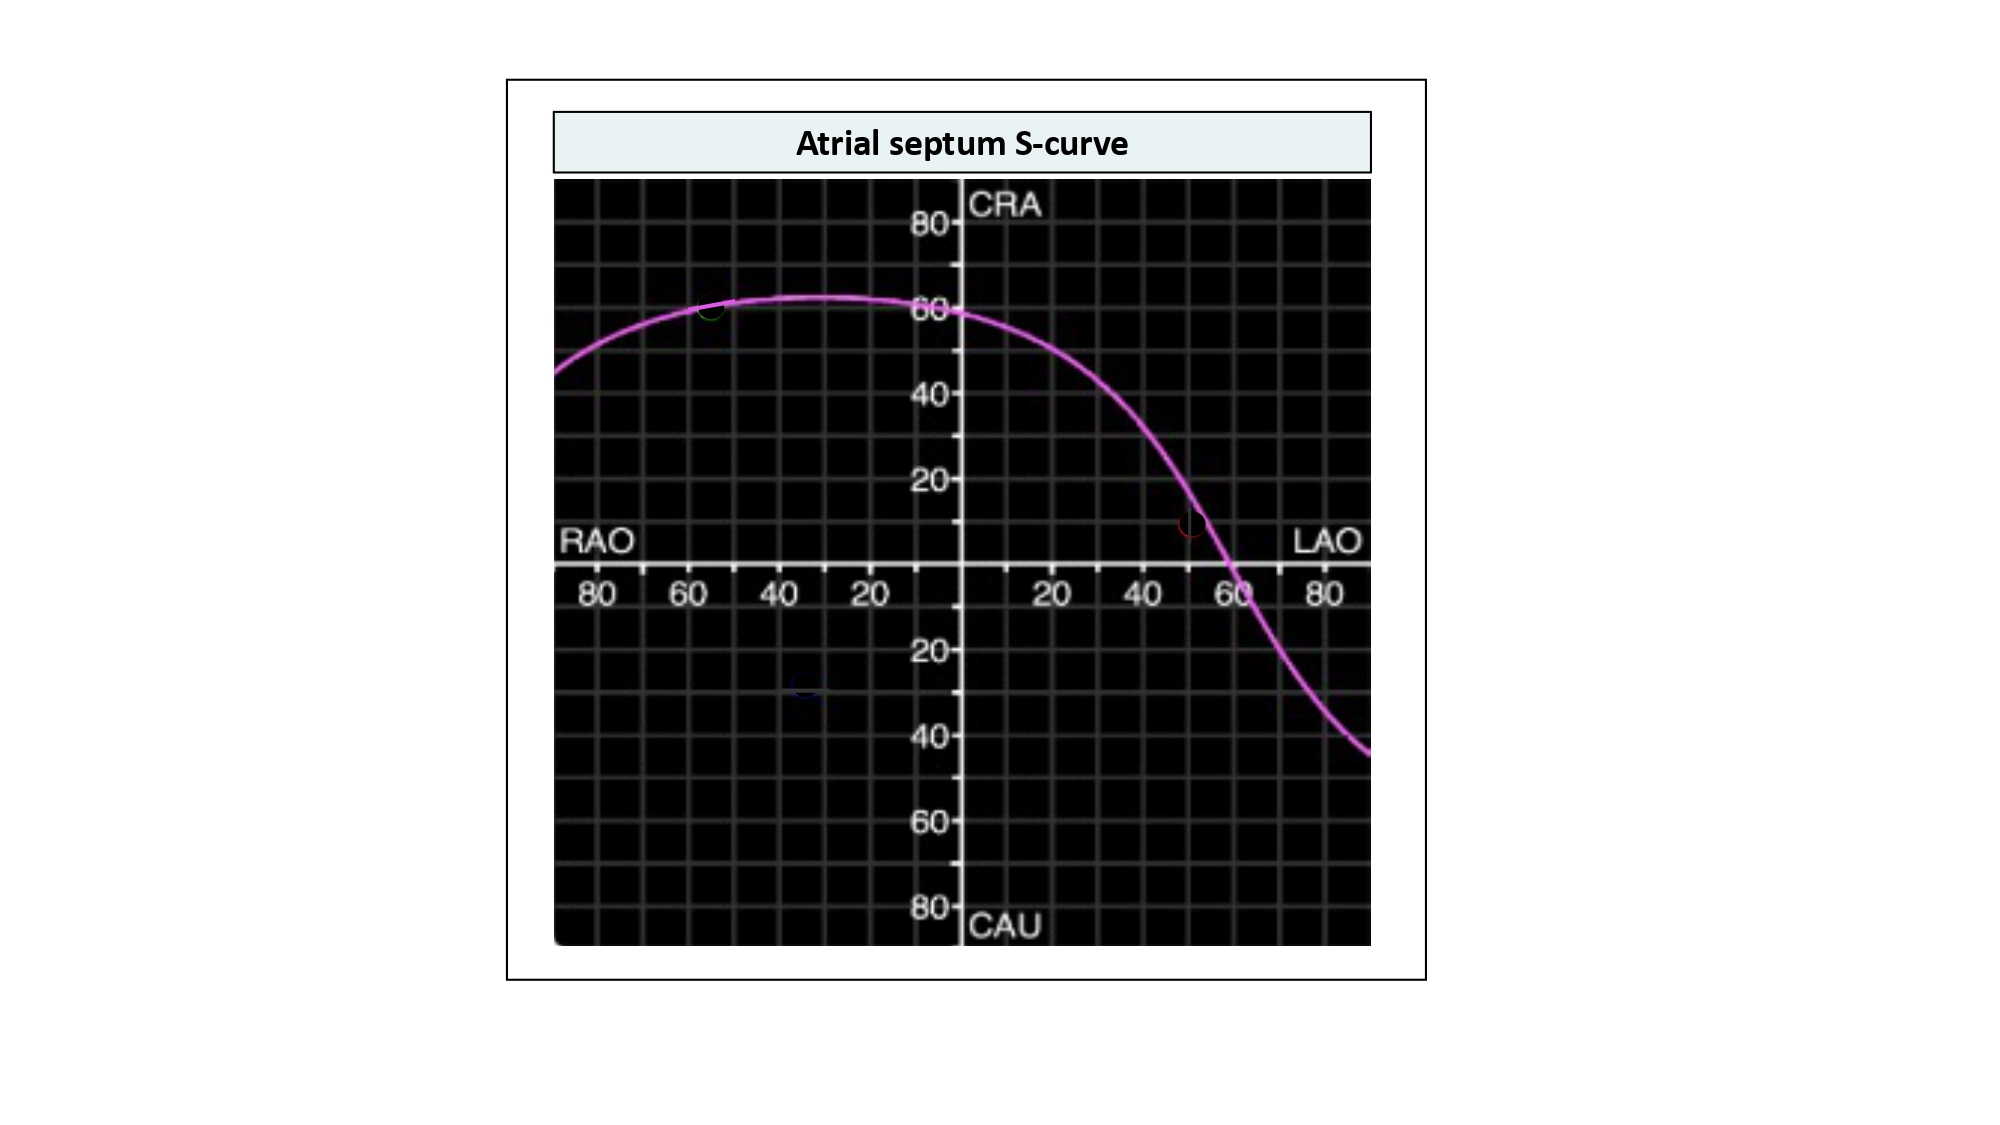
While fluoroscopic chamber views might facilitate pattern recognition for structural interventions, the orientation of cardiac structures can vary somewhat among patients. Nonetheless, cardiac structures, similar to coronary arteries, can be found in consistent fluoroscopic quadrants across patients. The utilization of 3D tomographic images for procedural planning allows per-patient individualized mapping of cardiac structures. Accordingly, specific fluoroscopic working angles might be planed based on anatomical and procedural characteristics. As mentioned above, an optimal fluoroscopic angle is such that the vector joining the x-ray source and the detector is orthogonal to the vector of the structure of interest (i.e. the en-face/axial view of the structure). Each CRA CAU angulation of the C-arm can be adjusted by a corresponding RAO LAO angulation maintaining orthogonality with the structure of interest. The optimal projection curve, also referred to “the line of perpendicularity” is a S-shaped curve consisting of continuous pairs of optimal C‐arm angulations (RAO LAO vs. CRA CAU) where a given structure is in plane. Table 1 lists the characteristics of an S-curve, which can be obtained for any cardiac structure with a representative plane (e.g., aortic valve, mitral valve, tricuspid valve, pulmonary valve, superior vena cava, inferior vena cava, coronary sinus, atrial septum, LVOT, or coronary ostia).
Table 1. The "10 commandments" of the Optimal Projection Curve (S-curve)
1. The optimal projection curve is an S-shaped curve consisting of continuous pairs of optimal C‐arm angulations for a given structure. For each LAO and RAO projections, there's a corresponding CRA or CAU angulation, where the structure of interest is in-plane.
2. The optimal projection curve can be obtained for any cardiac structure that can be defined by a plane (e.g., superior vena cava, inferior vena cava, coronary sinus, tricuspid valve, pulmonary valve, pulmonary arteries, pulmonary veins, mitral valve, aortic valve, coronary arteries).
3. Designated CT software can calculate the S-curve from a closed-spline tracing of the structure. Additional methods include obtaining 2 fluoroscopic viewing angles of a structure in plane, or 1 fluoroscopic viewing angle of a structure en-face and imputing these viewing angles into a software calculator.
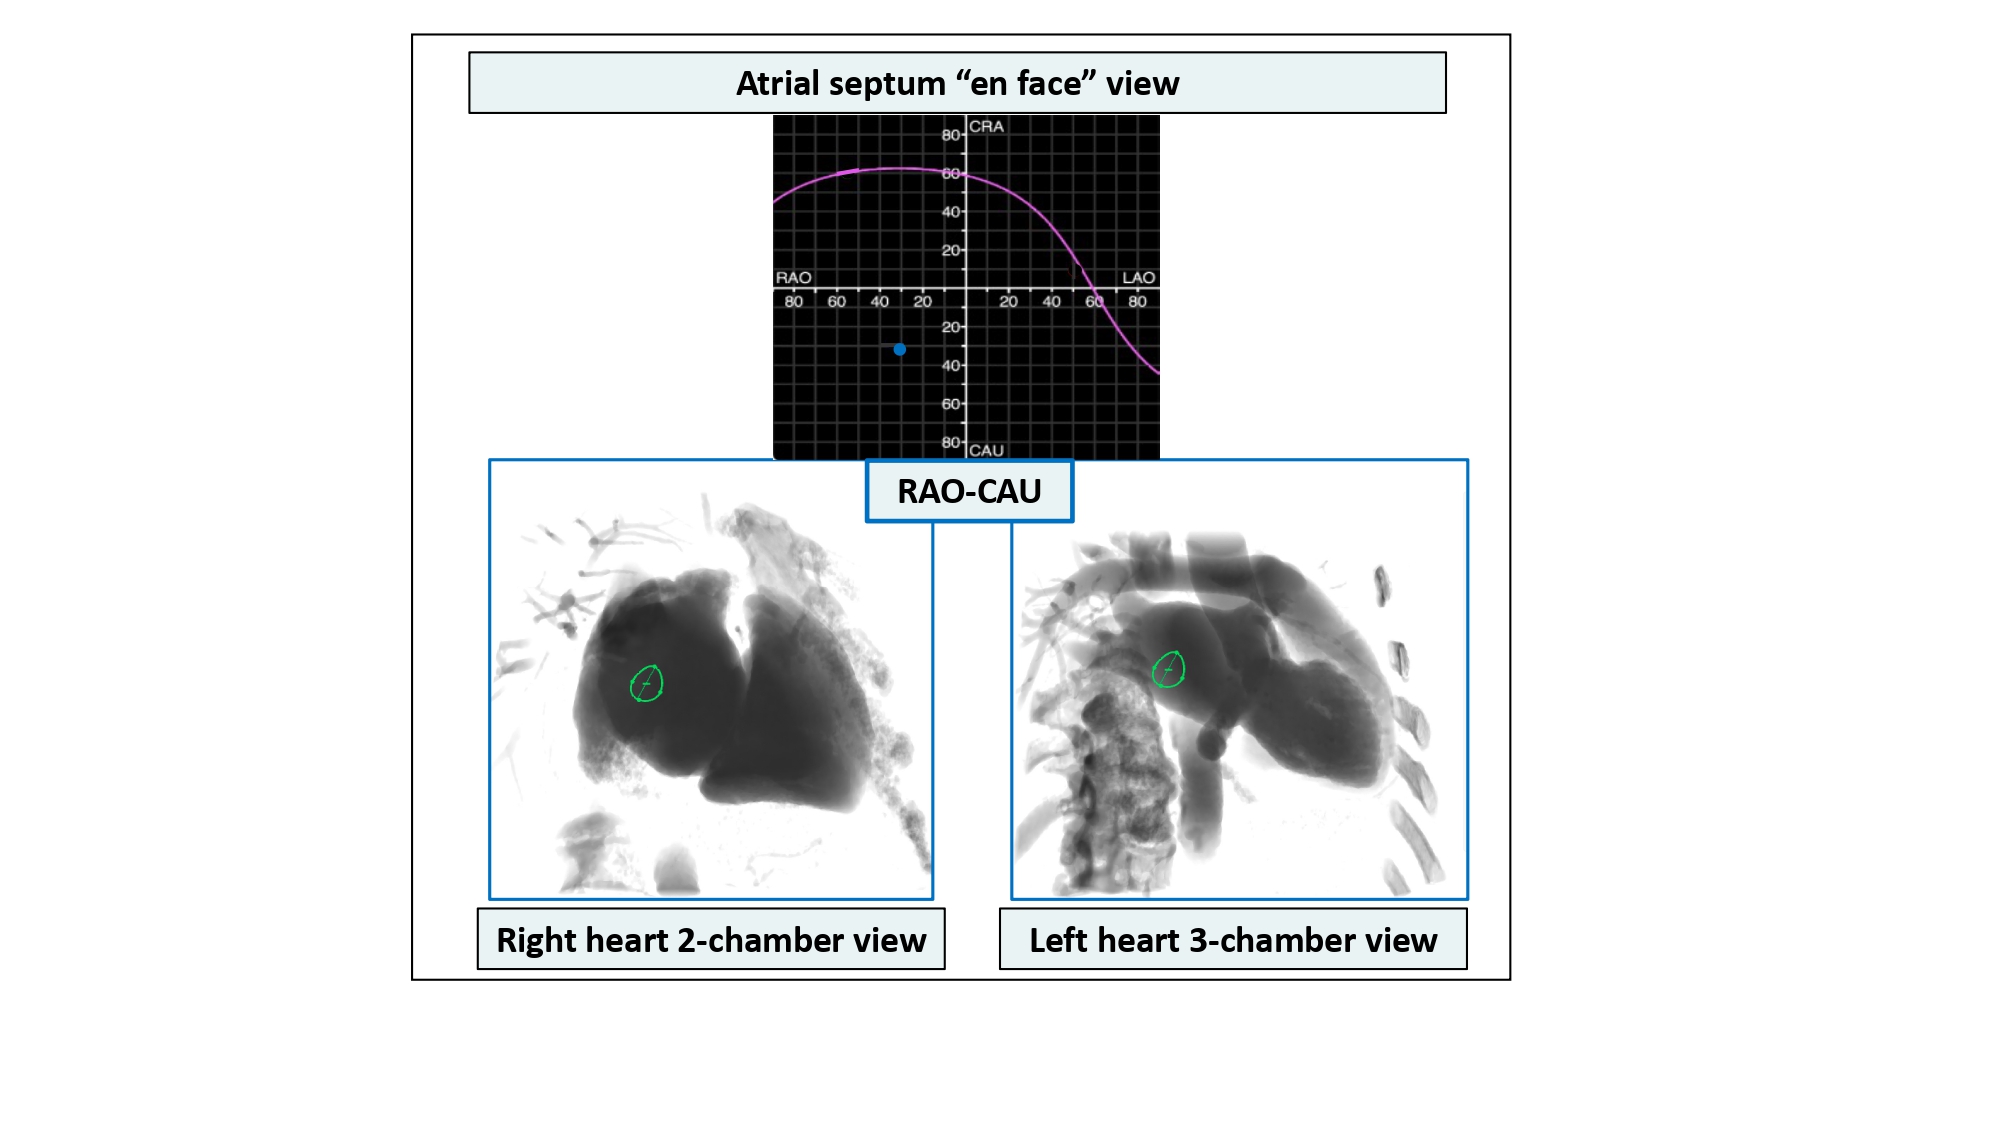
4. An optimal projection curve always intersects three quadrants, where the structure of interest will appear in-plane. The fluoroscopic quadrant that the S-curve does not intersect, however, is where the structure appears en-face or in short-axis.
5. The en-face fluoroscopic viewing angle is intricately related to the shape of the S-curve. Displacement of the en-face view has a direct effect on the shape of the S-curve.
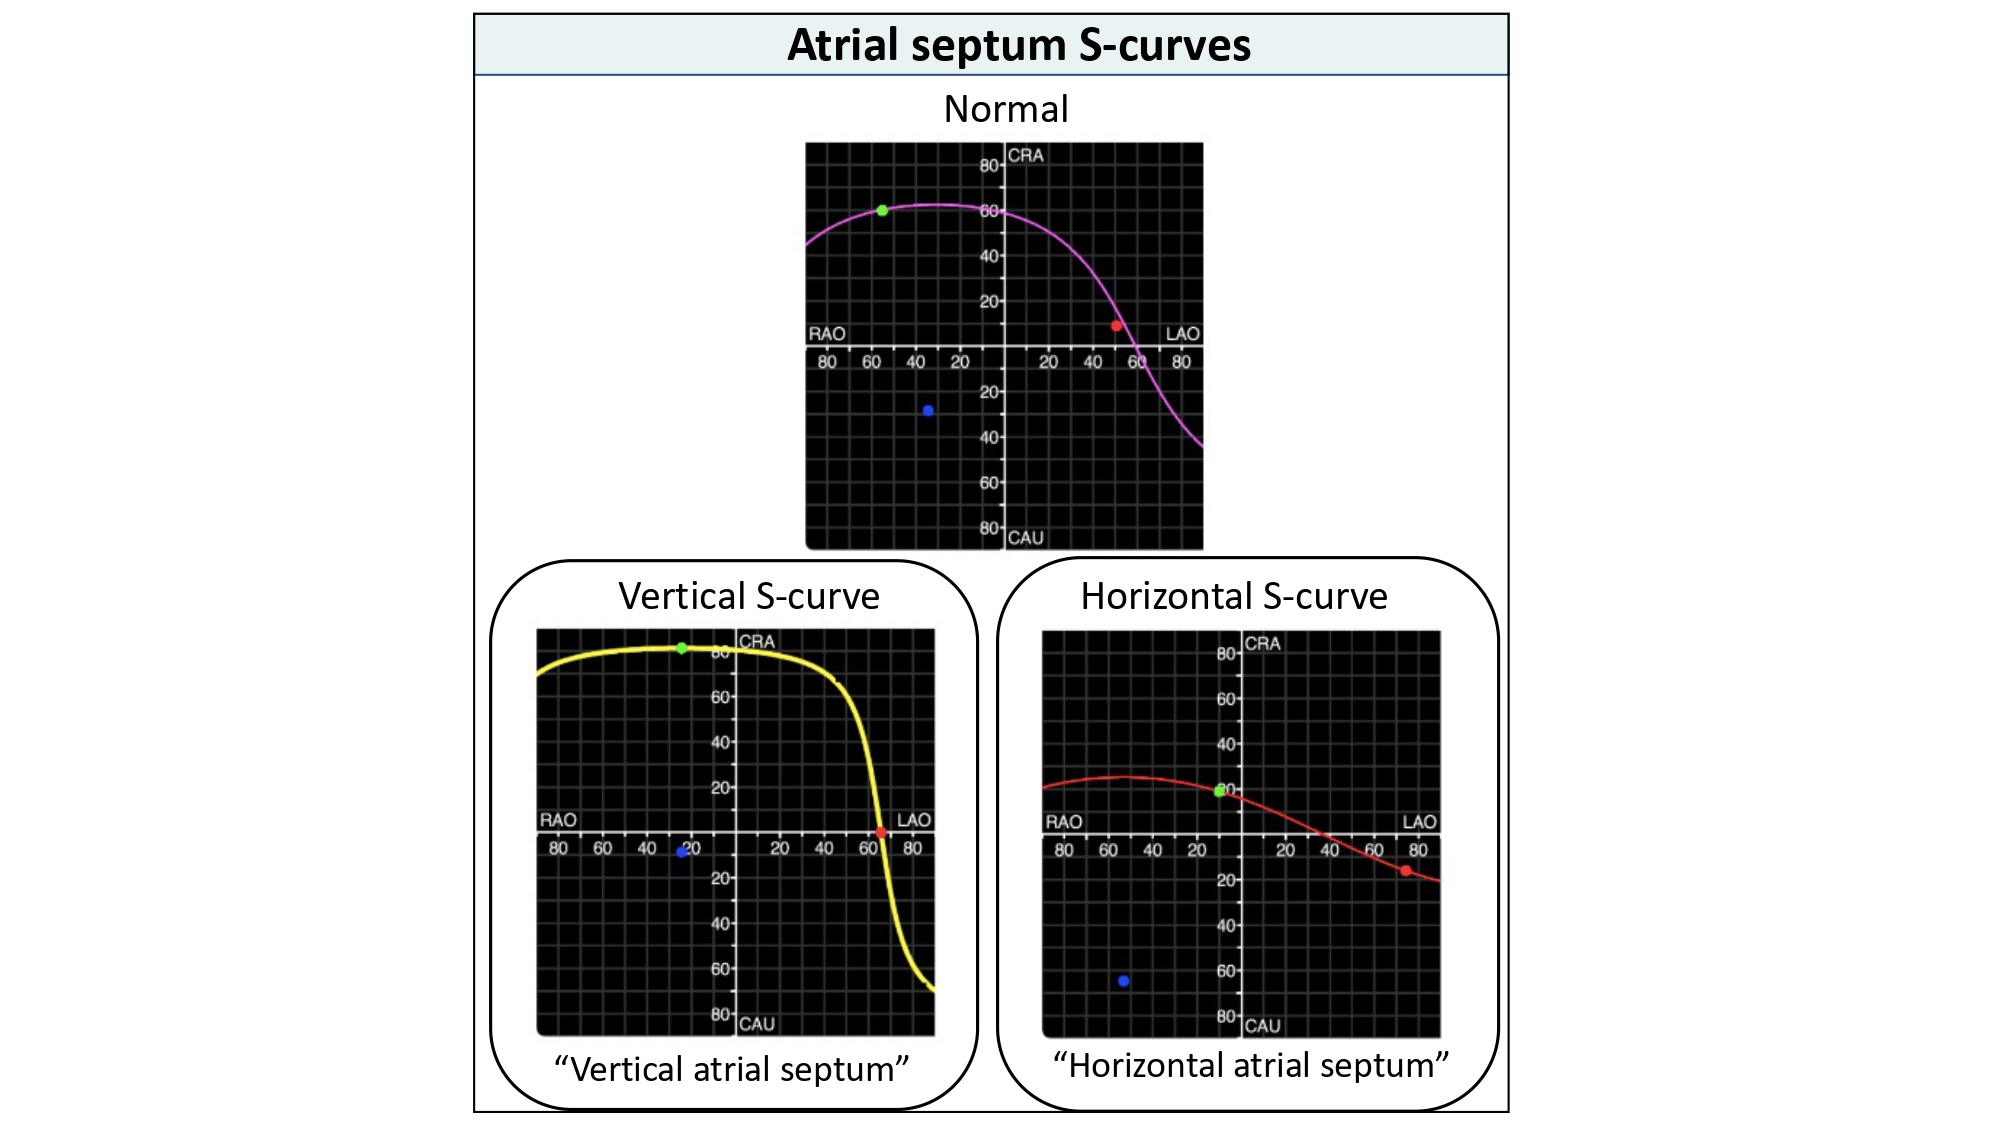
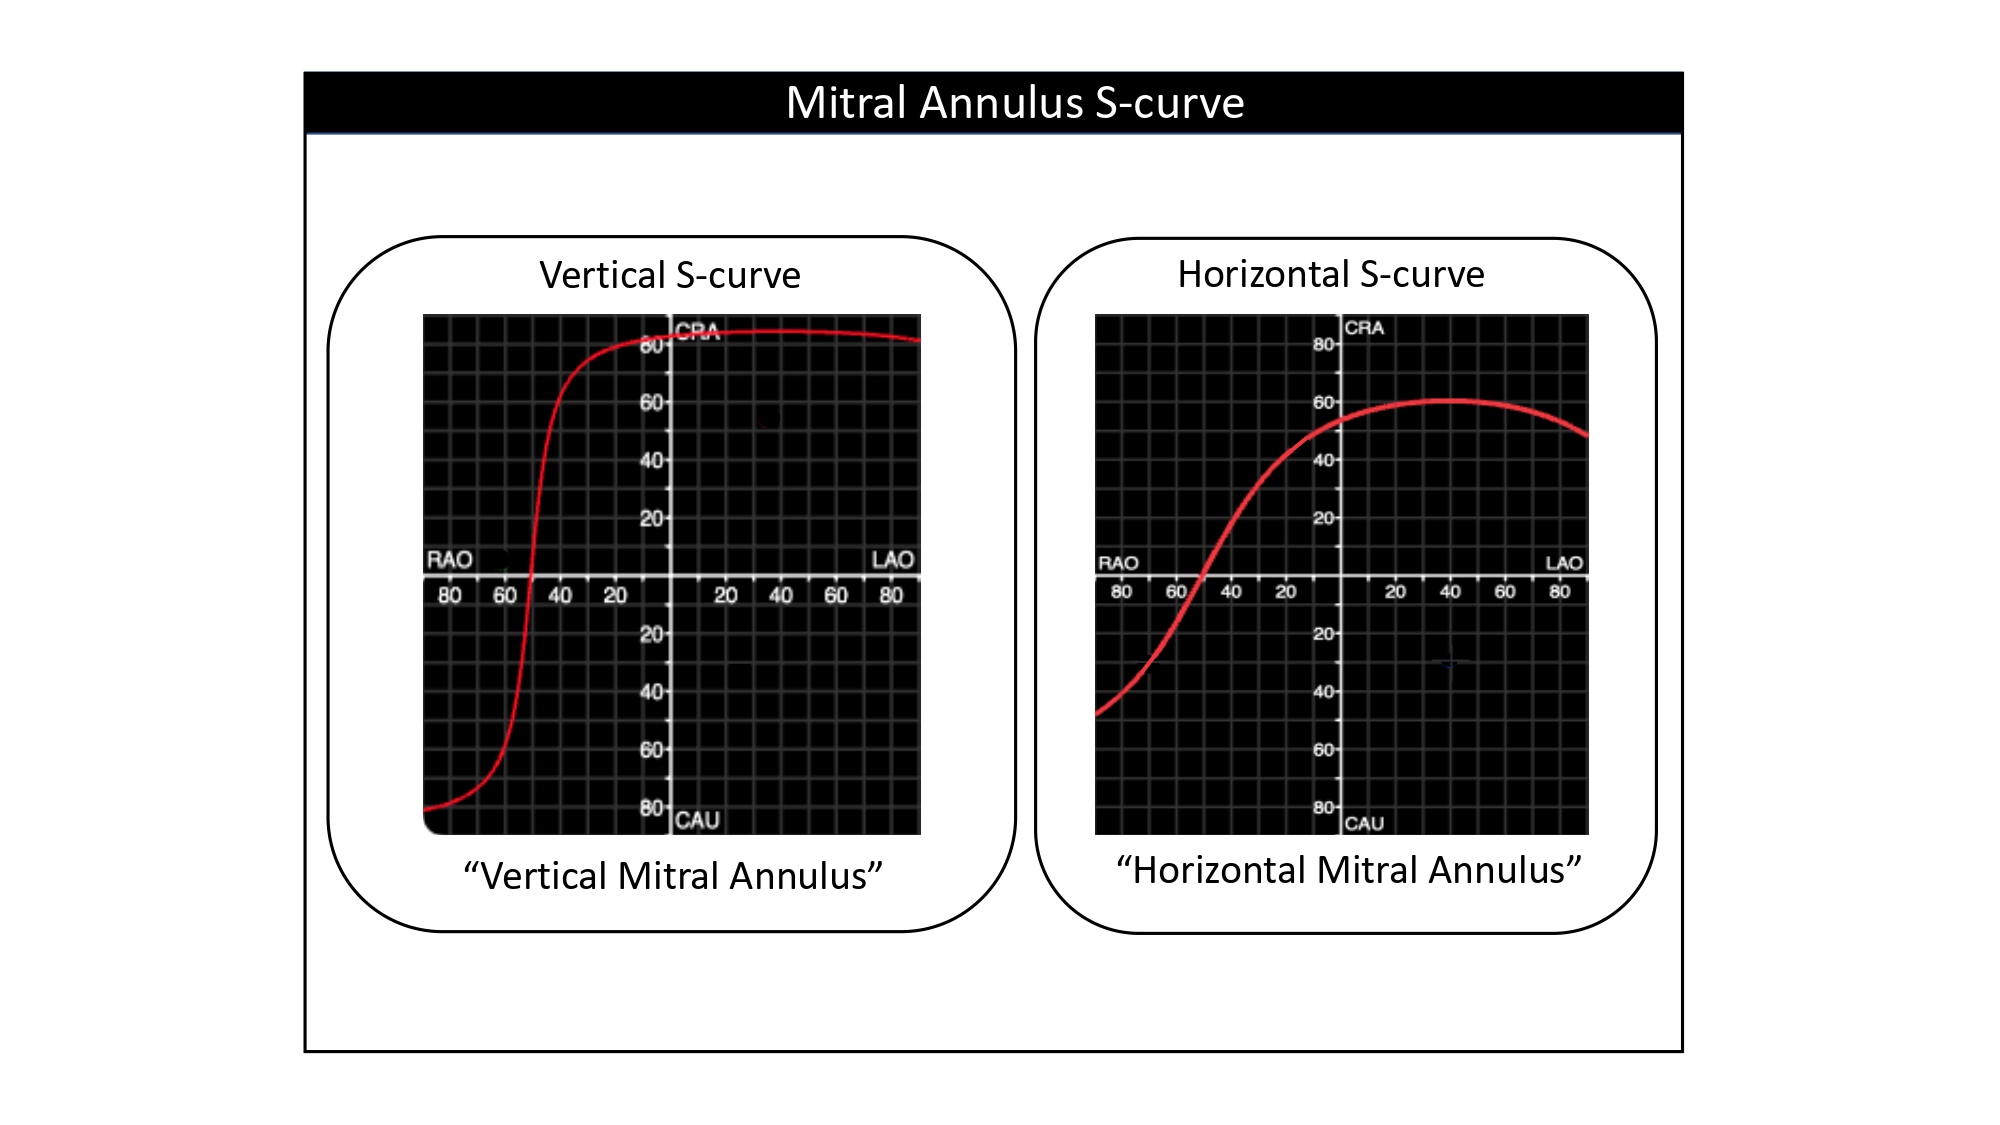
6. The relative shape of an S-curve (horizontal or vertical) describes the orientation of the structure in the body i.e., vertical S-curve indicates vertical structure, horizontal S-curve indicates horizontal structure.
7. The direction of the tangent to any point on the S-curve describes the orientation of the structure on the fluoroscopic screen.
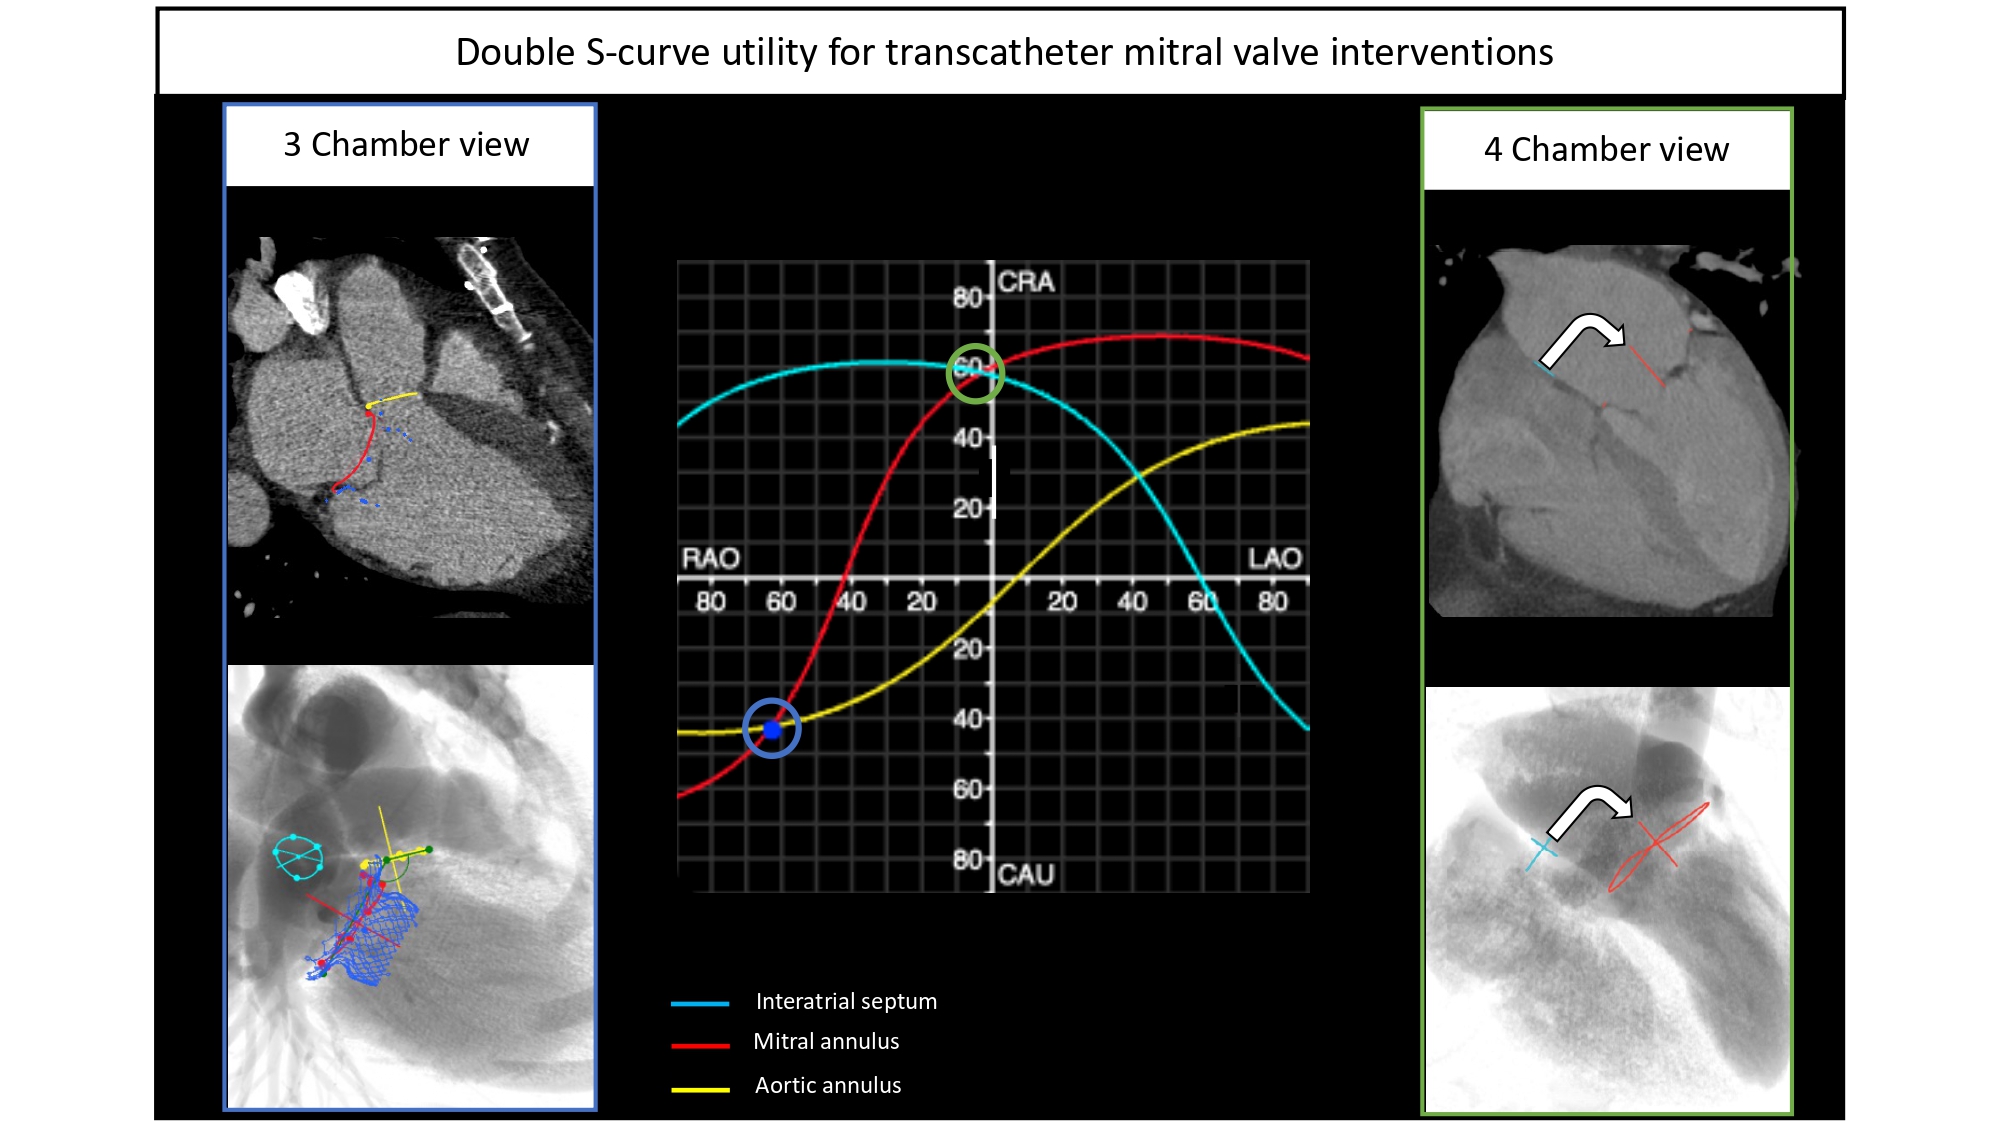
8. The intersection point between 2 S-curves describes the fluoroscopic viewing angle where both structures are in plane.
9. The S-curves of 2 structures with similar orientations (or angulations) will be similar and potentially overlapped if identical.
10. The area between 2 S-curves is directly related to the angle between the 2 structures (the greater the area, the greater the angle)
CT= computed tomography; LAO= left anterior oblique; RAO= right anterior oblique; CRA= cranial; CAU= caudal.
Optimal projection curves for any cardiac structure or cardiac device can be calculated by designated software using a mathematical model described in (Figure 19)13. Tzikas A, Schultz C, Van Mieghem NM, de Jaegere PPT, Serruys PW. Optimal projection estimation for transcatheter aortic valve implantation based on contrast-aortography: validation of a Prototype Software. Catheter Cardiovasc Interv Off J Soc Card Angiogr Interv. 2010 Oct;76(4):602–7 Link. Optimal projection curves differ from one structure to another depending on spatial orientation (Figure 20). Of note, the point of intersection between two S-curves represents C-arm coordinates in which the two structures are projected in plane. In other words, the optimal projection curve removes or mitigates the parallax of one or more structures (or cardiac devices) and allows for a more accurate geometric understanding between structures of interest.
Figure 19
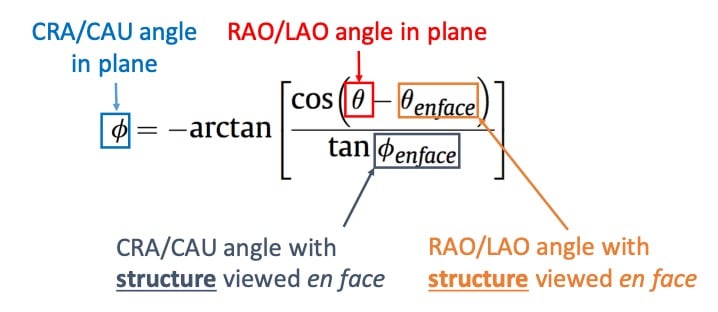
Equation defining an optimal projection curve. Given an en-face viewing angle of a structure, it is possible to derive an optimal projection curve representing all the combinations of view angles in which the structure is seen in plane (perpendicular to its axis of symmetry) by the shown equation where: ∅ is the cranio-caudal angle of the optimal projection curve at RAO/LAO angle θ and; ∅ en-face and θ en-face are respectively the CRA/CAU and RAO/LAO angles of the structure viewed en-face. Alternatively, optimal projection curves can be generated from two random perpendicular views of the structure, instead of one en-face view.
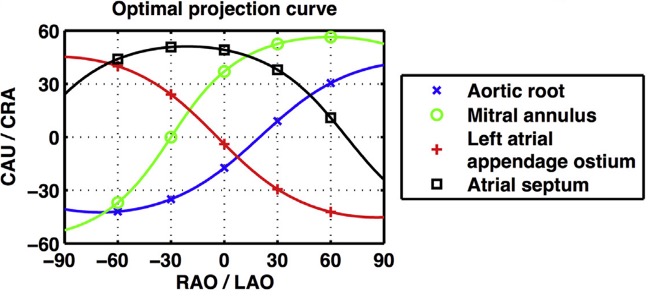
Optimal projection curves. An optimal projection curve is a S-shaped curve consisting of continuous pairs of optimal C-arm projections in which the structure appears in plane (i.e. perpendicular to the operator). Optimal projection S-curves varies between different structures depending on their spatial orientation. Intersection points of two S-curves represents C-arm coordinates in which the two structure are projected in plane.
Optimal projection curves can be used for the planning of structural and coronary procedures. For instance, tracing the en-face view of the aortic annulus on MSCT permits instant generation of the optimal projection or S-curve by automated software. The S-curve will provide the operator with all viewing angles of the aortic annulus in plane and is critical for correct transcatheter aortic valve implantation depth. A similar approach can be adopted for any intervention that consists of placing a device across an anatomical structure [e.g., left atrial appendage closure, transcatheter mitral/pulmonary valve replacement, ostial left main or right coronary artery stenting].
Cardiac structures with similar orientations in the body (e.g., mitral and tricuspid valve or left atrial appendage and atrial septum) will have similarly shaped S-curves. Any S-curve can only intersect 3 of the 4 fluoroscopic quadrants – the non-intersecting quadrant defines the structure en-face or in short-axis while the 3 intersecting quadrants have the structure in plane. The distance between 2 structures’ S-curves describes the relative angle between the planes of the 2 structures. Thus, 2 structures with overlapping S-curves lie in the same plane. On the other hand, 2 structures with S-curves at right angle, would suggest that the 2 planar structures lie at 90 degrees to each other.
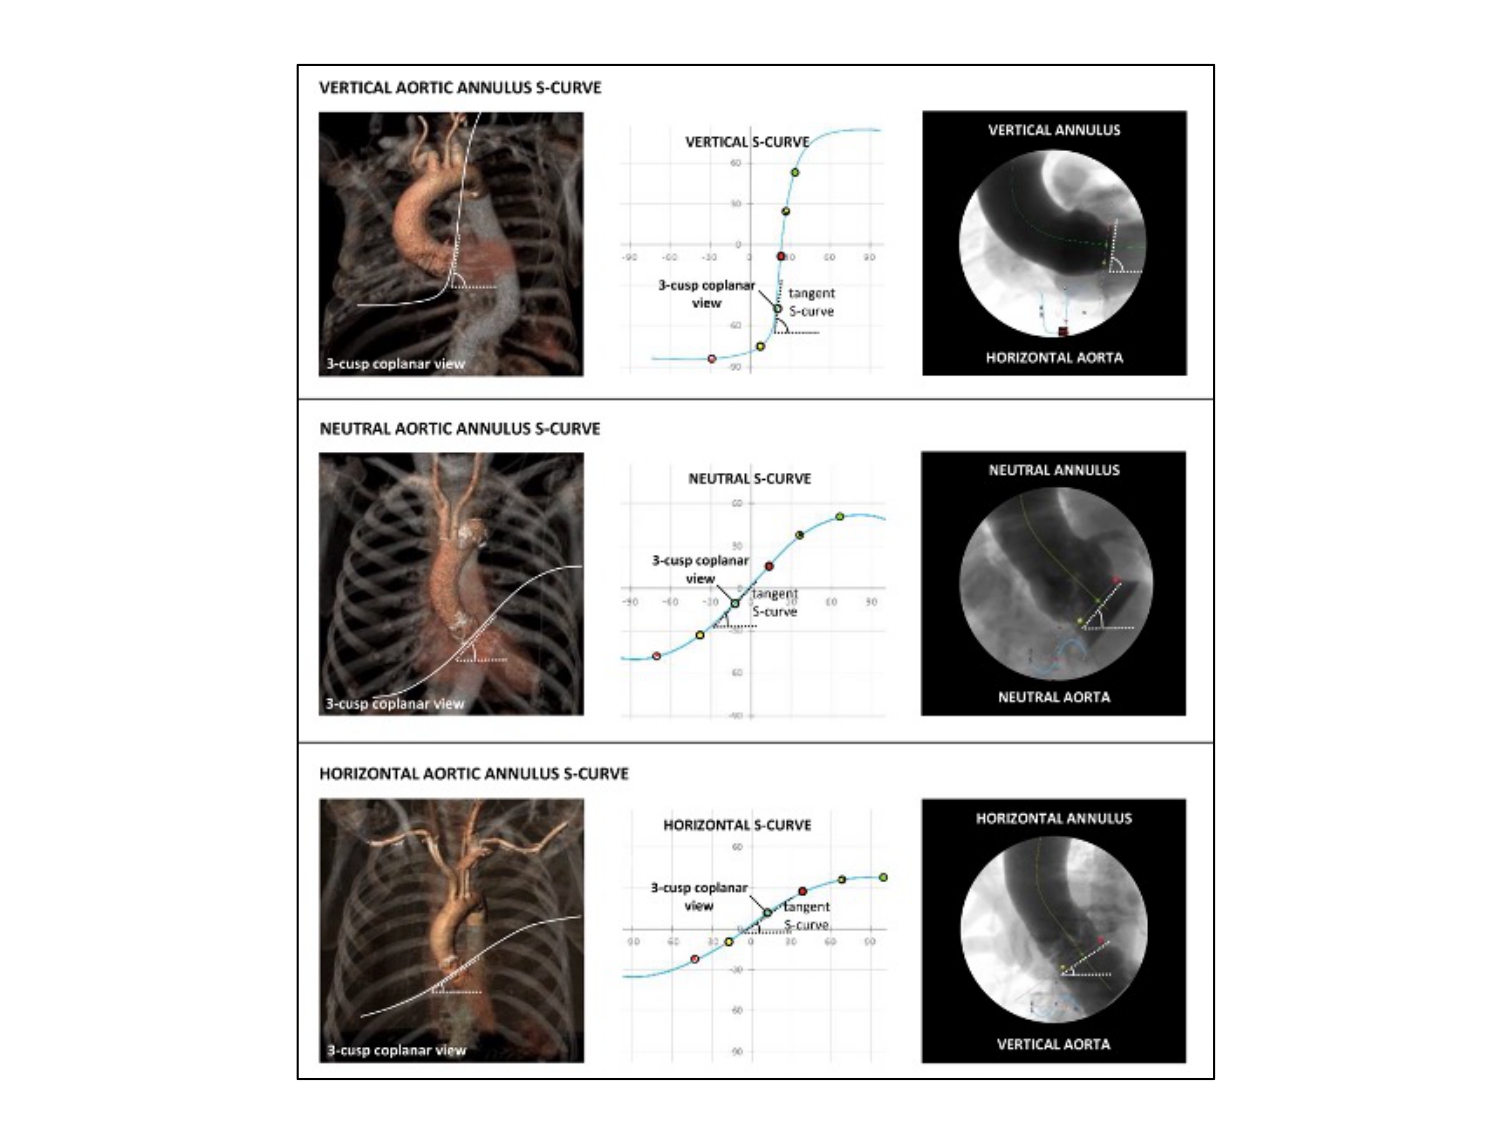
Furthermore, the shape of an S-curve provides valuable information about the orientation of the structure in the body. For example, a vertical annulus synonymous with a horizontal root will be associated with a more vertical S-curve whereas a horizontal annulus synonymous with a vertical root will be associated with a more horizontal S-curve (Figure 21). The orientation of the tangent to the S-curve will simulate the orientation of the plane of the structure on the fluoroscopic screen. In other words, a "horizontal" S-curve will produce "horizontal" tangents and therefore the orientation of the structure will lie horizontal on the fluoroscopic screen (Figure 21). It is possible, therefore, that the orientation of the cardiac structure ("horizontal" vs. "vertical") varies according to C-arm angulations depending on the changing slope of the S-curve. This information can help the operator to better understand the orientation of cardiac structures across the fluoroscopic grid.
Figure 21
The slope of the S-curve represented by the aortic annulus. The shape and slope of a structure-specific S-curve is determined by the orientation of this particular structure in the body. A steep slope of the aortic annulus S-curve defines a vertical annulus plane, whereas a shallow slope defines a horizontal annulus plane. The middle scenario represents the most common situation where the S-curve has a more ‘neutral’ slope .
Fluoroscopic anatomy and its implications for transcatheter structural interventions
PART 1 - AORTIC VALVE INTERVENTIONS 19. Zgheib A, Campens L, Abualsaud A, Al Isma’ili A, Barbanti M, Dvir D, Gada H, Granada JF, Latib A, Leipsic J, Maisano F, Martucci G, Medina de Chazal HA, Modine T, Mylotte D, Prendergast B, Sawaya F, Spaziano M, Tang G, Theriault-Lauzier P, Tchetche D, van Mieghem N, Søndergaard L, De Backer O, Piazza N. Aortic Annulus S-Curve: Implications for Transcatheter Aortic Valve Replacement and Related Procedures, Part 1. JACC Cardiovasc Interv. 2022 Dec;15(23):2353–73 Link
Aortic root anatomy/aortic annulus s-curve
The aortic root is the continuation of the LVOT, extending from the basal attachment points of the aortic valve leaflets to their peripheral attachment at the level of the sinotubular junction. It is made of three components: 1) the valvular leaflets; 2) the fibrous interleaflet triangles; and 3) the sinuses of Valsalva. The three leaflets form the limits of the right, left, and non-coronary aortic sinuses. The aortic valve annulus is defined as the planar ring of tissue that unites the basal attachment points of the three aortic valve leaflets.
Obtaining the aortic annulus in-plane is critical for transcatheter aortic valve implantation (TAVI) implantation depth and ancillary procedures such as commissural alignment, coronary access post-TAVI, BASILICA (bioprosthetic or native aortic scallop intentional laceration to prevent iatrogenic coronary artery obstruction), and paravalvular leak closure.
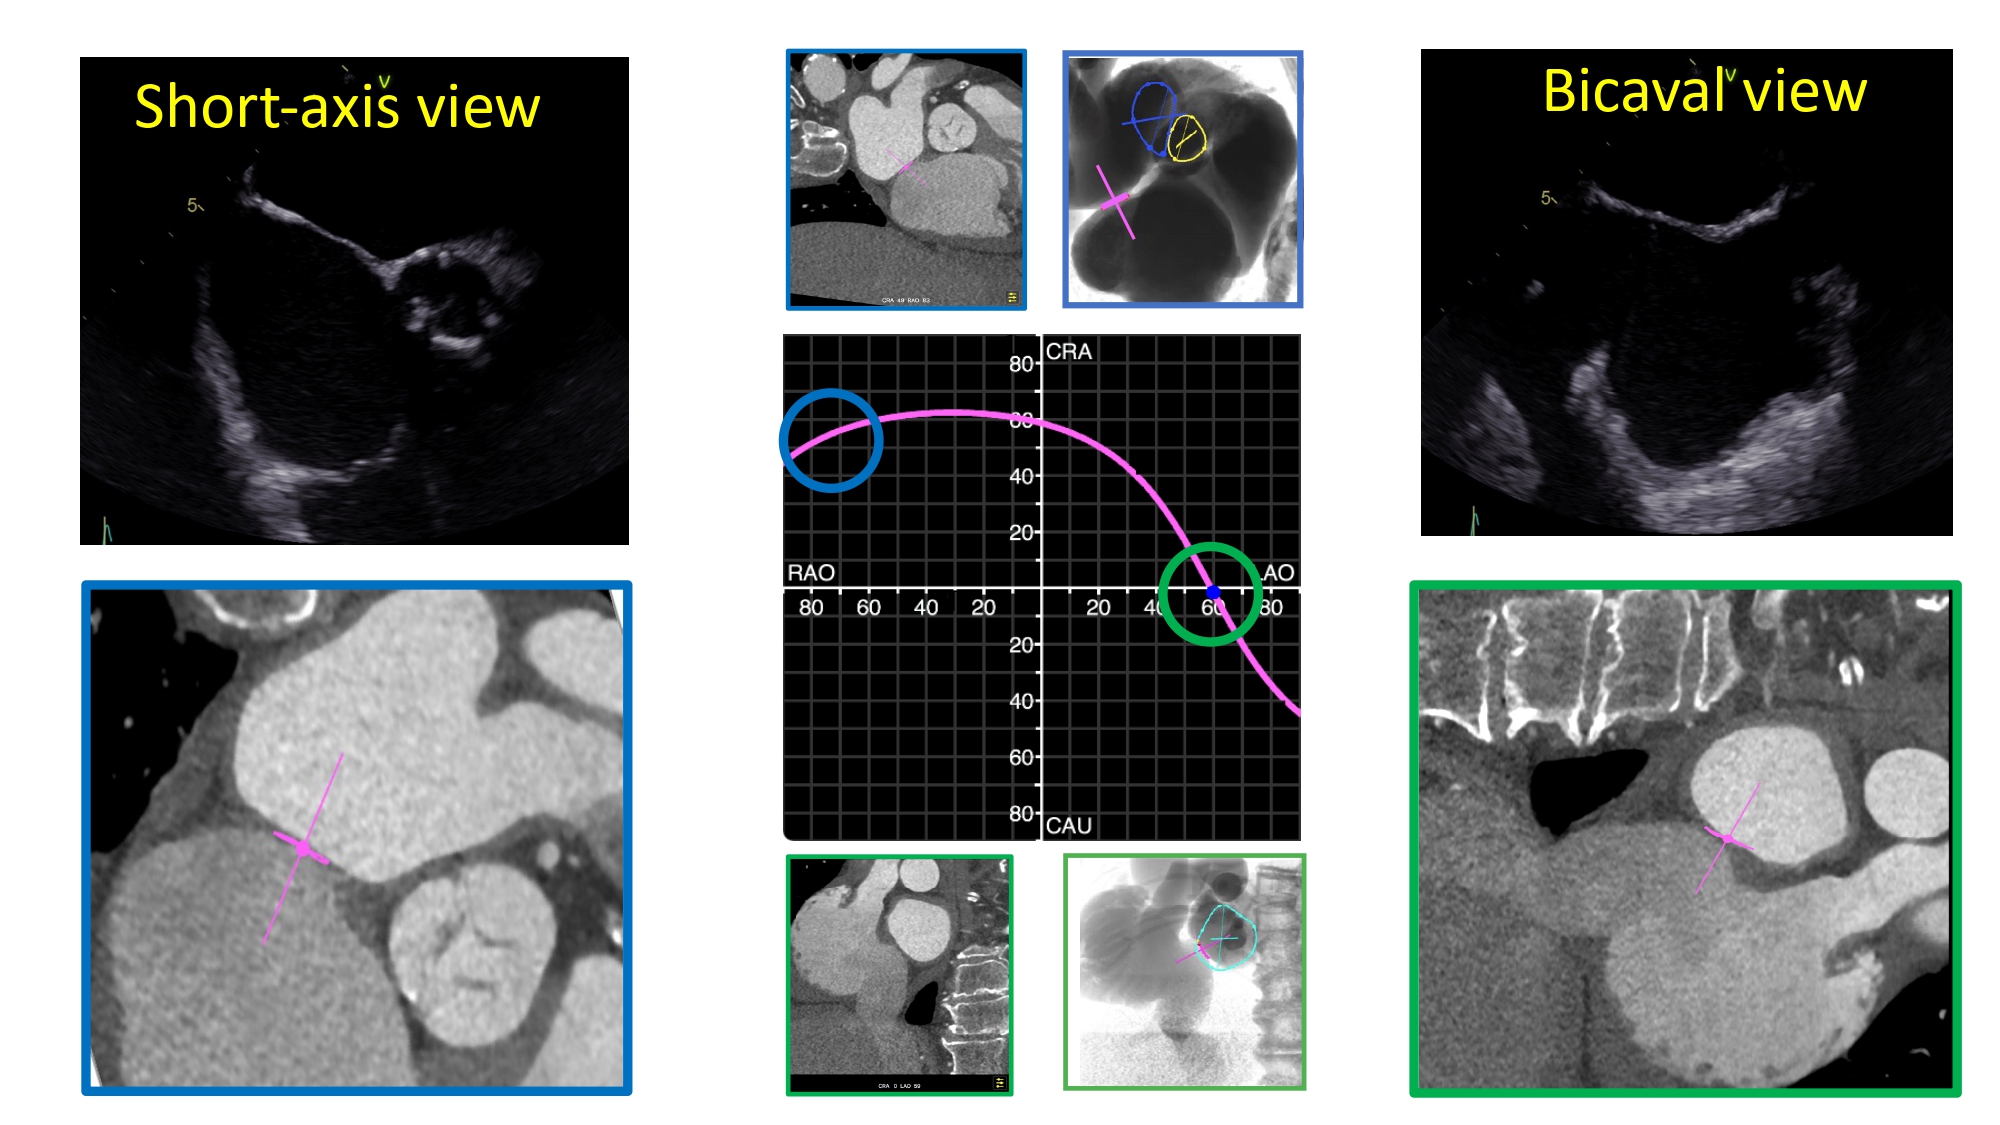
During TAVI procedures, obtaining aortic annulus S-curve (i.e., as measured by pre-procedural MSCT) will provide the operator with all the viewing angles in which the aortic annulus appears in plane. A typical aortic annulus S-curve travels across the LAO CRA, shallow LAO CAU and RAO CAU quadrants while the short-axis view can be found in the extreme RAO CRA quadrant. Much less frequently, the en-face view of the aortic annulus is located in a steep LAO CAU angulation resulting in the S-curve intersecting the LAO CRA, shallow RAO CRA and RAO CAU quadrants.
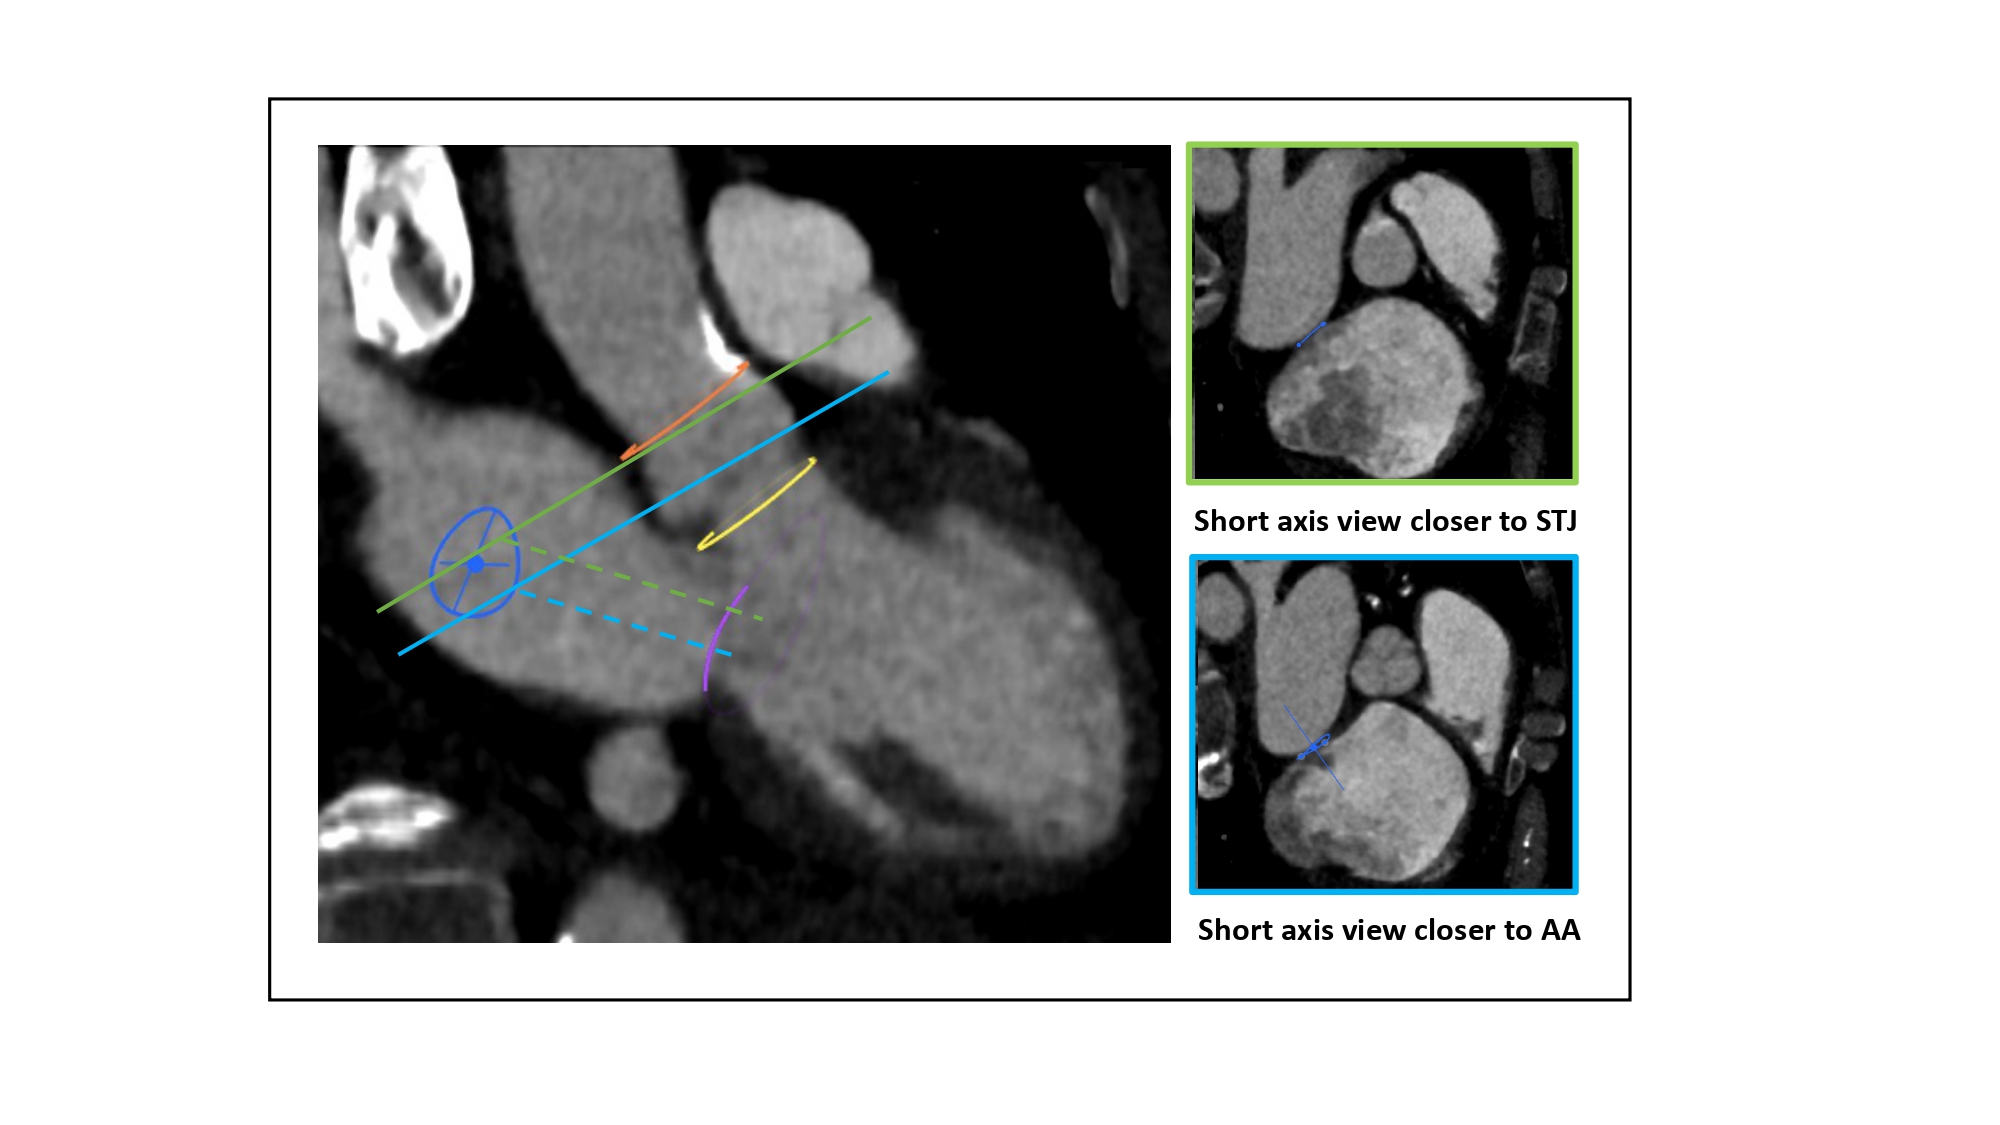
As can be gleaned from the previous paragraph, the fluoroscopic location of the short-axis view of the aortic annulus (i.e., RAO CRA vs. LAO CAU) will impact the shape and position of the S-curve. Short-axis views closer to CRA CAU 0 will generate vertical S-curves, and those approaching CRA CAU 90 will generate horizontal S-curves (Figure 21). Short-axis views approaching RAO LAO 0 will displace S-curves towards the periphery of the fluoroscopic grid, and those nearer to RAO LAO 90 will push curves towards the center.
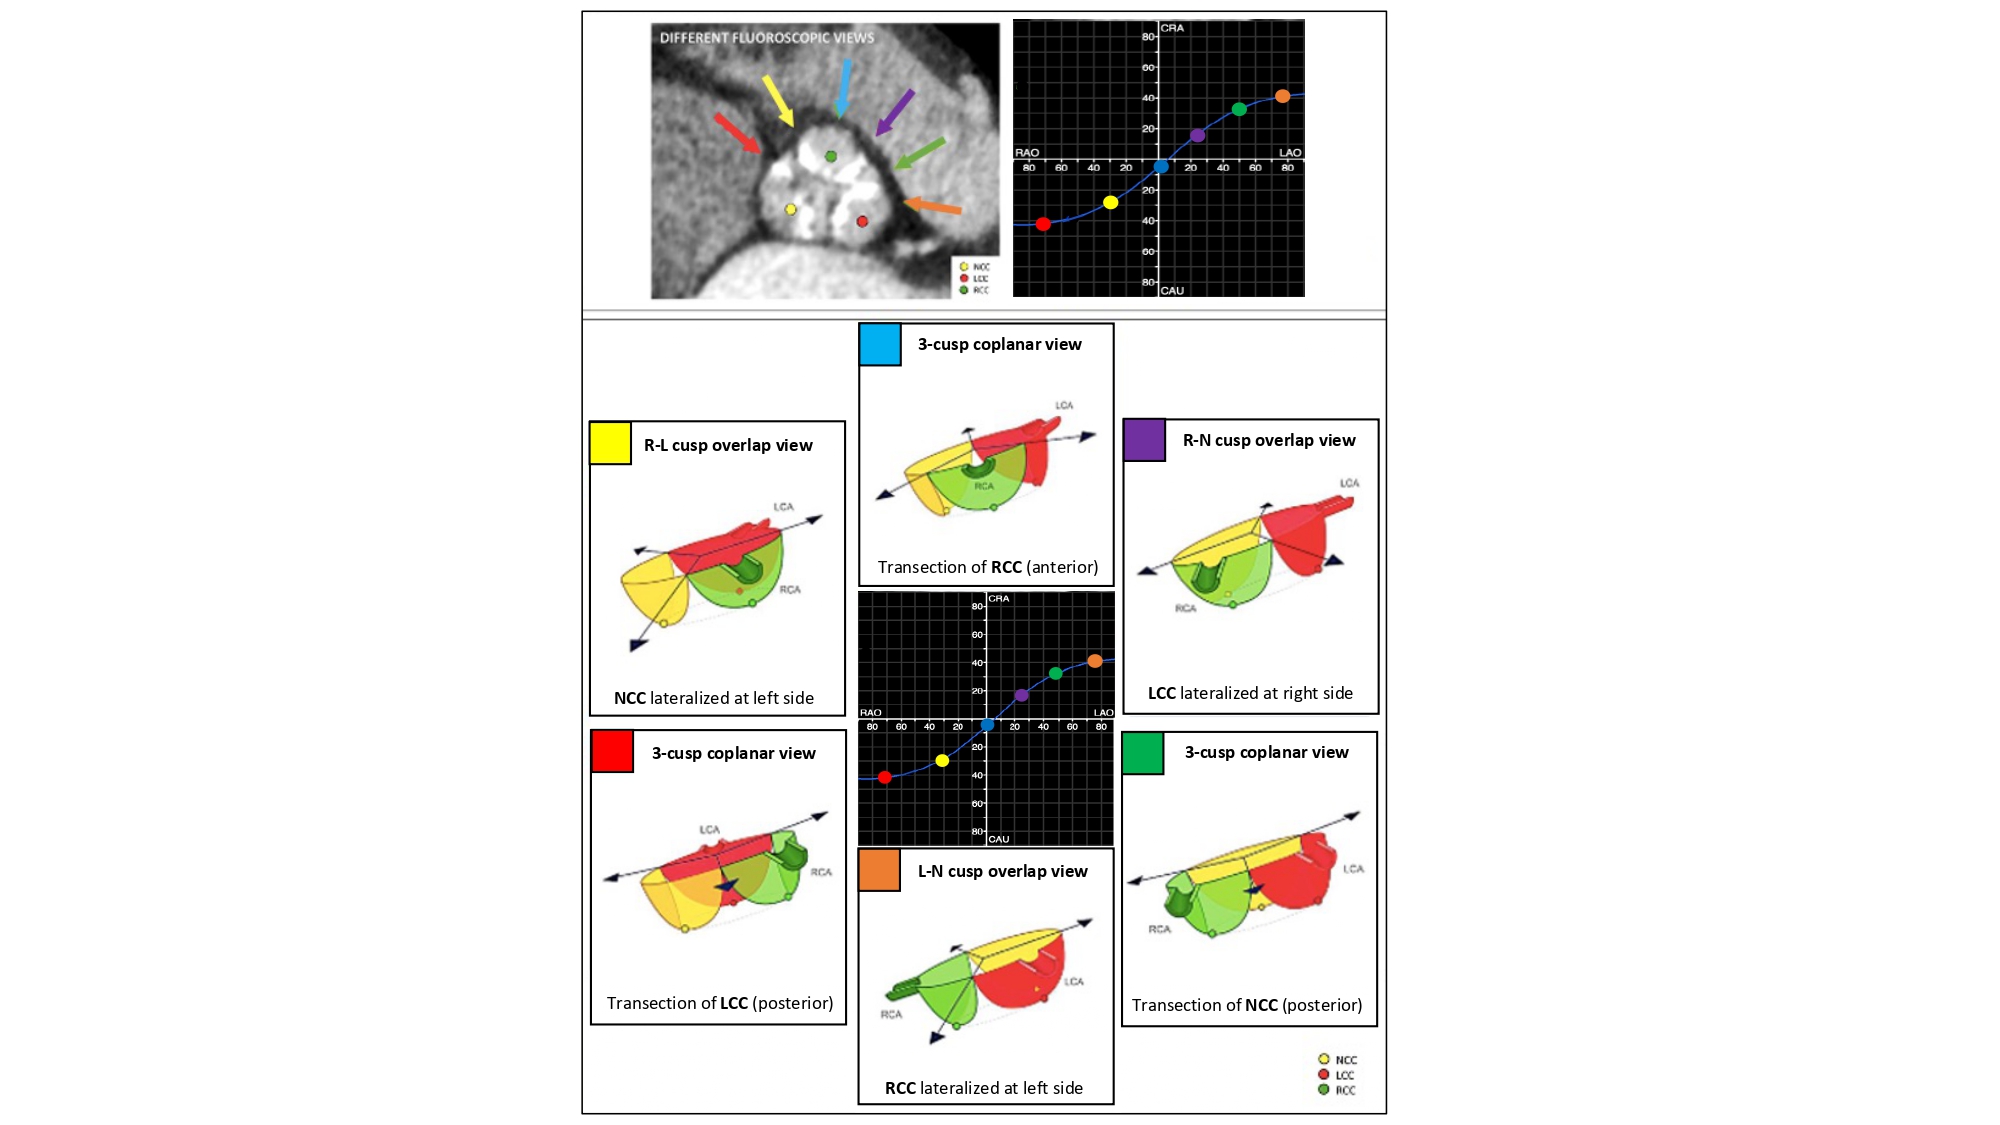
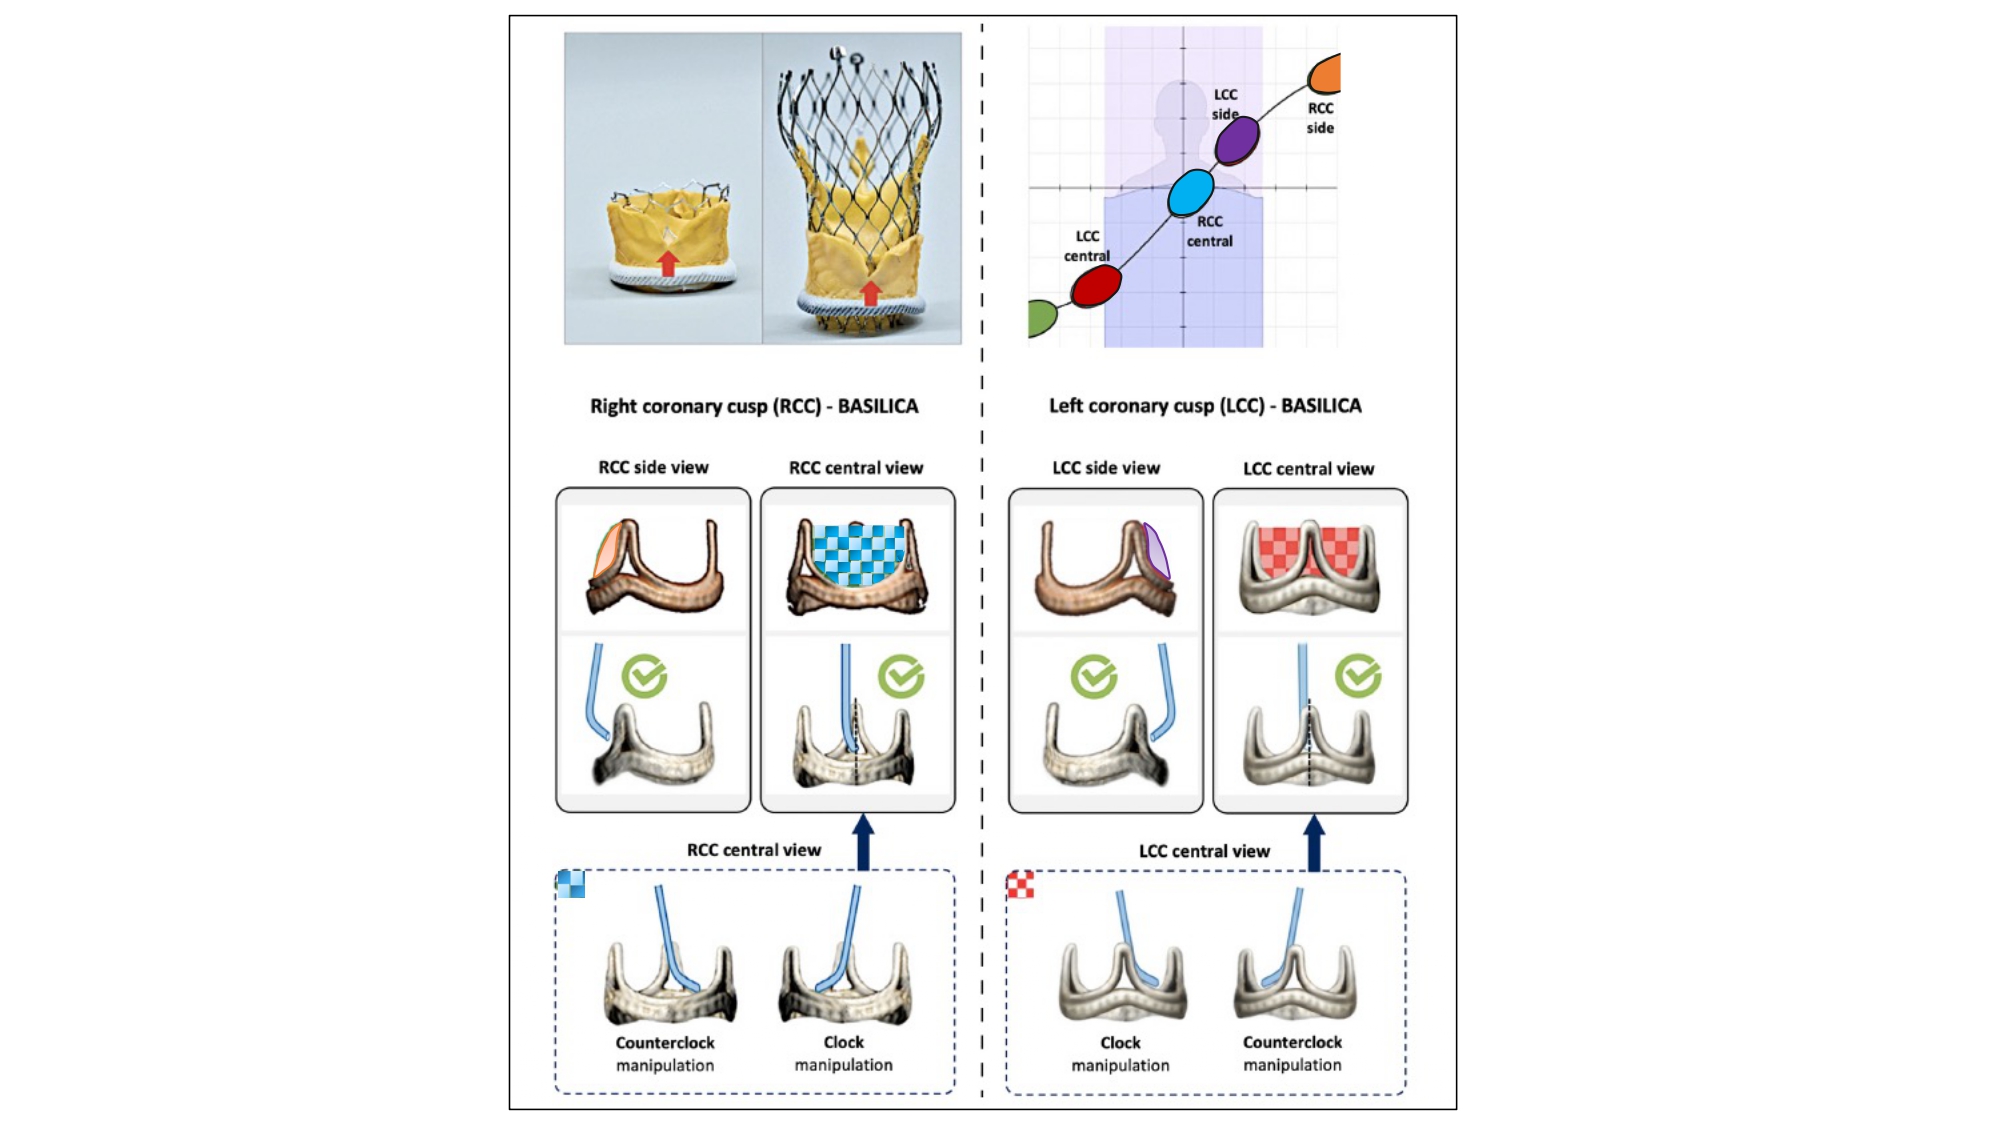
The aortic annulus S-curve, cusp/commissural anatomy – Across its trajectory from RAO CAU to LAO CRA, the aortic annulus S-curve reveals an alternating pattern of 3-cusp to 2-cusp overlap views with 3-, 2- and 4-chamber views, respectively (Figure 22-Video 1). The 3-cusp co-planar views can have a [non-, right-, left-] or a [right-, non-, left] orientation on the fluoroscopic screen from left to right in a very shallow LAO CAU or LAO CRA views, respectively. The 2-cusp overlap view can isolate the non-, left-, or right coronary cusps in the RAO CAU, LAO CRA and steep LAO CRA views, respectively. The isolated non- and right-coronary cusps are positioned to the left of the fluoroscopic screen, the isolated left coronary cusp to the right. The 2-cusp overlap views isolating the left or right coronary cusps offers optimal viewing angles of the left and right coronary ostia, respectively.
Figure 22
The aortic annulus S-curve and cusp/commissural orientation. The orientation of the aortic valve cusps and commissures depends on the fluoroscopic projection used. This figure shows the cusp and commissural orientation from six different fluoroscopic views along the aortic annulus S-curve. The three most frequently used fluoroscopic projections are the R-L cusp overlap view (yellow), 3-cusp coplanar view (turquoise) and the R-N cusp overlap view (violet) – these projections also fall within easy reach of the table/patient, whereas the other projections are typically only reached by using more extreme C-arm angulations. LAO, left anterior oblique; LCC, left coronary cusp; NCC, non-coronary cusp; RAO, right anterior oblique; RCC, right coronary cusp .
The aortic annulus S-curve and cusp/commissural orientation. The orientation of the aortic valve cusps and commissures depends on the fluoroscopic projection used. This video shows the cusp and commissural orientation from six different fluoroscopic views along the aortic annulus S-curve. Fluoroscopic simulation is shown on the right of the screen. Left coronary cusp: red cusp and red line on fluoroscopic simulation; right coronary cusp: green cusp and green line on fluoroscopic simulation; non-coronary cusp: yellow cusp and yellow line on fluoroscopic simulation.
The 2-cusp overlap view can be useful for procedures that require commissural isolation: (i) the cusp overlap view isolating the non-coronary cusp places the commissure between the right and left coronary cusp to the right of the screen; (ii) the cusp overlap view isolating the right coronary cusp places the commissure between the left and non-coronary cusps to the right of the screen; and (iii) the cusp overlap view isolating the left coronary cusp places the commissure between the non- and right-coronary cusp to the left of the screen. As we have described, there is an important association between S-curves, chamber views, and coronary cusp/artery anatomy that will be further discussed for TAVI and related procedures.
UTILITY OF AORTIC ANNULUS S-CURVE FOR TAVR AND RELATED PROCEDURES
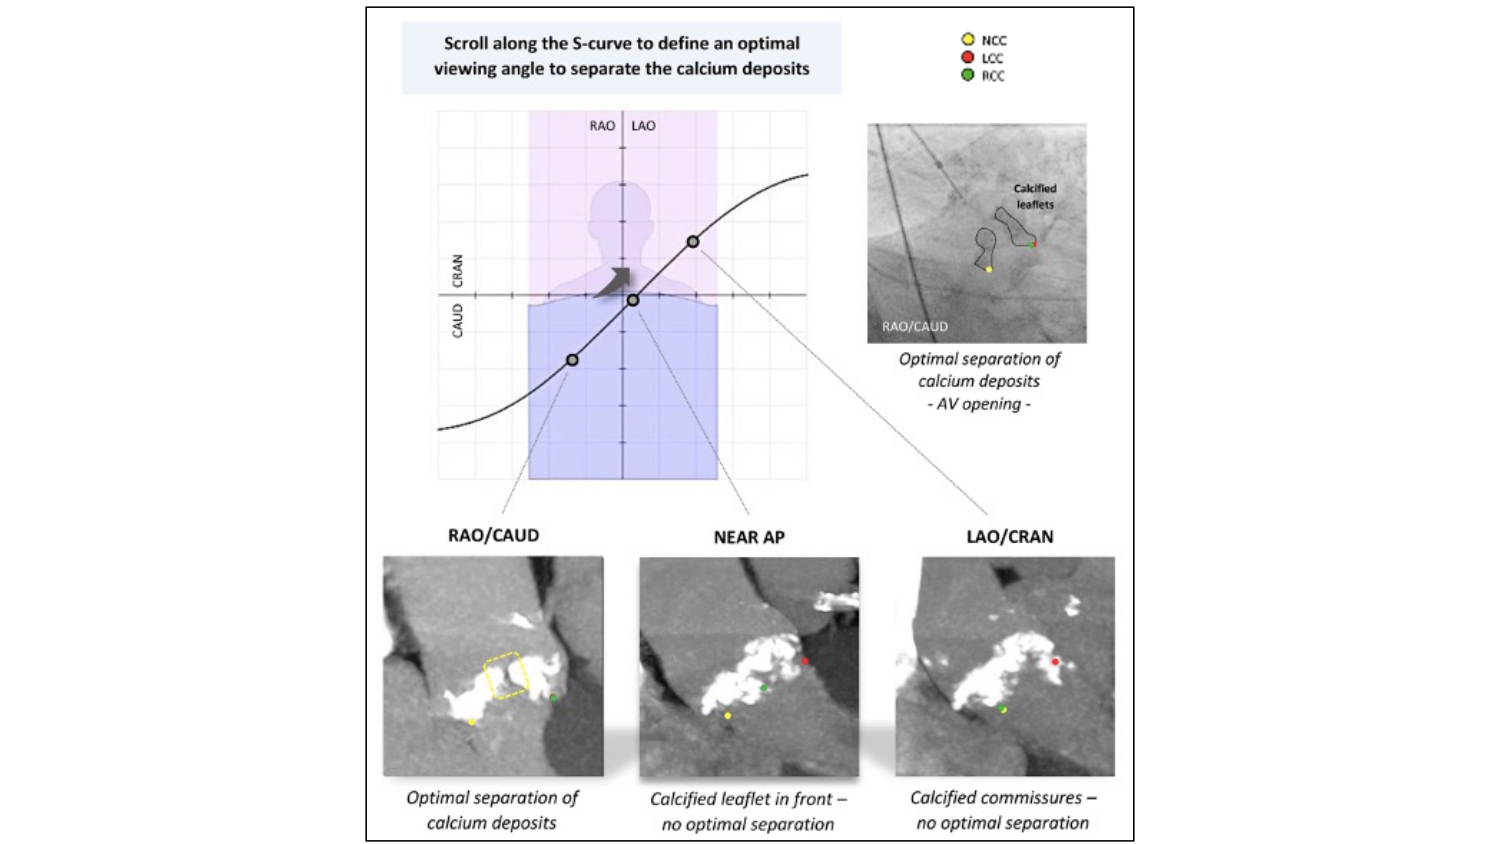
Crossing the aortic valve – Crossing the aortic valve can be performed at any point along the S-curve of the aortic annulus in 3 general regions: RAO CAU, AP, or LAO CRA. Inspecting the calcium distribution along the aortic annulus S-curve may also reveal an optimal viewing angle for crossing, especially in cases with asymmetric calcium cusp deposition. This can be achieved by aligning the MSCT multiplanar reconstruction lines across the asymmetric calcium deposits while the annulus is in-plane. A maximal intensity projection can also be examined while scrolling through the S-curve to identify an optimal crossing view. In the absence of a MSCT (such as in the setting of balloon aortic valvuloplasty), the operator may perform a quick cinegram along a presumed S-curve (e.g., [RAO 30 CAU 30], [AP], and [LAO 30 CRA 30]) and select the best viewing angle that separates the calcium deposits and identifies the aortic valve orifice. Symmetric calcifications across the 3 cusps may render these techniques ineffective (Figure 23). In patients with a bicuspid aortic valve (BAV), specific optimal projection views for valve crossing are based on the characteristic fusion of cusps and the calcification patterns. For example, with right and left cusp fusion, the best crossing view is in RAO CAU (right-left cusp overlap view). The next most common is right and non-coronary cusp fusion which is best crossed in LAO CRA (right and non-coronary cusp overlap view).
Figure 23
Fluoroscopic projections along the S-curve and AV Crossing. The optimal fluoroscopic projection along the S-curve for AV crossing is the angle where calcium deposits separate in systole (right upper panel). The left lower panel shows good separation of calcium deposits (yellow dotted square) in a RAO/CAU view (R-L cusp overlap view in this particular case, looking into the NCC-RCC and NCC-LCC commissures). In a near anteroposterior (AP) view (middle panel), the calcified RCC is positioned in front, which makes identification of the AV orifice difficult. In a LAO/CRAN view (right lower panel), calcium deposits at the level of the R-L commissure do not separate optimally in this particular case. AV, aortic valve; LAO, left anterior oblique; LCC, left coronary cusp; NCC, non-coronary cusp; RAO, right anterior oblique; RCC, right coronary cusp; CRA, cranial .
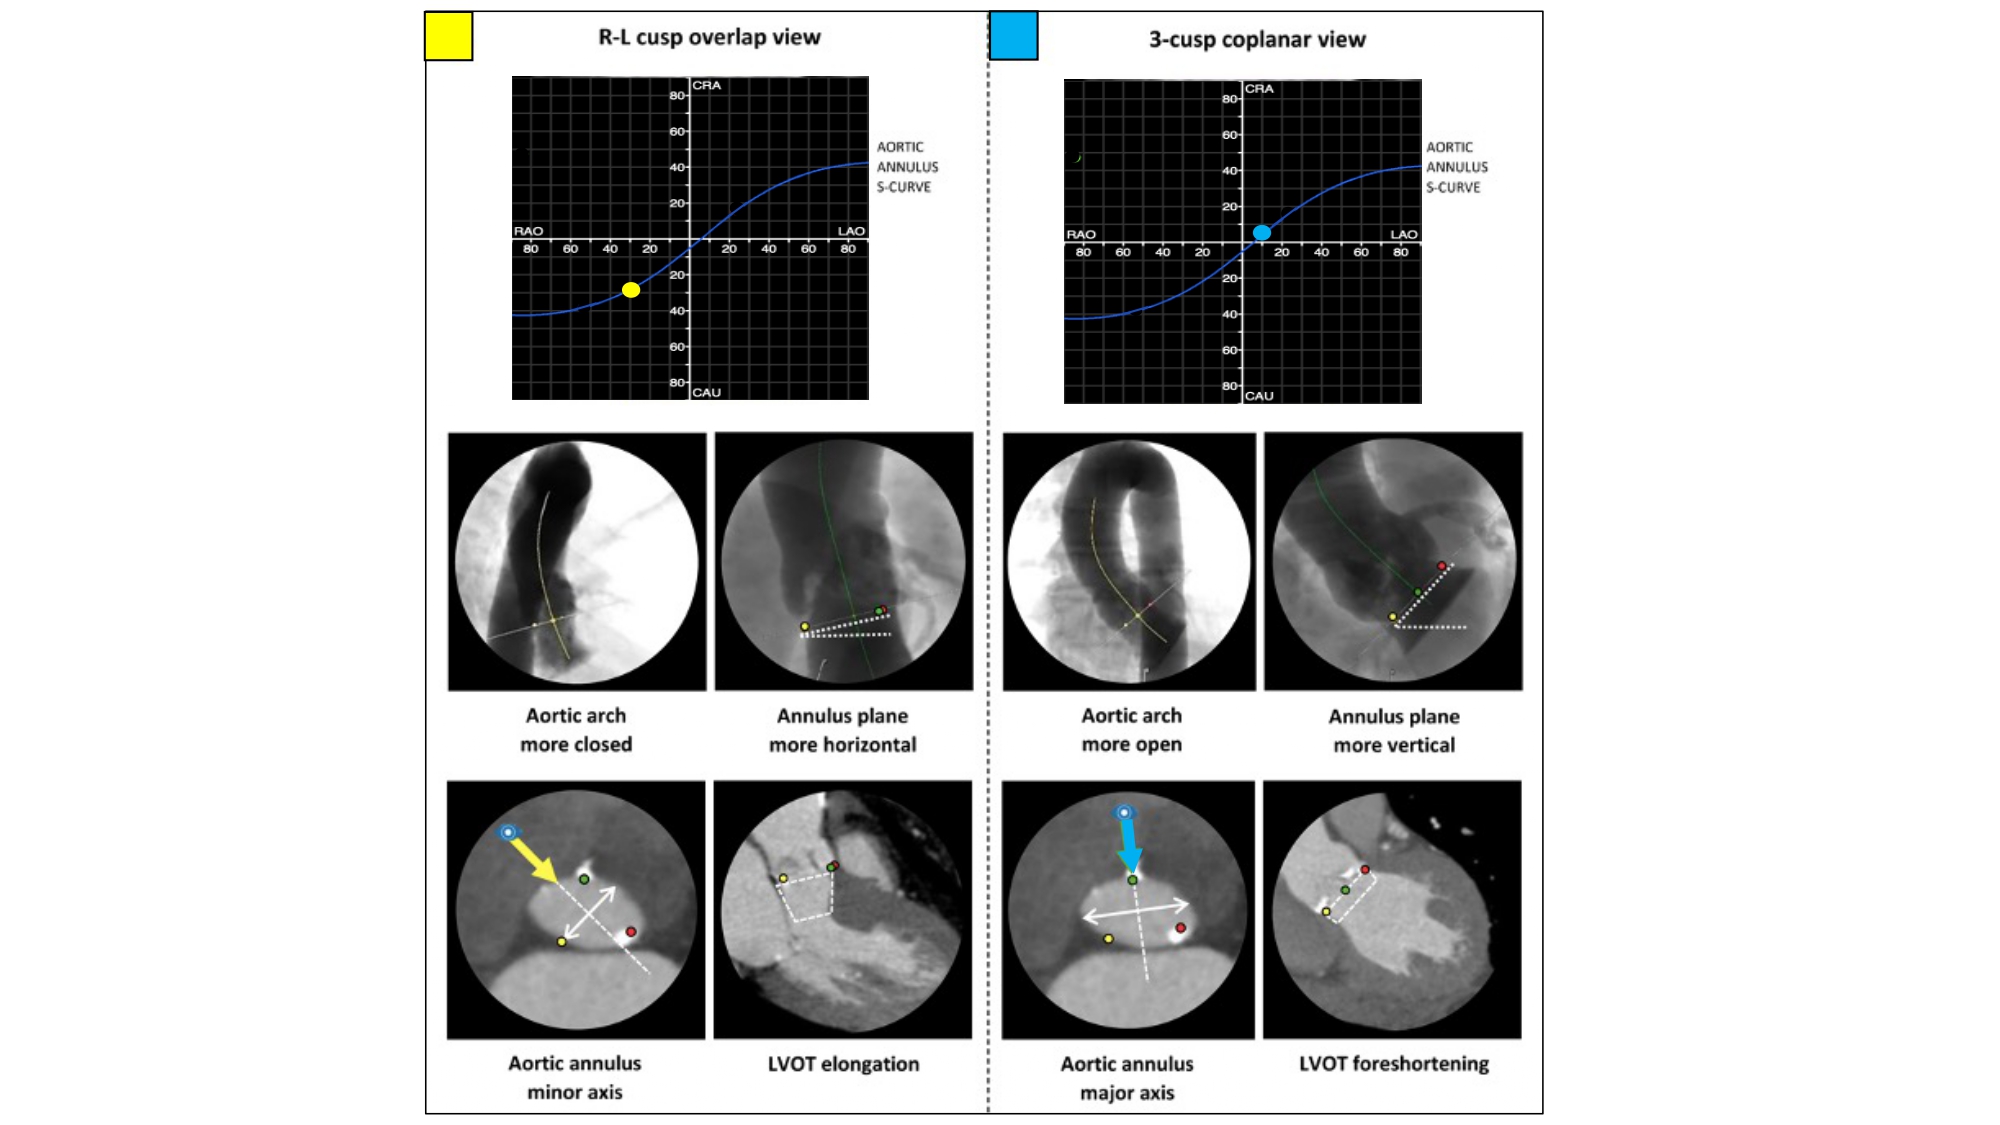
Pre- and post-dilation along the S-curve – The major and minor axis of the aortic annulus can be appreciated along the S-curve in AP (i.e., 1- and/or 2-chamber views) and RAO CAU (i.e., 3-chamber view) angulations, respectively (Figure 24). Aligning the multiplanar reconstruction lines across the major and minor axes will provide AP and RAO CAU angulations, respectively. The measurement of the minor axis can also be helpful for balloon sizing. By means of a 3-chamber view (RAO CAU) during pre-dilation for TAVI or stand-alone balloon aortic valvuloplasty, the operator may appreciate the minor axis of the aortic annulus during balloon inflation that provides visual feedback. Frame under expansion and post-dilation are usually best appreciated and performed in the RAO CAU view. As opposed to using the minor axis, pre- or post-dilation may be performed in the axis of maximal calcification where balloon or frame expansion may be most restricted , , , 4. Thériault-Lauzier P, Andalib A, Martucci G, Mylotte D, Cecere R, Lange R, Tchétché D, Modine T, van Mieghem N, Windecker S, Buithieu J, Piazza N. Fluoroscopic anatomy of left-sided heart structures for transcatheter interventions: insight from multislice computed tomography. JACC Cardiovasc Interv. 2014 Sep;7(9):947–57. Link6. Spaziano M, Thériault-Lauzier P, Meti N, Vaquerizo B, Blanke P, Deli-Hussein J, Chetrit M, Galatos C, Buithieu J, Lange R, Martucci G, Leipsic J, Piazza N. Optimal fluoroscopic viewing angles of left-sided heart structures in patients with aortic stenosis and mitral regurgitation based on multislice computed tomography. J Cardiovasc Comput Tomogr. 2016;10(2):162–72. Link20. Piazza N, Mylotte D, Theriault Lauzier P. Fluoroscopic “heart chamber” anatomy - the case for imaging modality-independent terminology. EuroIntervention J Eur Collab with Work Gr Interv Cardiol Eur Soc Cardiol. 2016 Sep;12(Y):Y9–15. Link21. Schultz CJ, Moelker AD, Tzikas A, Rossi A, van Geuns RJ, de Feyter PJ, Serruys PW. Cardiac CT: necessary for precise sizing for transcatheter aortic implantation. EuroIntervention J Eur Collab with Work Gr Interv Cardiol Eur Soc Cardiol. 2010 May;6 Suppl G:G6–13. Link. Furthermore, removing the nose cone of a self-expanding valve is best performed in the RAO CAU view as this displays the narrowest point that should be avoided by centralizing the cone.
Figure 24
Impact of implantation view on perception of aortic arch, aortic annulus and LVOT. The aortic arch is typically more closed and the aortic annulus plane more horizontal in an R-L cusp overlap view (compared with a 3-cusp coplanar view). Working in an R-L cusp overlap view also typically shows the minor axis of the aortic annulus (translating into a 3-chamber view) and elongation of the LVOT, whereas a 3-cusp coplanar projection shows the major axis of the aortic annulus (translating into a 2-chamber view) and foreshortening of the LVOT (white rectangle). LAO, left anterior oblique; RAO, right anterior oblique; CRA, cranial; CAU, caudal; LVOT, left ventricle outflow tract .
From Double-S curve to Cusp Overlap view – Parallax occurring from suboptimal C-arm angulations can affect the apparent implantation depth if either the annulus or delivery catheter is not in-plane. In turn, this can result in significant foreshortening of either structure leading to malpositioning and increased risk of paravalvular leak, conduction abnormalities, coronary artery obstruction, and valve embolization. Obtaining a co-planar view of the aortic annulus alone ignores the potential parallax that may occur with the delivery catheter. Balloon-expandable transcatheter aortic valves are commonly positioned and deployed perpendicular to the aortic valve annulus, using a 3-cusp co-planar view (non-, right-, left-coronary cusp). Self-expanding transcatheter aortic valves, however, engage from the outer aortic curvature and tend to land “non-coaxial” across the aortic annulus , , 14. Binder RK, Leipsic J, Wood D, Moore T, Toggweiler S, Willson A, Gurvitch R, Freeman M, Webb JG. Prediction of optimal deployment projection for transcatheter aortic valve replacement: angiographic 3-dimensional reconstruction of the aortic root versus multidetector computed tomography. Circ Cardiovasc Interv. 2012 Apr;5(2):247–52. Link22. Ben-Shoshan J, Alosaimi H, Lauzier PT, Pighi M, Talmor-Barkan Y, Overtchouk P, Martucci G, Spaziano M, Finkelstein A, Gada H, Piazza N. Double S-Curve Versus Cusp-Overlap Technique: Defining the Optimal Fluoroscopic Projection for TAVR With a Self-Expanding Device. JACC Cardiovasc Interv. 2021 Jan;14(2):185–94. Link23. Hell MM, Biburger L, Marwan M, Schuhbaeck A, Achenbach S, Lell M, Uder M, Arnold M. Prediction of fluoroscopic angulations for transcatheter aortic valve implantation by CT angiography: influence on procedural parameters. Eur Hear journal Cardiovasc Imaging. 2017 May;18(8):906–14. Link.
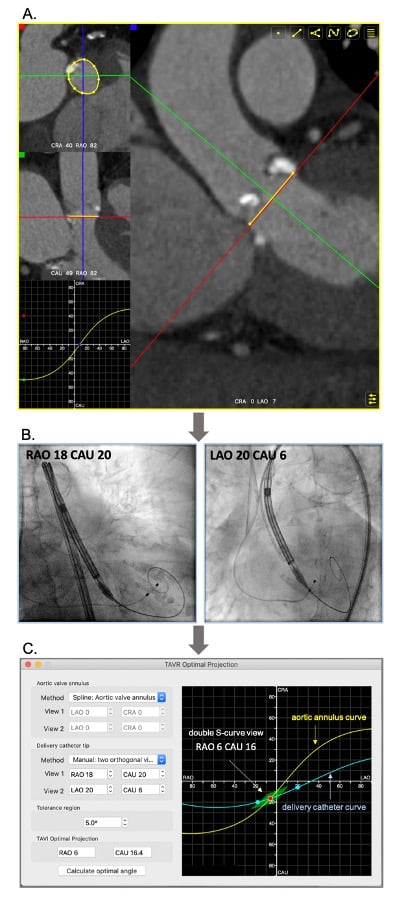
The “Double S curve” method aims to eliminate parallax between the aortic annulus and delivery catheter. The double S-curve method identifies the coordinate of intersection between the aortic annulus and delivery catheter S-curves. Step 1 – the S-curve of the aortic annulus, representing the perpendicular views of the annular plane, is generated using conventional computed tomography software. Step 2 – after advancing the delivery catheter across the aortic annulus, 2 perpendicular views of the delivery catheter radiopaque marker are recorded in LAO and RAO at least 30 degrees apart with necessary CRA CAU angulations. The 2 perpendicular views generate the delivery catheter S-curve according to the previously described mathematical model. Step 3 – the fluoroscopic intersection between the aortic annulus and delivery catheter S-curves defines the optimal projection for implantation as it eliminates foreshortening by providing a co-planar view of the delivery catheter and aortic annulus 22. Ben-Shoshan J, Alosaimi H, Lauzier PT, Pighi M, Talmor-Barkan Y, Overtchouk P, Martucci G, Spaziano M, Finkelstein A, Gada H, Piazza N. Double S-Curve Versus Cusp-Overlap Technique: Defining the Optimal Fluoroscopic Projection for TAVR With a Self-Expanding Device. JACC Cardiovasc Interv. 2021 Jan;14(2):185–94. Link (Figure 25). The double S-curve method can also be applied for valve-in-valve procedures. The first step is to obtain a closed-spline tracing of the bioprosthesis frame with ensuing steps as previously mentioned. In more than 90% of transfemoral TAVI cases, the coordinate of intersection between the aortic annulus and delivery catheter S-curves occurs in RAO CAU. This projection translates into a 3-chamber (or LVOT) view that offers several advantages (Figure 26):
Figure 25
The “double S-curve” model for definition of optimal projection for TAVI. Step 1 (A) - The S-curve of the aortic valve annulus, representing the perpendicular views of the annular plan, is generated (FluoroCT software 1.1.1). Step 2 (B) - Two random projections (e.g. RAO and LAO) of the delivery catheter marker in plane (without parallax) are obtained during the procedure. Step 3 (C) - The two fluoroscopic coordinates are formulated to generate the S-curve of delivery catheter using the FluoroCT software 1.1.1. The coordinates of intersection between the two S-curves (red dot) are then defined as the optimal projection for implantation with a pre-set deviation “tolerance” of ~5% (green deltoid).
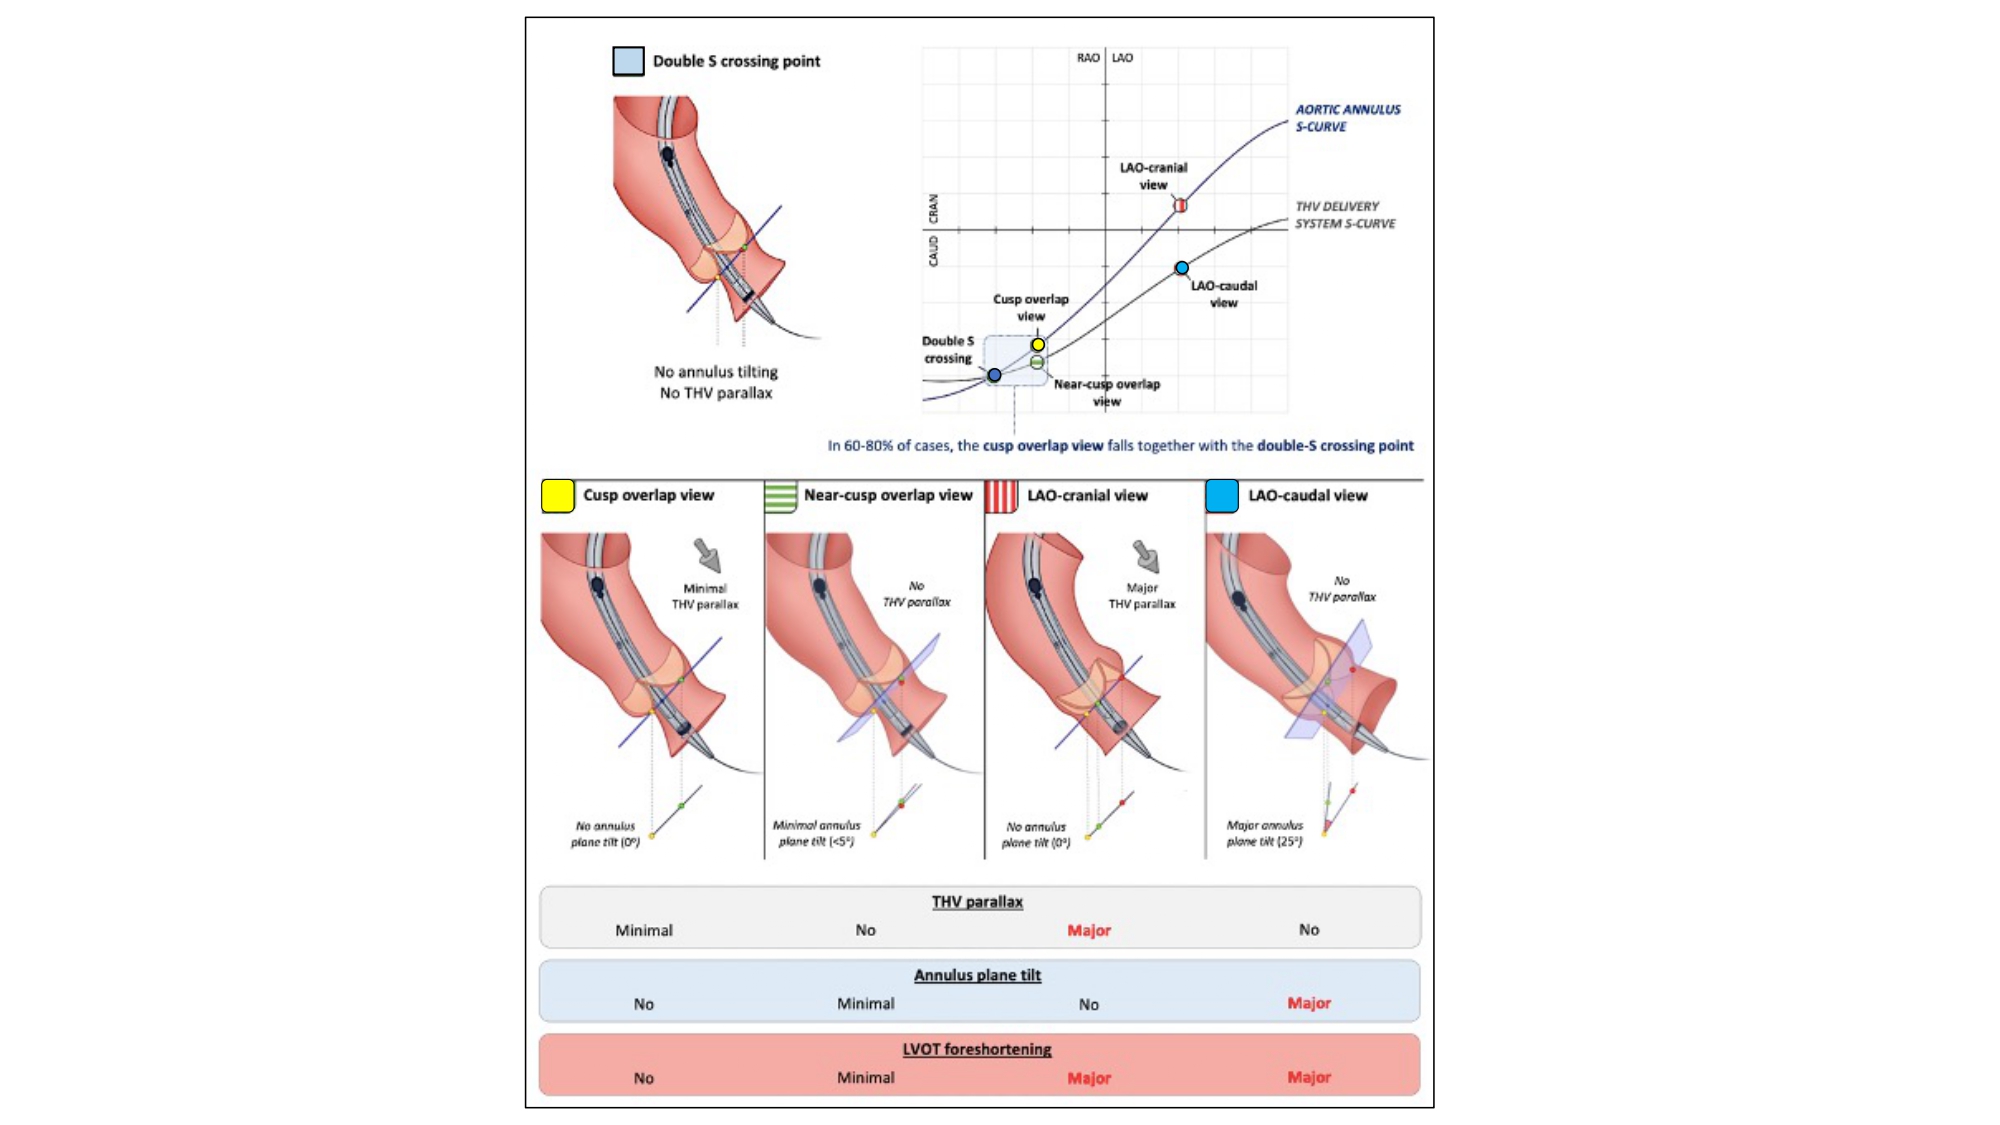
Double S-curve and implantation of self-expanding THVs. The intersection of the aortic annulus and transcatheter heart valve (THV) delivery system S-curves (which define both structures in plane) is in most cases situated in the RAO-CAUD quadrant (“double S crossing point”). In an ideal scenario, implantation of self-expanding THVs would be performed using this fluoroscopic projection; however, the fluoroscopic projection corresponding with the double S crossing point cannot be determined preprocedurally. When deploying self-expanding THVs in a (near) R-L cusp overlap view, one approximates this double S crossing point, inducing minimal THV parallax or tilt in the annular plane. The more one works in an LAO projection, the more the S-curves of the aortic annulus and THV delivery system separate, with the result that both structures are visualized in a different plane (thereby inducing a problem for accurate assessment of THV implantation depth). RAO, right anterior oblique; CAU, caudal; LAO, left anterior oblique .
It displays an elongated view across the aortic root and LVOT and thereby mitigates foreshortening across this region of the anatomy. As a corollary of “stretching open” the anatomy, the delivery catheter may not be perfectly coaxial and perceived as elongated. Any fluoroscopic viewing angle that foreshortens the aortic root/ LVOT will naturally foreshorten the delivery catheter.
The 3-chamber view isolates the non-coronary cusp and overlaps the right and left cusps. The isolated non-coronary cusp is the most inferior hinge point of the native aortic annulus and is located immediately adjacent to the membranous septum and conduction tissue. While eliminating parallax, the 3-chamber view allows more precise depth of implant below the non-coronary cusp and possible reduction in the rate of conduction disturbances.
By demonstrating the minor axis of the aortic annulus during deployment, the 3-chamber view may provide confirmation of the earliest contact between the transcatheter aortic valve prosthesis and aortic valve annulus, and assessment of valve under-expansion.
As opposed to LAO, RAO CAU views are associated with the least radiation exposure to the operator.
Possible limitations of the 3-chamber view include:
Foreshortening of the ascending aorta (and thereby the delivery catheter) in that region will reduce the ability to gauge tension across the system (push/pull).
Compromised perceived depth of implant relative to the right and left coronary cusps because of the temporary non-coaxial alignment of the self-expanding frame prior to complete deployment.
Depth verification across the left coronary cusp prior to complete release can be performed in LAO 35 CRA 20 where the left coronary cusp and left coronary artery are usually isolated on average along the S-curve. Upon complete deployment and release in the 3-chamber view, the self-expanding prosthesis tends to reorient itself towards the plane of the aortic annulus , 4. Thériault-Lauzier P, Andalib A, Martucci G, Mylotte D, Cecere R, Lange R, Tchétché D, Modine T, van Mieghem N, Windecker S, Buithieu J, Piazza N. Fluoroscopic anatomy of left-sided heart structures for transcatheter interventions: insight from multislice computed tomography. JACC Cardiovasc Interv. 2014 Sep;7(9):947–57. Link6. Spaziano M, Thériault-Lauzier P, Meti N, Vaquerizo B, Blanke P, Deli-Hussein J, Chetrit M, Galatos C, Buithieu J, Lange R, Martucci G, Leipsic J, Piazza N. Optimal fluoroscopic viewing angles of left-sided heart structures in patients with aortic stenosis and mitral regurgitation based on multislice computed tomography. J Cardiovasc Comput Tomogr. 2016;10(2):162–72. Link.
As a proxy to the “Double S-curve”, the “Cusp overlap view” has gained widespread acceptance as the most user-friendly method for the implantation of self-expanding transcatheter aortic valves with good concordance between both methods 22. Ben-Shoshan J, Alosaimi H, Lauzier PT, Pighi M, Talmor-Barkan Y, Overtchouk P, Martucci G, Spaziano M, Finkelstein A, Gada H, Piazza N. Double S-Curve Versus Cusp-Overlap Technique: Defining the Optimal Fluoroscopic Projection for TAVR With a Self-Expanding Device. JACC Cardiovasc Interv. 2021 Jan;14(2):185–94. Link. Balloon-expandable valves may also be deployed using similar methods 24. Sammour Y, Banerjee K, Kumar A, Lak H, Chawla S, Incognito C, Patel J, Kaur M, Abdelfattah O, Svensson LG, Tuzcu EM, Reed GW, Puri R, Yun J, Krishnaswamy A, Kapadia S. Systematic Approach to High Implantation of SAPIEN-3 Valve Achieves a Lower Rate of Conduction Abnormalities Including Pacemaker Implantation. Circ Cardiovasc Interv. 2021 Jan;14(1):e009407. Link.
Like the “Double S-curve”, the “Cusp overlap view” isolates the non-coronary cusp while overlapping the left and right coronary cusps in the RAO CAU angulation (Figure 24). As already described, the “Cusp overlap view” is acquired using the pre-procedural MSCT and rotating the multi-planar reconstruction line to transect the nadir of the non-coronary cusp; this will isolate the non-coronary cusp in all cases and overlap the right and left cusps in most cases depending on cusp symmetry.
Commissural and/or coronary alignment – The importance of coronary access after TAVI has inspired operators to obtain alignment between the commissural posts of the transcatheter aortic valve and native commissures (i.e., commissural alignment). Although unclear at this time, commissural alignment may also prove beneficial for valve hemodynamics, valve durability, and reinterventions in case of valve failure , 25. Piazza N, Martucci G, Spaziano M. Commissural or Coronary Alignment for TAVR?: Align What and by How Much? Vol. 15, JACC Cardiovascular interventions. United States; 2022. p.147–9 Link26. Tang GHL, Amat-Santos IJ, De Backer O, Avvedimento M, Redondo A, Barbanti M, Costa G, Tchétché D, Eltchaninoff H, Kim WK, Zaid S, Tarantini G, Søndergaard L. Rationale, Definitions, Techniques, and Outcomes of Commissural Alignment in TAVR: From the ALIGN-TAVR Consortium. JACC Cardiovasc Interv. 2022 Aug;15(15):1497–518. Link.
Given that the transcatheter aortic valve commissural posts are 120-degrees separated and the nadirs of the bioprosthetic leaflets are designed 60 degrees from each commissure, obtaining optimal commissural alignment implies that the right and left coronary artery ostia emerge at 60 degrees from the native right-left coronary cusp commissure. In this way, the coronary ostia will align with the nadirs of the bioprosthetic valve leaflets. If the coronary arteries emerge closer or further than 60 degrees from the native commissures, and the transcatheter aortic valve commissural post is aligned with the left-right commissure, a degree of misalignment will ensue. For these reasons, the concept of “coronary alignment” was recently proposed whereby the transcatheter aortic valve commissural post is centered between the coronary ostia irrespective of the native commissure; to be successful, the left and right coronary arteries must emerge at 120 degrees. An alternative option includes aligning the nadir of a bioprosthetic leaflet to a single coronary artery (e.g., left coronary artery) or positioning the transcatheter aortic valve commissural post 60 degrees relative to a single coronary artery. Analysis of the pre-procedural computed tomography scan can determine the relative angular distances between the commissures and coronary arteries and help select a commissural or coronary alignment strategy , , , 25. Piazza N, Martucci G, Spaziano M. Commissural or Coronary Alignment for TAVR?: Align What and by How Much? Vol. 15, JACC Cardiovascular interventions. United States; 2022. p.147–9 Link27. Wang X, De Backer O, Bieliauskas G, Wong I, Bajoras V, Xiong TY, Zhang Y, Kofoed KF, Chen M, Sondergaard L. Cusp Symmetry and Coronary Ostial Eccentricity and its Impact on Coronary Access Following TAVR. JACC Cardiovasc Interv. 2022 Jan;15(2):123–34. Link28. Tang GHL, Zaid S, Fuchs A, Yamabe T, Yazdchi F, Gupta E, Ahmad H, Kofoed KF, Goldberg JB, Undemir C, Kaple RK, Shah PB, Kaneko T, Lansman SL, Khera S, Kovacic JC, Dangas GD, Lerakis S, Sharma SK, Kini A, Adams DH, Khalique OK, Hahn RT, Søndergaard L, George I, Kodali SK, De Backer O, Leon MB, Bapat VN. Alignment of Transcatheter Aortic-Valve Neo-Commissures (ALIGN TAVR): Impact on Final Valve Orientation and Coronary Artery Overlap. JACC Cardiovasc Interv. 2020 May;13(9):1030–42. Link29. Bieliauskas G, Wong I, Bajoras V, Wang X, Kofoed KF, De Backer O, Søndergaard L. Patient-Specific Implantation Technique to Obtain Neo-Commissural Alignment With Self-Expanding Transcatheter Aortic Valves. JACC Cardiovasc Interv. 2021 Oct;14(19):2097–108. Link.
“Commissural alignment” requires overlapping the left and right coronary cusp to isolate the commissure between these cusps to the right-side of the fluoroscopic screen while the aortic annulus remains co-planar (Figure 27). The correct commissural post is then “aligned” with this commissure to the right of the fluoroscopic screen. Along the aortic annulus S-curve, overlap of the right and left coronary cusp is synonymous with the 3-chamber view (RAO CAU) or “right/left cusp overlap view” for depth implantation where the non-coronary cusp is isolated to the left-side of the fluoroscopic screen. Previous studies suggest that patient-specific implantation techniques using the “right/left cusp overlap view” can achieve adequate commissural alignment (i.e., none or mild misalignment) in 90% of cases. Although successful commissural alignment can be achieved with self-expanding platforms, it is currently not feasible with their balloon-expandable counterpart. Technical details on how to perform “commissural alignment” using various transcatheter aortic valve designs (Evolut PRO, Medtronic USA; Acurate Neo2, Boston Scientific USA; Navitor, Abbott USA) is provided elsewhere 29. Bieliauskas G, Wong I, Bajoras V, Wang X, Kofoed KF, De Backer O, Søndergaard L. Patient-Specific Implantation Technique to Obtain Neo-Commissural Alignment With Self-Expanding Transcatheter Aortic Valves. JACC Cardiovasc Interv. 2021 Oct;14(19):2097–108. Link.
Figure 27
Implantation technique for obtaining patient-specific commissural Alignment. To obtain patient-specific commissural alignment during transcatheter aortic valve replacement, one can make use of the R-L cusp overlap view, in which the commissure between both cusps will be isolated and directed toward the right on fluoroscopy. Consequently, patient-specific commissural alignment will be obtained as follow: A) ACURATE Neo2 and C) Navitor: if one of the THV commissural posts can be lateralized at the right-hand side (with the 2 other THV commissural posts overlapping at the left-hand side in the R-L cusp overlap view). B) EVOLUT FX: one of the “dots marker” is lateralized at the right-hand side with the other two dots overlapping/nearly overlapping at the left-hand side of the screen .
“Coronary alignment” requires a projection angle where the right and left coronary ostia are overlapped (i.e., “coronary ostia overlap view”) to the right-side of the fluoroscopic screen. In this view, the dedicated commissural post is positioned to the right of the screen. Previous studies have shown that the “right/left cusp overlap view” is in the RAO CAU quadrant of the aortic annulus S-curve in 87% of tricuspid and 93% of bicuspid aortic valves. In comparison, there was a higher proportion of patients with the “right/left coronary overlap view” in the RAO CAU quadrant (95% and 97% for tricuspid and bicuspid aortic valves, respectively). More specifically, there was less than a 10-degree angular difference in 3 out of 4 patients. In most cases (~75%), the “coronary ostia overlap view” is located in a steeper RAO CAU view than the “right/left coronary cusp overlap” view.
Coronary access post-TAVI – A study of 449 acute coronary syndrome patients documented a high rate (~98%) of successful coronary angiography post TAVI (defined as sufficient visualization of the vessel with either selective or non-selective engagement of the coronary ostium). In 21 of 243 patients (8.6%), PCI was unsuccessful. Non-selective coronary engagement was more common for the right than left coronary artery (30% vs. 21%), coronary angiography and PCI was more successful with short-framed balloon-expandable prostheses than tall-framed self-expanding prostheses. Two or more catheters were required in 10-20% of patients 30. Kim WK, Pellegrini C, Ludwig S, Möllmann H, Leuschner F, Makkar R, Leick J, Amat-Santos IJ, Dörr O, Breitbart P, Jimenez Diaz VA, Dabrowski M, Rudolph T, Avanzas P, Kaur J, Toggweiler S, Kerber S, Ranosch P, Regazzoli D, Frank D, Landes U, Webb J, Barbanti M, Purita P, Pilgrim T, Liska B, Tabata N, Rheude T, Seiffert M, Eckel C, Allali A, Valvo R, Yoon SH, Werner N, Nef H, Choi YH, Hamm CW, Sinning JM. Feasibility of Coronary Access in Patients With Acute Coronary Syndrome and Previous TAVR. JACC Cardiovasc Interv. 2021 Jul;14(14):1578–90. Link. A similar study, RE-ACCESS (Reobtain Coronary Ostia Cannulation Beyond Transcatheter Aortic Valve Stent), reported a 7.7% rate of unsuccessful coronary cannulation. The use of Evolut transcatheter valve, device implant depth, and transcatheter heart valves oversized with respect to the sinus of Valsalva were independent predictors of unsuccessful coronary cannulation 31. Tarantini G, Nai Fovino L, Scotti A, Massussi M, Cardaioli F, Rodinò G, Benedetti A, Boiago M, Matsuda Y, Continisio S, Montonati C, Cacciavillani L, Pavei A, Masiero G, Napodano M, Fraccaro C, Fabris T, Iliceto S. Coronary Access After Transcatheter Aortic Valve Replacement With Commissural Alignment: The ALIGN-ACCESS Study. Circ Cardiovasc Interv. 2022 Feb;15(2):e011045. Link.
Many factors can influence coronary access post-TAVI, including native coronary ostial height, sinus of Valsalva width, coronary ostial eccentricity, transcatheter aortic valve design (tall vs. short, narrow vs. wide, intra-annular vs. supra-annular designs), transcatheter aortic valve commissural alignment, implantation depth, operator experience, and fluoroscopic viewing angle for coronary intubation. Optimal fluoroscopic viewing projections of the coronary ostia can facilitate their evaluation, intubation, and intervention (Figure 28).
Figure 28
Optimal Fluoroscopic Views to Expose the Coronary Ostia/Coronary Access. The first method is based on fluoroscopic isolation of the right and left coronary ostia, projecting the RCA ostium at the left-hand side and the LCA ostium at the right-hand side, respectively. In the second method, one determines the fluoroscopic projection in which the S-curves of the aortic annulus plane and RCA/LCA ostium intersect, projecting both the aortic annulus and RCA/LCA ostium in plane. RCA: right coronary artery, LCA: left coronary artery .
An S-curve can be developed for depicting numerous views of the coronary ostia in-plane. Ideally, however, a co-planar view of the aortic annulus and coronary ostia would mitigate the foreshortening of the aortic root and improve visibility during contrast injections. Utilizing the double S-curve between the coronary ostia and aortic annulus, our group reported the ideal fluoroscopic projections of the left (LAO 37°, CRA 22°, 95% CI: LAO 33°-40°, CRA 19°-25°) and right coronary ostia (LAO 79°, CRA 41°, 95% CI: LAO 74°-84°, CRA 37°-45°) 32. Kočka V, Thériault-Lauzier P, Xiong TY, Ben-Shoshan J, Petr R, Laboš M, Buithieu J, Mousavi N, Pilgrim T, Praz F, Overtchouk P, Beaudry JP, Spaziano M, Pelletier JP, Martucci G, Dandona S, Rinfret S, Windecker S, Leipsic J, Piazza N. Optimal Fluoroscopic Projections of Coronary Ostia and Bifurcations Defined by Computed Tomographic Coronary Angiography. JACC Cardiovasc Interv. 2020 Nov;13(21):2560–70. Link. For the ostial right coronary, the data suggest that ideal angulations may not be achievable in most patients due to C-arm constraints – nonetheless, operators should strive for a steep LAO and shallow CRA angulation. The double S-curve between the left coronary ostium and aortic annulus isolates the left coronary cusp, while the double S-curve between the right coronary ostium and aortic annulus isolates the right coronary cusp. In other words, by isolating the left coronary cusp (i.e., 2 cusp non-right overlap view in LAO CRA) and right coronary cusp (i.e., 2 cusp non-left overlap view in steep LAO CRA), optimal viewing angles of the left main and right coronary ostia, respectively, can be obtained, thereby avoiding the need for double S-curve software programs.
Optimal views of the left and right coronary ostia can be useful for ruling out coronary obstruction after TAVI. Furthermore, these views can facilitate selective coronary engagement by isolating the coronary ostia and increasing the likelihood of co-axial stent strut engagement. Non-optimal viewing angles may lead the operator to enter a non-coaxial stent strut resulting in poor guide catheter support and the need for “fishing technique” with a hydrophilic wire or mother-in-child catheters. The “snorkel technique” (whereby a stent is implanted across the coronary ostium with protrusion into the aorta) can also be supported by optimal coronary ostial viewing projections.
BASILICA (bioprosthetic or native aortic scallop intentional laceration to prevent coronary artery obstruction)
TAVI can displace the native aortic valve leaflets towards the coronary ostia resulting in coronary obstruction. BASILICA is a technique to prevent coronary obstruction during TAVI by using an electrified wire to lacerate the left or right aortic valve leaflet from its base to free edge, producing a V-shaped splayed leaflet that promotes coronary blood flow 33. Lederman RJ, Babaliaros VC, Rogers T, Khan JM, Kamioka N, Dvir D, Greenbaum AB. Preventing Coronary Obstruction During Transcatheter Aortic Valve Replacement: From Computed Tomography to BASILICA. JACC Cardiovasc Interv. 2019 Jul;12(13):1197–216. Link. During the procedure, the target leaflet traversal point and traversal direction need to be appreciated. An appropriate trajectory for leaflet traversal is necessary to maximize the laceration-related “triangle of flow” and prevent mechanical injury to adjacent tissues (e.g., anterior mitral valve leaflet). To best understand the trajectory of laceration, a central and side view of the intended leaflet is necessary (Figure 29). In other words, the BASILICA procedure requires a 3-cusp co-planar view of the aortic annulus that centralizes the intended leaflet (i.e., central view) and a 2-cusp overlap view that isolates it (i.e., side view). For example, the central view of the left coronary cusp would represent a 3-cusp co-planar view with non-left-right orientation of the cusps from left to right on the fluoroscopic screen. The side view of the left coronary cusp would represent a non-right cusp overlap view with the isolated left coronary leaflet to the right of the fluoroscopic screen.
Figure 29
Planning for BASILICA-assisted valve-in-valve transcatheter aortic valve replacement. Transcatheter electrosurgical aortic leaflet laceration (BASILICA [bioprosthetic or native aortic scallop intentional laceration to prevent iatrogenic coronary artery obstruction]) is an interventional technique to prevent coronary artery obstruction. An essential step in preprocedural planning for this procedure is determining the “side view” and “central view” of the leaflet to be lacerated; this can be achieved by understanding cusp and commissural orientation along the aortic annulus S-curve. The side view is used to assess the depth of the catheter in the target leaflet, the correct orientation of the catheter toward the leaflet, and wire traversal through the leaflet. The central view is used to guide catheter manipulation to achieve a position in the center of the leaflet. Partially reproduced with permission from Komatsu et al .
Komatsu et al 34. Komatsu I, Tang GHL, Leipsic J, Webb JG, Blanke P, Mackensen GB, Kitamura M, Wolak A, Don CW, McCabe JM, Rumer C, Tan CW, Levin DB, Ramos M, Aldea GS, Reisman M, Wijeysundera HC, Radhakrishnan S, Sathananthan J, Piazza N, Kornowski R, Abdel-Wahab M, Dvir D. Distribution of C-arm projections in native and bioprosthetic aortic valves cusps: Implication for BASILICA procedures. Catheter Cardiovasc Interv Off J Soc Card Angiogr Interv. 2021 Mar;97(4):E580–7. Link. have elegantly documented the distribution of C-arm projections in native and bioprosthetic aortic valve cusps with median (interquartile range) central and side fluoroscopic angulations as follows: non-coronary cusp - LAO 59° (47°–70°) CRA 36° (29°–43°) and RAO 11° (3°–24°) CAU 25° (15°–35°), right coronary cusp - LAO 13° (2°–19°) CAU 2° (−14°–4°) and RAO 83° (69°–100°) CAU 46° (39°–52°), left coronary cusp - RAO 43° (31°–60°) CAU 41° (33°–51°) and LAO 31° (24°–41°) CRA 20° (8°–26°). In the same study, the authors identified achievable C-arm angulations for the right coronary cusp front and side views in 100% and 7.8% of patients, and for the left coronary cusp front and side views in 99.2% and 47.6%. They concluded that a right cusp BASILICA procedure would be more challenging due to the hostile C-arm angulations. Tilting the patient’s shoulders towards the right and back may alleviate the problem of the right coronary cusp side view but may also sabotage the pre-determined working angles and worsen the right coronary cusp central views.
Paravalvular leak closure
MSCT can facilitate percutaneous paravalvular leak (PVL) closure after TAVI or surgical aortic valve replacement by identifying the optimal fluoroscopic viewing angle along the aortic annulus S-curve for crossing and device implantation (Figure 30). Echocardiography, however, is needed to identify the location of the leak around the perimeter of the prosthesis and guide the orientation of multiplanar reconstruction lines using MSCT. Like BASILICA, a “central” and “side” fluoroscopic view of the leak is necessary to expedite crossing. Potential advantages of the optimal projection angles include reduced contrast volume, radiation dose, and procedural time by accelerating crossing, device positioning and deployment. In the context of long-framed transcatheter aortic valves, optimal viewing angles may facilitate co-axial strut crossing and enhance guide catheter support and device delivery.
Figure 30
Optimal fluoroscopic view for PVL plugging. Following localization using transesophageal echocardiographic (TEE) imaging, the paravalvular leak (PVL) origin can be identified and
labeled in the short-axis aortic annular plane viewed on cardiac computed tomography (CT). The optimal fluoroscopic projection for crossing and plugging can be determined by identifying a fluoroscopic view perpendicular to the PVL origin, thereby isolating (or lateralizing) the PVL origin. This figure illustrates an NCC-located PVL, which could be easily crossed and successfully closed using a fluoroscopic view perpendicular to the PVL origin (ie, a near R-L cusp overlap view, resulting in lateralization of the NCC) .
In recent years, there has been a growing interest to better understand the transseptal puncture with respect to procedures that target structures within the left atrium (e.g., left atrial appendage, mitral valve, pulmonary veins).
Atrial septum anatomy and atrial septum s-curve
The fossa ovalis is a depression in the right atrial aspect of the atrial septum. It represents the true interatrial portion and the thinnest part of the septum. Structures surrounding the atrial septum include: 1) the inferior vena cava (right inferior-posterior); 2) the infolding of the atrial septum (right superior-posterior); 3) the coronary sinus (left anterior-inferior); and 4) the noncoronary cusp of the aortic valve (left superior-anterior) 35. Klimek-Piotrowska W, Hołda MK, Koziej M, Piątek K, Hołda J. Anatomy of the true interatrial septum for transseptal access to the left atrium. Ann Anat = Anat Anzeiger Off organ Anat Gesellschaft. 2016 May;205:60–4. Link.
Using MSCT, the contours of the fossa ovalis can be traced to generate an S-curve and can provide the operator with important information about the orientation of the atrial septum in the body (i.e., vertical or horizontal) and its location relative to target structures of interest (e.g., left atrial appendage, mitral valve). The typical atrial septum S-curve transects the RAO CRA, LAO CRA, and LAO CAU quadrants of the fluoroscopic grid; it is in these quadrants where the atrial septum is appreciated in plane (Figure 31). Given its orientation from a right posteroinferior to left anterosuperior direction, the en-face view of the atrial septum can be appreciated in a RAO CAU view (i.e., right heart 2-chamber or left heart 3-chamber view) (Figure 32). In RAO CAU, there is maximal separation between the en-face view of the atrial septum and the aortic root; a transseptal needle would appear traveling into the screen and it is an optimal view to confirm avoidance of the aortic root. From a transesophageal perspective, the 2-chamber of the right and 3-chamber of the left heart are separated by an anterior to posterior displacement of the ultrasound probe.
Figure 31
Atrial septum S-curve. The typical atrial septum S-curve transects the RAO CRA, LAO CRA, and LAO CAU quadrants of the fluoroscopic grid; it is in these quadrants where the atrial septum is appreciated in plane.
Atrial septum en face view. Computed tomographic and fluoroscopic en-face view (blue dot) of the atrial septum can be appreciated in a RAO/CAU projection (i.e., right heart 2-chamber or left heart 3-chamber view.
Atrial enlargement (i.e., right, left or biatrial) can change the attitudinal orientation of the atrial septum and therefore influence the shape of the atrial septum S-curve (Figure 33). In those cases with a vertical atrial septum the transseptal needle will need a generous curve and point from left to right on the fluoroscopic screen, while in cases of a horizontal atrial septum the needle will require less curvature as it points from inferior to superior on the screen (Figure 34).
Figure 33
Atrial septum S-curves. Atrial enlargement (i.e., right, left or biatrial) can change the attitudinal orientation of the atrial septum and therefore influence the shape of the atrial septum S-curve. A vertical atrial septum orientation will be represented by a vertical atrial septum s-curve. A horizontal atrial septum will translate into a horizontal atrial septum s-curve.
Atrial septum S-curve and fluoroscopic orientation for transeptal puncture. The orientation of the atrial septum is best appreciated in the LAO-CAU bicaval view. Vertical S-curve will translate into vertical atrial septum on the fluoroscopic screen; therefore, the needle will need a generous curve and point from left to right on the screen. Horizontal S-curve will translate into horizontal atrial septum, the needle will require less curvature as it points from inferior to superior on the fluoroscopic screen. TSP: transseptal puncture. AS: atrial septum. LAO-CAU: left anterior oblique-caudal.
Transseptal puncture is typically guided by two transesophageal echocardiographic views: (1) short-axis and (2) bicaval views (Figure 35). By cross-referencing these views with MSCT, the operator may have a better understanding of the anatomical patterns and mechanics behind transseptal punctures.
Figure 35
Orientation of bicaval and short-axis views for transseptal puncture. Transseptal puncture is typically guided by two transesophageal echocardiographic views:(1) short-axis and (2) bicaval views.
MSCT multiplanar reconstructions with fluoroscopic simulations can help clarify the anatomical considerations associated with the short axis and bicaval views during transseptal puncture. Transecting the en-face view of the atrial septum across the short-axis plane of the aortic valve in a left-sided 3-chamber view will generate the transesophageal short-axis view. Fluoroscopically, this corresponds to an extreme RAO CRA viewing angle where the atrial septum is in plane and the aortic valve is seen en-face (i.e., the intersection of the atrial septum S-curve and en-face viewing angle of the aortic valve) (Figure 36). The simulated fluoroscopic images of the short-axis view will reveal that the mitral valve is practically in plane and explains why “posterior punctures” result in greater heights above the mitral valve (Figure 37, Video 2, Video 3). It can also be appreciated from the 3-chamber view that the transseptal height above the mitral valve can be influenced by the location of the short-axis cut across the aortic root. In other words, short-axis views closer to the base of the aortic annulus will result in shallower transseptal heights relative to the mitral valve than those closer to the sinutubular junction or at the tips of the aortic valve leaflets (Figure 38). The fluoroscopic images also demonstrate that the left atrial appendage is located relatively anterior to the atrial septum and requires a “posterior puncture” to become more co-axial during its occlusion (Figure 39).
Figure 36
Short-axis (blue) and bicaval (green) views of the AS in transesophageal echocardiography, MSCT and fluoroscopic view. S-curve of the AS depicting the angulations of the short-axis (blue circle) and bicaval (green circle) views.
Short axis view of the aortic valve during transeptal puncture for mitral procedures. Due to the orientation between the atrial septum (pink circle) and mitral valve (turquoise circle), a posterior puncture relative to the aortic valve, will result in a higher position relative to the mitral valve plane than an anterior puncture. LAA – left atrial appendage.
Relation between transseptal puncture height and location of the short axis view. 3-chamber view (MSCT) showing how the transseptal height above the mitral valve (purple circle) can be influenced by the location of the short-axis cut across the aortic root. The turquoise line represents a short-axis view closer to the base of the aortic annulus (yellow circle). The green line represents a short-axis view closer to the STJ (orange circle). A short axis view closer to the aortic annulus will translate into a shallower puncture (turquoise dotted line) than a puncture obtained with a short axis view at STJ level (green dotted line). STJ: sinotubular junction, AA: aortic annulus.
Transseptal puncture for left atrial appendage (LAA) closure. Due to the orientation between the atrial septum and LAA orifice (the LAA is anterior to the atrial septum), a posterior puncture relative to the aortic valve will provide a more coaxial and central orientation towards the LAA orifice. Pink circle (atrial septum), green circle (LAA orifice), red dot (anterior puncture), turquoise dot (posterior puncture).
Relation between transseptal puncture height and mitral valve height. The video shows the relation between transseptal puncture height (infero-superior aspect) with mitral valve height (antero-posterior aspect). The atrial septum (pink circle) and mitral valve (turquoise circle) are sequentially depicted in bicaval (LAO-CAU), short axis of the aortic valve (RAO-CRA), and 4-chamber view (LAO-CRA). Despite two similarly appearing punctures on the bicaval view (i.e. superior punctures), the anterior (yellow dot) and posterior (red dot) punctures from the short axis perspective translate into low and high heights from the mitral valve plane, respectively.
Relation between transseptal puncture height and mitral valve height. The video shows the relation between transseptal puncture height (infero-superior aspect) with mitral valve height (antero-posterior aspect). The atrial septum (pink circle) and mitral valve (turquoise circle) are sequentially depicted in bicaval (LAO-CAU), and four chamber view (LAO-CRA). Despite two different appearing punctures on the bicaval view (i.e. superior and inferior punctures), the superior (red dot) and inferior (green dot) punctures from the four 4-chamber perspective translate into a same/nearly same height from the mitral valve plane.
The 2-chamber view of the right heart displays the atrial septum en-face while the superior vena cava and inferior vena cava run relatively above and below it albeit the former lying slightly more anterior than the latter. Transecting the en-face view of the atrial septum from superior vena cava to inferior vena cava will generate the bicaval view. Translating this multiplanar reconstruction line towards the tricuspid valve will result in a 1-chamber view of the right and left heart with the tricuspid and mitral valves in short-axis or en-face view (i.e., LAO CAU, 1-chamber view of the right and left heart) (Figure 40). The simulated bicaval fluoroscopic view demonstrates the overlap with the 1-chamber view of the right and left heart in LAO CAU projection. The fluoroscopic bicaval view (Figure 41) provides a wealth of information about catheter manipulations in the superior/inferior and anterior/posterior directions required during transcatheter tricuspid interventions and transseptal punctures for transcatheter left-sided interventions.
Figure 40
Bicaval view. A) MSCT with multiplanar reconstruction transecting the en-face view of the atrial septum from superior to inferior vena cava. B) fluoroscopic simulation translating the multiplanar reconstruction line towards the tricuspid valve will result in a 1-chamber view of the right and left heart with the tricuspid (violet circle) and mitral (blue circle) valves in short-axis or en-face view (i.e., LAO CAUD, 1-chamber view of the right and left heart. MSCT – multislice computed tomography, turquoise circle: superior vena cava, orange circle: inferior vena cava, green line: atrial septum, white line (septal leaflet), yellow line (anterior leaflet), light blue line (posterior leaflet).
Fluoroscopic bicaval view for transcatheter procedures. Clip delivery system is simulated for transcatheter tricuspid valve edge-to-edge repair. The fluoroscopic bicaval view provides a wealth of information about catheter manipulations in the superior (pushing toward the atrial septum [green circle]), inferior (pulling toward posteroseptal commissure, anterior (counter clockwise rotation) and posterior (clockwise rotation) directions required during transcatheter tricuspid interventions for transcatheter mitral valve interventions. Circles represent: turquoise: superior vena cava, yellow: inferior vena cava, green: atrial septum, violet: tricuspid valve.
The simulated fluoroscopic bicaval view (short-axis of tricuspid and mitral valve) highlights the relative superior and inferior locations of the lateral and medial commissures of the mitral valve relative to the atrial septal plane. An extension of this describes the superior to inferior layout of the A1-P1, A2-P2, and A3-P3 segments of the mitral valve. A superior to inferior displacement of the transseptal needle in the bicaval view translates to “hovering” across the segments of the mitral valve from A1-P1 to A3-P3, respectively (Figure 42). A mid-to-superior puncture tends to “centralize” catheters above the mitral valve while retaining the ability to flex and access the A3-P3 segments (Figure 43). Inferior punctures will provide a “bicommissural” path across the major axis of the mitral valve, co-axiality to the lateral commissure, and LAA.
Figure 42
MSCT and fluoroscopic bicaval view relative to mitral valve. The simulated fluoroscopic bicaval view highlights the relative superior and inferior locations of the lateral and medial commissures of the mitral valve relative to the atrial septal plane. An extension of this describes the superior to inferior layout of the A1-P1 (yellow dots), A2-P2 (red dots), and A3-P3 (orange dots) segments of the mitral valve. Pink circle represents the atrial septum, turquoise circle represents the mitral valve. MSCT: multislice computed tomography.
Relation between infero-superior aspect of transeptal puncture and mitral valve commissures. An example of superior transeptal puncture for transcatheter mitral edge-to-edge repair is provided. The simulated fluoroscopic bicaval view highlights the relative superior and inferior locations of the lateral and medial commissures of the mitral valve relative to the atrial septal plane. A puncture closer to the superior vena cava will translate into a closer catheter position to the right trigone/A2 which facilitates catheter manipulation over the mitral valve. A puncture closer to the inferior vena cava will translate into a closer catheter position to the medial commissure which facilitates catheter direction towards the lateral commissure but may hinder catheter manipulation over the mitral valve.
PART 3 - CHAMBER ANATOMY FOR MITRAL VALVE INTERVENTIONS
Similar to transcatheter aortic valve interventions, imaging plays a critical role in the safety and efficacy of transcatheter mitral valve interventions. In addition to echocardiography, MSCT and fluoroscopy play important roles in the gamut of imaging for transcatheter mitral valve interventions. While transesophageal echocardiography has excellent spatial and temporal resolution of cardiac structures, it has poor visualization of delivery catheters and prostheses. Fluoroscopy can play a complementary role as it provides excellent spatial and temporal resolution of delivery catheters and prostheses. Interventional cardiologists are also more adept at maneuvering catheters under fluoroscopic than 2-dimensional transesophageal guidance. Merging the capabilities of both imaging modalities would therefore be beneficial. Mastering the skills and knowledge to analyze, interpret and integrate the various imaging modalities is therefore of utmost importance. As previously described, chamber views can be the common language to “master” multimodality imaging while understanding the attitudinal orientation of cardiac structures (i.e., superior vs. inferior, right vs. left, anterior vs. posterior).
The attitudinal orientation of cardiac structures such as the mitral annulus, interatrial septum or the LAA is relevant for catheter manipulation during transcatheter mitral valve interventions. Computed tomography, by virtue of its 3-dimensional data set and multiplanar reconstructions, can provide optimal chamber views that can then be adopted by echocardiography and fluoroscopy. In doing so, the target structure(s) will be seen in-plane or en-face thereby limiting parallax and foreshortening while facilitating the understanding of their orientation on the fluoroscopic screen.
Combining the imaging benefits of echocardiography and CT-derived patient-specific fluoroscopic views will allow operators to optimally visualize cardiac structures while understanding the attitudinal orientation of cardiac structures necessary for catheter manipulation.
Mitral annulus S-curve
Setting an optimal fluoroscopic view with the mitral annulus in-plane is critical for transcatheter mitral valve interventions. For instance, during transcatheter mitral valve replacement, obtaining the mitral annulus S-curve (i.e., as measured by pre-procedural MSCT) will provide the operator with all the viewing angles in which the mitral annulus appears in plane optimizing valve positioning while preventing errors induced by parallax or foreshortening. A typical mitral annulus S-curve travels across LAO CRA, shallow RAO CRA and RAO CAU quadrants while the short-axis or en-face view is in steep LAO and shallow CAU projection (Figure 44). The geometric characteristics of the S-curve are the result of the mitral annulus orientation inside the chest: a “vertical” annulus, enfaced in a steep LAO shallow CAU projection, generates an equally vertical slope of the S-curve, whereas a “horizontal” annulus is seen en-face in a shallow LAO steep CAUD view and results in a horizontal S-curve, with shallow CRA CAU deflections (Figure 45).
Figure 44
Mitral annulus S-curve. A typical mitral annulus S-curve travels across shallow LAO CRA, RAO CRA, and RAO CAU quadrants while the short-axis or en-face view is in steep LAO and shallow CAU projection. Chamber views emerge while transitioning across the mitral S-curve: a 4-chamber view is reached in the LAO CRA quadrants of the grid, a 2-chamber view is normally identified in shallow RAO CRA while an optimal 3-chamber or long axis view is typically described in the RAO CAU quadrant. The 1-chamber or mitral valve short axis view is reached in LAO CAU. Fluoroscopic and TEE images are provided for each chamber view.
Mitral annulus S-curve. Geometric characteristics of the mitral annulus S-curve are the result of the mitral annulus orientation inside the chest. A “vertical” annulus generates an equally vertical slope of the S-curve, whereas a “horizontal” annulus results in a horizontal mitral annulus S-curve.
The double S-curve method aims to define the fluoroscopic view where two structures are seen in plane by identifying the intersection of their respective S-curves, overlapped on the same fluoroscopic grid. Double S-curves are extremely useful in transcatheter mitral valve interventions, for instance, to appreciate the anatomical relationships between the aortic and the mitral annuli (intersecting the mitral and aortic annuli S-curves) or to obtain optimized views for the transeptal approach to the mitral valve (intersecting the mitral annulus and the interatrial septum S-curves) (Figure 46).
Figure 46
Double S-curve utility for transcatheter mitral valve interventions. The intersection of the mitral and aortic annulus S-curves defines the view (RAO CAU) where both structures are in plane allowing the operator to properly appreciate their attitudinal relationship. The blue column shows the aorto-mitral angle which is relevant for predicting the risk of LVOT obstruction during transcatheter mitral valve replacement. The green column shows a 4-chamber view where the interatrial septum and mitral annulus S-curves intersect and therefore are seen in plane. This view represents the optimal view for catheter navigation from the atrial septum into the mitral valve as it best reflects "the pathway" between both structures.
Chamber views of the mitral valve for transcatheter interventions
Classical left heart chamber views are well established in echocardiography while assessing the mitral valve apparatus and guiding percutaneous mitral valve interventions. Classical or “blending” echocardiographic chamber views of the left heart can be easily identified on pre-procedural MSCT analysis while transitioning across the mitral S-curve: a 4-chamber view is reached in the LAO CRA quadrants of the grid, a 2-chamber view is normally identified in shallow RAO CRA while an optimal 3-chamber or long axis view is typically described in the RAO CAU quadrant. The 1-chamber or mitral valve short axis view is reached in LAO CAU (Figure 44).
Although fluoroscopy and echocardiography provide identical information about the relative position of cardiac structures, the orientation of these structures may differ on the viewing screen. Despite its unorthodox nature, echocardiographic windows can be modified (e.g., rotated, inverted) to match fluoroscopic orientations. The major advantage of this approach is the direct translation of chamber views and catheter movements between fluoroscopy and echocardiography.
For each chamber view obtained on MSCT analysis, the processing software provides the corresponding angulations of the C-arm required to obtain the same fluoroscopic perspective of the heart and generates a fluoroscopic simulation where the target structure (e.g., the mitral annulus) and the surrounding anatomical structures of interest (e.g., interatrial septum, aortic valve, LAA, papillary muscles) can be highlighted (Figure 10). Fluoroscopic pattern recognition is beneficial for understanding the spatial relationships between anatomical targets inside the left heart chambers thus facilitating catheter manipulation inside the heart by understanding their attitudinal orientation (for additional details consult the section on “Fluoroscopic anatomy in view of heart chambers: The fluoroscopic left heart”).
THE UTILITY OF MITRAL ANNULUS S-CURVE AND FLUOROSCOPIC LEFT HEART ANATOMY FOR TRANSCATHETER MITRAL VALVE INTERVENTIONS
During transcatheter mitral valve interventions (e.g., transcatheter mitral edge-to-edge repair [TEER], transcatheter mitral valve replacement [TMVR]), precise identification of the anatomic target by multimodally imaging is crucial. TEE and fluoroscopic guidance, supported by preprocedural MSCT analysis, enable accurate trajectory and alignment of delivery systems, facilitating device navigation, positioning, and deployment. Obtaining patient-specific CT-derived optimal fluoroscopic views might facilitate the understanding of mitral valve anatomy and the attitudinal relationships with the left heart structures, enhancing the efficacy, timing, and safety of the procedure.
Transcatheter mitral valve edge-to-edge repair
Each procedural step of mitral TEER is normally guided by TEE using classical left heart chamber views and 3D or surgical viewing of the mitral valve from the left atrium, appreciating leaflet coaptation and regurgitant jet(s). The corresponding fluoroscopic views are defined by mitral S-curve analysis as described above, and should be adopted during the procedure to achieve the same perspective with both imaging modalities.
The transeptal procedural step requires fluoroscopic and TEE imaging guidance. Previously acquired CT images can simulate the potential puncture site by providing reformats in TEE standard views, such as the bi-caval, short-axis and 4 chamber views (Figure 35 and Figure 36) (for additional details consult Part 2: Transseptal puncture).
Following transseptal puncture, optimal visualization of device advancement into the left atrium, guiding catheter deflection is achieved in a 4-chamber view (typically with an average LAO 10° CRA 40°) where both the interatrial septum and mitral valve are in plane, allowing a clear appreciation of the distance and the trajectory of the catheter between the two structures (Figure 46). Clip arm orientation and positioning are guided by both TEE and fluoroscopy, adding complementary information on delivery system three-dimensional maneuvers.
The 1-chamber (short axis) view of the mitral valve highlights the relative superior and inferior locations of the lateral and medial commissures of the mitral valve relative to the atrial septal plane. An extension of this describes the superior to inferior layout of the A1-P1, A2-P2, and A3-P3 segments of the mitral valve. The 2-chamber/bicommissural view (average fluoroscopic angulation: RAO 30° CRA 15°) is used to guide the catheter movement between the medial and lateral commissures where the trajectory between A1-P1 and A3-P3 is maximally elongated. Pushing the guide catheter moves the catheter toward the lateral commissure superiorly whereas pulling moves the catheter toward the medial commissure inferiorly. (Figure 47).
Figure 47
Catheter manipulation for transseptal transcatheter mitral valve procedures across different chamber views. Green panel: 1-chamber fluoroscopic view; mitral annulus (red circle), aortic annulus (yellow circle), interatrial septum (light blue circle) and left atrial appendage (violet circle) are simulated. Attitudinal orientation is indicated: superior (top), inferior (bottom), anterior (left-superior), and posterior (right-inferior). Blue and orange lines indicate the 2-chamber and 3-chamber views, respectively. A clip catheter demonstrates movement in all three panels. Blue central panel: mid esophageal TTE, fluoroscopy, and fluoroscopic simulation of the 2-chamber view. Orange central panel: mid-esophageal TTE, fluoroscopy, and fluoroscopic simulation of the 3-chamber view. Catheter movements are indicated by orange arrows for clockwise and counterclockwise rotation, and blue arrows for push and pull actions. Anterior: anterior mitral leaflet (A1-A2-A3); posterior: posterior mitral leaflet (P1-P2-P3).
Achieving optimal catheter coaxially along the coaptation line of the target mitral valve segment necessitates antero-posterior movements of the clip delivery system. These movements are best visualized in a fluoroscopic 3-chamber view (RAO 60° CAUD 45°) where a counter-clocking the guide catheter moves the clip toward the anterior leaflet anteriorly and clocking moves the clip toward the posterior leaflet posteriorly (Figure 47). The final orientation of the delivery catheter should be perpendicular to the mitral annular plane, before ventricular diving. This is typically best appreciated in 1 chamber view (Figure 47). Rotating the clip delivery system clockwise or counterclockwise to fine-tune the positioning of the arms over the leaflet coaptation line is subsequently verified through a combination of 3D TEE and fluoroscopy in multiple corresponding views. When clip’s arms are orthogonal to the leaflets coaptation line, they should be overlapped in 2-chamber view and fully open in 3-chamber views. The same orientation should be maintained while approaching the valve to dive into the left ventricle if no interference with the mitral apparatus is encountered. After ventricular diving, the 3-chamber view is the preferred perspective to follow leaflet grasping, since the anterior and the posterior mitral leaflets are fully separated and clip arms are equally opened without foreshortening. Anterior-posterior and lateral-medial swings of the clip to optimize leaflet insertion, are visualized in 3-chamber and 2-chamber view as right-superior and left-inferior swinging of the delivery catheter on the fluoroscopic screen, respectively. When both leaflets are grasped and the clip is closed, some distance between clip arms and grippers witnesses leaflet insertion inside the device. Final arm angle assessment should be followed in the same 3-chamber view, verifying that the clip’s arms maintain the same configuration before the device is released.
Finally, for the same principle, when multiple clips are implanted, they should be overlapped in 3-chamber and positioned side by side in 2-chamber view. The first clip can thus serve as a fluoroscopic reference to orient the second clip, using appropriate angulations of the fluoroscopic arm usually 2-chamber view. Clips that are relatively superior in a 2-chamber fluoroscopic view (e.g., RAO 30 CRAN 15) are lateral to those located more inferiorly.
Transcatheter mitral annuloplasty
Transcatheter annuloplasty is a suitable treatment option for the treatment of severe mitral regurgitation secondary to annular dilation, either alone or in combination with TEER. Several annuloplasty devices have been used in preliminary clinical experiences, sharing the common rationale of a surgical-like annular restriction to improve mitral leaflet coaptation , 36. Edelman JJ, Meduri CU, Yong G, Thourani VH. Transcatheter devices for direct annuloplasty and chordal replacement in degenerative mitral regurgitation. Vol 10, Annals of cardiothoracic surgery. China; 2021 p164–6 Link37. Khatib D, Neuburger PJ, Pan S, Rong LQ. Transcatheter Mitral Valve Interventions for Mitral Regurgitation: A Review of Mitral Annuloplasty, Valve Replacement, and Chordal Repair Devices. J Cardiothorac Vasc Anesth. 2022 Oct;36(10):3887–903 Link. In combination with 3D TEE guidance, multiple fluoroscopic views can be preliminarily identified along the mitral S-curve. This aids in the positioning of anchors, allowing for the isolation of the selected fixation points on one side of the fluoroscopic screen. The two extremities of the band are anchored on the commissural aspects of the mitral annulus, maximally separated in a 2 chamber bicommissural view. Intermediate anchors’ locations along the posterior ring can be sequentially lateralized on the screen in a 4 chamber (P1), 3 chamber (P2) and a dedicated off-chamber (P3) view. The final position of the device is best visualized without foreshortening in the 1 chamber or en-face view of the mitral annulus. Given that the left circumflex (LCx) runs along the mitral valve annulus, the 1-chamber view can provide useful information about the spatial relationship between the LCx and mitral annulus. A contrast injection in the left coronary system is repeatedly performed during and after the procedure, to rule out iatrogenic obstruction of the circumflex coronary artery.
Transcatheter mitral valve replacement (TMVR)
During deployment of a transcatheter heart valve within a surgical ring, bioprosthetic valve, or mitral annular calcification, the principal imaging concerns are device depth in relation to the plane of the annulus, coaxiality of the device in relation to the mitral annulus, and complete expansion of the device within the constraining tissue.
The execution of each procedural can be optimized by selecting the appropriate combination of optimal TEE and CT-derived fluoroscopic views, which aids operators in manipulating the TMVR system by offering a clearer perspective on the attitudinal orientation of left heart structures and their corresponding chamber view.
Optimal fluoroscopic/chamber views are complementary perspectives to observe delivery catheter steering in medial-lateral (attitudinally inferior-superior) and antero-posterior directions. Figure 48 shows the required procedural steps for the transseptal implantation of a specific transcatheter mitral valve prosthesis. The HighLife transseptal mitral valve replacement device is a dual component system consisting of the prosthetic valve and a ring that sits below the native mitral valve. The prosthetic valve is implanted over a delivery system in the mitral position and is anchored by interacting and reaching an equilibrium position with the previously positioned subannular implant. In addition to echocardiographic guidance, using optimal fluoroscopic chamber views can facilitate the operator to perform each procedural step (Figure 48).
Figure 48
Fluoroscopic chamber views can facilitate performing more challenging interventions such as transcatheter mitral valve replacement. Step by step for a specific device implantation. 1- Wire looping around the mitral valve annulus requires a combination of 1-, 2-, and 3-chamber views while navigating with the wire around the mitral annulus. 2- Ring placement is best appreciated in 1-chamber view. 3- Prosthetic valve advancement from the interatrial septum into the mitral valve as well as mitral valve implantation is best appreciated in 4-chamber view.
Mitral paravalvular leak occurs in up to 12.5% of the patients after surgical mitral valve replacement 38. Genoni M, Franzen D, Vogt P, Seifert B, Jenni R, Künzli A, Niederhäuser U, Turina M. Paravalvular leakage after mitral valve replacement: improved long-term survival with aggressive surgery?. Eur J cardio-thoracic Surg Off J Eur Assoc Cardio-thoracic Surg. 2000 Jan;17(1):14–9 Link and it may require percutaneous plugging to reduce/eliminate the regurgitant volume. The most common locations are antero-lateral and postero-medial segments of the mitral valve annulus 39. De Cicco G, Russo C, Moreo A, Beghi C, Fucci C, Gerometta P, Lorusso R. Mitral valve periprosthetic leakage: Anatomical observations in 135 patients from a multicentre study. Eur J cardio-thoracic Surg Off J Eur Assoc Cardio-thoracic Surg. 2006 Dec;30(6):887–91 Link. TTE is used to identify the location of the leak around the perimeter of the prosthetic valve and guide the orientation of multiplanar reconstruction lines using MSCT. MSCT can facilitate percutaneous closure by identifying the optimal fluoroscopic viewing angle and chamber view along the mitral annulus S-curve for crossing and device implantation (Figure 49).
Figure 49
Optimal fluoroscopic view for mitral para valvular leak (PVL) plugging. Following localization using transesophageal echocardiographic (TEE) imaging, the PVL origin can be identified and labeled in the short-axis mitral annular plane viewed on cardiac multislice computed tomography. The optimal fluoroscopic projection for crossing and plugging can be determined by identifying a fluoroscopic view perpendicular to the PVL origin, thereby isolating (or lateralizing) the PVL origin. This figure illustrates 3 different PVL origins (at A3, P2 and P1 mitral valve segments), with their corresponding optimal fluoroscopic views. An example of a P2 segment PVL plugging which could be easily crossed and successfully closed using a fluoroscopic 3-chamber view is provided.
Despite the challenges associated with imaging, transcatheter tricuspid valve interventions have shown promising outcomes. Following the same imaging principles as those described for transcatheter mitral valve interventions, tricuspid valve interventions can be optimized by a comprehensive understanding of the fluoroscopic tricuspid valve and surrounding structures’ attitudinal orientation. The integration of chamber views across various imaging modalities, such as MSCT, MSCT-derived optimal fluoroscopic view, and echocardiography, will allow operators to optimally visualize cardiac structures while understanding the attitudinal orientation of cardiac structures necessary for catheter manipulation.
Tricuspid annulus S-curve and chamber views
Due to the comparable attitudinal orientation of the tricuspid annulus to that of the mitral valve, the tricuspid annulus S-curve aligns with the same quadrants on the fluoroscopic grid. A typical tricuspid annulus S-curve travels across RAO CAU, LAO CRA, RAO CRA and the short-axis is obtained in steep LAO shallow CAU projection 5. Pighi M, Thériault-Lauzier P, Alosaimi H, Spaziano M, Martucci G, Xiong TY, Buithieu J, Ybarra LF, Afilalo J, Leipsic J, Ozden Tok O, Mousavi N, Mangiameli A, Pilgrim T, Praz F, Windecker S, Piazza N. Fluoroscopic Anatomy of Right-Sided Heart Structures for Transcatheter Interventions. JACC Cardiovasc Interv. 2018 Aug;11(16):1614–25. Link (Figure 50).
Figure 50
Tricuspid annulus S-curve. A typical tricuspid annulus S-curve travels across LAO CRA, shallow RAO CRA, and RAO CAU quadrants while the short-axis or en-face view is in steep LAO and shallow CAU angulation on the fluoroscopic grid. Chamber views emerge while transitioning across the mitral S-curve: a 4-chamber view is reached in the LAO CRA quadrants of the grid, a 3-chamber view is normally identified in shallow RAO CRA while an optimal 2-chamber is typically described in the RAO CAU quadrant. The 1-chamber or tricuspid valve short axis view is reached in LAO CAU. Fluoroscopic and TEE images are provided for each chamber view.
Classical or “blending” echocardiographic chamber views of the right heart can be easily identified on pre-procedural MSCT analysis while transitioning across the tricuspid S-curve: an optimal 4-chamber view is typically described in the mild LAO/ RAO and steep CRA angulation, a 3-chamber or long axis view is obtained in the mild RAO/CRA quadrant while a 2-chamber view is obtained in RAO/CAU quadrant of the grid. The 1-chamber or tricuspid valve short axis view is obtained in LAO/ CAU views (Figure 50).
For each chamber view obtained on MSCT analysis, the processing software provides the corresponding angulations of the C-arm required to obtain the same fluoroscopic perspective of the heart and generates a fluoroscopic simulation where the target structure (e.g., the tricuspid annulus) and the surrounding right sided anatomical structures (e.g., Inferior vena cava, interatrial septum, etc.) can be highlighted (Figure 15). Fluoroscopic pattern recognition is beneficial for understanding the spatial relationships between anatomical targets inside the right heart chambers thus facilitating catheter manipulation inside the heart by understanding their attitudinal orientation (for additional details consult the section on “Fluoroscopic anatomy in view of heart chambers: The fluoroscopic right heart”).
The one-chamber view of the right heart is obtained by orienting the C-arm in the LAO CAU projection (average fluoroscopic angulation: LAO 55° CAU 15°) 17. Hahn RT, Weckbach LT, Noack T, Hamid N, Kitamura M, Bae R, Lurz P, Kodali SK, Sorajja P, Hausleiter J, Nabauer M. Proposal for a Standard Echocardiographic Tricuspid Valve Nomenclature. JACC Cardiovasc Imaging. 2021 Jul;14(7):1299–305 Link and displays the en-face or short-axis view of the tricuspid valve. A closer look at the 3-dimensional short-axis view of the tricuspid valve will reveal the superimposed bicaval view of the right heart. As previously discussed in the transeptal puncture section, transecting the en-face view of the atrial septum (2 chamber view) from superior to inferior vena cava will generate the bicaval view. Translating the multiplanar reconstruction line towards the tricuspid valve will generate the 1-chamber view of the right heart with the tricuspid valve in the short axis (Figure 16). Although difficult to appreciate on 2-dimensional slice thickness imaging (i.e., echocardiography and MSCT), the simulated fluoroscopic and 3-dimensional echocardiographic short-axis views of the tricuspid valve eloquently reveal the underlying bicaval anatomy and provide the foundation to understanding catheter movements within the right atrium targeting the tricuspid valve. Through an overlay of a 12-hour clock on the en-face view of the tricuspid valve, it can be appreciated that counter-clockwise maneuvers of a catheter directed towards the tricuspid valve from the inferior vena cava will direct it towards the anterior leaflet while clockwise maneuvers towards the septal leaflet. Pushing a co-axial catheter superiorly from the inferior vena cava will generally direct it from posteroseptal to anteroseptal commissure (Figure 51).
Figure 51
Catheter manipulation for transcatheter tricuspid valve procedures across different chamber views. Green panel: 1-chamber fluoroscopic view, tricuspid annulus (pink circle), inferior vena cava (orange circle) and superior vena cava (turquoise circle), are simulated. Attitudinal orientation is indicated: superior (top), inferior (bottom), anterior (left), and posterior (right). Blue and orange lines indicate the 3-chamber and 4-chamber views, respectively. A clip catheter demonstrates movement in all three panels. Blue central panel: MDCT, fluoroscopy, and mid-esophageal TEE of the 3-chamber view. Orange central panel: MDCT, fluoroscopy, and mid-esophageal TEE of the 4-chamber view. In the three panels, the anterior leaflet is represented by a yellow line, the posterior leaflet by a blue line, and the septal leaflet by a white line. Catheter movements are indicated by orange arrows for clockwise and counterclockwise rotation, and blue arrows for push and pull actions. A= anterior leaflet; P= posterior leaflet; S= septal leaflet.
The 1-chamber view can provide important insights into the anatomic variability between the inferior vena cava, atrial septum, and tricuspid valve annulus. (Figure 52) demonstrates that while the inferior vena cava and atrial septum maintain a relative inferior-superior relationship, this complex may shift posteriorly and become off-centered from the tricuspid valve annulus. In (Figure 52 A), a catheter emerging from the inferior vena cava would enter the right atrium co-axial to the tricuspid valve annulus after leftward flexion. In Figure 52 C, however, the inferior vena cava is not co-axial with the tricuspid valve annulus and would require an initial anterior flexion before “diving down” (i.e., attitudinally leftward) toward the center of the tricuspid valve annulus. This latter scenario can create the phenomenon known as the “septal hugger” wherein the delivery catheter abuts against the septum and encounters difficulty in achieving co-axiality with the tricuspid valve annulus prior to anterior flexion. The “septal hugger” can be exacerbated by a relatively low-lying atrial septum that is in file with the inferior vena cava. Given the proximity between the antero-septal commissure and atrial septum, co-axial access to the antero-septal commissure during transcatheter edge-to-edge interventions can be challenging in the presence of a “septal hugger”. For these reasons, transcatheter tricuspid valve delivery systems entering from the inferior vena cava are designed with an additional flex capability to circumvent the non-coaxial inferior vena cava and “septal hugger”. The ostium of the superior vena cava is located anterior to that of the inferior vena cava and provides better co-axiality to the tricuspid valve annulus without the need for additional flexion that is typically required with transfemoral venous delivery.
Figure 52
Anatomical variability (coaxiality) between IVC and TA in 1 chamber view. 1-chamber (short axis) view in patients 1, 2, and 3, depicted in blue panels. TA (pink circle), anterior leaflet (white line), posterior leaflet (red line), septal leaflet (orange line), IVC (yellow circle) and interatrial septum (green circle), are simulated. Blue arrow indicates the TA approach from the IVC. Coaxiality variability between the IVC and TA can be observed between the 3 patients, being coaxial in patient 1 whereas in patient 3 IVC is severely non-coaxial to TA. TA= tricuspid annulus; IVC= inferior vena cava.
Using a near 3-chamber view (RAO with slight CAU or CRA angulation) can provide valuable fluoroscopic information for transcatheter tricuspid valve interventions. This view aligns the orifice of the inferior vena cava and the tricuspid valve within the same plane, facilitating the assessment of the relative angle and distance between these two structures, which may exhibit significant variability among different patients (Figure 53).
Figure 53
Anatomical variability (distance) between IVC and TA in a near 3-chamber view (RAO/slight CAU) in patients 1, 2, and 3, depicted in blue panels. TA (pink circle) and IVC (yellow circle) are simulated. Curved blue arrow indicates the TA approach from the IVC. Straight blue arrow indicated the distance between the IVC and the TA. Distance variability between the IVC and TA can be observed between the 3 patients. A long distance IVC-TA distance is present in patient 1, whereas the shortest IVC-TA distance is observed in patient 3. TA= tricuspid annulus; IVC= inferior vena cava.
Similar to mitral TEER, tricuspid TEER can be facilitated by a multimodality approach, guided by both TEE and CT-derived optimal fluoroscopic and chamber views. To facilitate device navigation, positioning, and deployment of a TEER system the following steps can be used:
Step 1- The en-face view (1 chamber view) of the tricuspid valve (average LAO 55 CAU 15) is obtained. This view offers valuable insights into assessing the alignment and coaxiality of the IVC in relation to the tricuspid annulus. Accurate alignment is essential to ensure the TEER delivery system is positioned perpendicular to the leaflet coaptation line. Ideally, both the delivery catheter and the tricuspid annulus should be coaxial with a single flexion plane (Figure 52A). In cases where the IVC entry into the RA is located posterior to the tricuspid annulus (Figure 52C), it is essential to reposition the delivery system to the center before flexing it toward the annular plane preventing the 'septal hugger’ phenomenon. Achieving this repositioning can be accomplished by utilizing lateral flexion (L knob), which moves the TEER delivery system anteriorly. Furthermore, the delivery device can be flexed such that the delivery device appears to be moving “into and out of the screen” indicating it is coaxial to the tricuspid valve annulus.
Step 2- After achieving proper alignment of the delivery catheter with the en-face view of the tricuspid valve in 1-chamber view, a 3-chamber view of the right heart in approximate RAO 30 can facilitate flexion toward the tricuspid valve annulus that typically lies vertical on the fluoroscopic screen. This catheter movement is facilitated by a near 3-chamber view (RAO with slight CAU CRA) since both the IVC and the tricuspid annulus are in plane and therefore the distance and angulation between them can be accurately appreciated (Figure 53).
Step 3- Following the advancement of the delivery system across the tricuspid valve annulus, the 1-chamber (short-axis) view of the tricuspid valve is used to guide the orientation of the clip arms based on the grasping strategy established during the pre-procedural TEE. It is important to highlight that the orientation of the clip arm can vary based on the selected grasping strategy and the specific anatomy of the tricuspid valve. Through an overlay of a 12-hour clock on the en-face view of the tricuspid valve, it can be appreciated that, for instance, in a septal-anterior grasping strategy, the clip arm is typically oriented between 4 and 10 o'clock on the fluoroscopic 1-chamber view in LAO CAU (Figure 54). Conversely, a septal-posterior grasping strategy would position the clip arm between 2 and 8 o'clock.
Figure 54
Clip orientation in 1-chamber view/transgastric view according to the grasping strategy. Tricuspid annulus (pink circle), anterior leaflet (yellow line), posterior leaflet (blue line), septal leaflet (white line), inferior vena cava (orange circle) and superior vena cava (turquoise circle), are simulated. The orientation of the clip arm can vary based on the selected grasping strategy and the specific anatomy of the tricuspid valve. This figure illustrates a septal-anterior grasping, in A) conventional transgastric TEE view, B) modified transgastric TEE view with an overlay of a 12-hour clock, C) simulated fluoroscopy, D) actual fluoroscopy and E) overlay of a 12-hour clock on the en-face view of the tricuspid valve. The clip arm is typically oriented between 4 and 10 o clock on the modified TEE transgastric view and fluoroscopic 1-chamber view in LAO CAU. A= anterior leaflet; P= posterior leaflet; S= septal leaflet.
Step 4- During clip deployment, TEE plays a crucial role in guiding and confirming clip orientation, leaflet insertion, and leaflet grasping, especially when using transgastric and long-axis views. Additionally, fluoroscopic chamber views provide valuable insights for fine-tuning clip position and orientation. For instance, the 3-chamber view of the right heart is particularly helpful in aligning the clip along the septal leaflet (septal/posterior-septal/anterior), accounting for potential anatomical variations. In this view, the clip will be seen in profile, pulling the stabilizer displaces the clip inferiorly on the screen toward the postero-septal commissure, whereas pushing it moves the clip superiorly on the screen toward the antero-septal commissure (Figure 51). The 4-chamber view is another valuable perspective. In this view, the clip will be seen with their arms opened, clockwise rotation of the guide catheter directs the clip posteriorly toward the septal leaflet, which is visible on the right side of the screen, while counterclockwise rotation shifts it anteriorly toward the anterior/posterior leaflets, which are visible on the left side of the screen (Figure 51). Furthermore, the 2-chamber view of the right heart aids in orienting the clip across the target commissure (providing a profile view of the clip in either antero-septal or postero-septal leaflets grasping) and it can also be helpful for positioning a second clip.
Transcatheter tricuspid annuloplasty
Transcatheter tricuspid annuloplasty system aims at reducing tricuspid regurgitation by decreasing the annulus size. Device positioning and deployment can be optimized by 3D TEE guidance aided by tricuspid annulus S-curve and the corresponding chamber views. Utilizing a patient-specific CT-derived 3-chamber view of the right heart (RAO shallow CAU or CRA) aligns the inferior vena cava and tricuspid annulus in the same plane. This view aids the operator in understanding the necessary annuloplasty system flexion while approaching the tricuspid annulus. The 1-chamber view is invaluable at various stages of the procedure: I-Lateral flexion alignment: It provides insight into the lateral (anterior) flexion required for achieving coaxial alignment with the tricuspid annulus. II-Implantation process guidance: the view allows the operator to track the implantation process, which typically starts at the antero-septal commissure (12 o'clock) with counterclockwise deployment of multiple anchors extending to the posterior annulus. III-Spatial relationship with RCA: given the proximity of the RCA to the tricuspid annulus, this view offers essential information about their spatial relationship ensuring the avoidance of RCA damage. IV-Longitudinal views in 2- and 3-chamber views of the right heart along the tricuspid valve annulus S-curve can provide coaxial views of the annulus as the anchors (or device) travels counter-clockwise from the antero-septal commissure, respectively.
Transcatheter tricuspid valve replacement (TTVR)
TTVR can be enhanced through the synergistic use of TEE and optimal fluoroscopic projection views. This combination aids operators in manipulating the TTVR system by offering a clearer perspective on the attitudinal orientation of right heart structures and their corresponding chamber views. The angle between the IVC and TA is best obtained in near 3-chamber view (RAO shallow CAU or CRA), where both structures are visualized in plane. Attaining the ideal anatomy in the short-axis 1-chamber view for most devices involves aligning the entry of the IVC to the right atrium with the center of the tricuspid annulus. Ideally, both the delivery catheter and the tricuspid annulus should be coaxial within a single flexion plane (Figure 52). However, when the IVC entry to the right atrium is positioned posteriorly relative to the tricuspid annulus, it becomes necessary to center the delivery catheter before flexing it toward the annular plane. In such situations, achieving coaxial alignment with the TA may require lateral flexion or the utilization of a "secondary curve" on the delivery system (Figure 52 B and Figure 52 C).
During transcatheter tricuspid valve-in-valve implantation, precise alignment between the delivery system and the tricuspid annulus is paramount for successful valve placement. Although the preferred access route is via the internal jugular or superior vena cava, the vast majority of currently available devices are delivered from the femoral vein/IVC. The 3-chamber view offers several advantages: I-Stiff wire positioning: In this view, the SVC, tricuspid annulus, and pulmonary valve are in plane, facilitating operators in navigating from the SVC to the pulmonary valve via the right atrium and tricuspid valve. This prevents catheter/wire foreshortening and provides a clear understanding of the distance and angulation between these structures. II-Valve implantation: Considering that the RV inflow and RV outflow are elongated and maximally separated, the 3-chamber view aids in accurately assessing the depth of implantation and enables a comprehensive evaluation of potential RVOT obstruction (Figure 55).
Figure 55
Importance of 3-chamber view in tricuspid valve-in-valve procedure. TA (pink circle), SVC (turquoise circle) and PV (black circle) are simulated. A catheter delivery across the SVC, TA, and PV is also simulated. A) The 3-chamber view (blue panel) is the optimal fluoroscopic view for catheter delivery since SVC, TV, and PV are in plane, ensuring accurate catheter delivery without foreshortening. In contrast, the 1 (green panel), 2 (red panel), and 4 (orange panel) chamber views are suboptimal since the 3 structures are not in plane, resulting in catheter foreshortening. B) Emphasizes the significance of the 3-chamber view for stiff wire delivery and precise valve deployment in tricuspid valve-in-valve procedures. TA= tricuspid annulus; SVC= superior vena cava; PV=pulmonary valve.
PART 5- FLUOROSCOPIC ANATOMY IMPLICATIONS FOR CORONARY INTERVENTIONS – BACK TO THE FUTURE WITH A THIRD DIMENSION
Invasive coronary angiography has excellent resolution and remains the gold standard of coronary imaging since the late 1970s 40. Ryan TJ. The coronary angiogram and its seminal contributions to cardiovascular medicine over five decades. Circulation. 2002 Aug;106(6):752–6. Link. Meanwhile, fluoroscopy holds several important drawbacks: 1- the inert dependency on contrast agent radiopacity for visualization of structures has accustomed operators to focus on contrast-enhanced vessels, while ignoring the underlying heart wall/structures. 2- fluoroscopy has historically been performed using a limited set of routine viewing angles as “one-size-fits-all” approach, which is frequently suboptimal in patients with anatomic variations or disease-specific remodeling. 3- the 2D nature of fluoroscopy often hampers estimation of vessel caliber and length due to parallax/foreshortening. In addition, vessels overlap frequently impedes optimal assessment of arteries/branches. These pitfalls may result in misdiagnosis of the severity of coronary artery disease or cause geographic miss during interventions leading to target vessel revascularization, especially in those cases of coronary ostial or bifurcation stenting. Pre-procedural coronary assessment by 3D tomography might help to overcome the limitations of fluoroscopy by providing crucial information regarding coronary anatomy and optimal strategy of PCI. In the current section we describe the fluoroscopic coronary anatomy in light of chamber views and discuss potential implications of 3D imaging in the planning of fluoroscopy-guided coronary interventions.
Fluoroscopic chamber views can be used as reference patterns for description of the coronary tree anatomy. Correct perception of the relation between angiographic coronary patterns and associated cardiac walls/structures might allow for better understanding of the applications of specific fluoroscopic angles during diagnostic and interventional procedures. Attitudinally, the coronary tree sprawls on an atrioventricular/short-axis, extending rightward and inferiorly, and an interventricular/long-axis, extending leftward and inferiorly (Figure 56). An orthogonal projection of these two axes can be obtained by a cardiac four-chamber view across imaging modalities, including fluoroscopy (LAO CRA). In this view, the left anterior descending (LAD) artery is seen elongated running within the anterior interventricular groove toward the apex supplying the anterior wall of the heart. Posterior descending artery is seen overlapped with LAD running within the posterior interventricular groove supplying the postero-inferior wall. Indeed, coronary dominance can be readily determined in this view. Diagonal branches arise laterally and supply the antero-lateral wall. Septal branches are also seen supplying the septal wall. The LCx and right coronary arteries circumvent the mitral and tricuspid annuli, respectively, within the atrioventricular groove which appear in plane. Obtuse marginal branches from the circumflex artery and acute marginal branches from the RCA run inferiorly and supply the postero-lateral and lateral walls of the left and right ventricle, respectively.
Figure 56
Cardiac short and long axes in a four-chamber view (LAO CRA) during coronary angiography. The coronary tree sprawls on an atrioventricular/short-axis, extending rightward and inferiorly, and an interventricular/long-axis, extending leftward and inferiorly (A). Left ventricle angiogram in a four-chamber view shows the anterolateral, apical and anteroseptal walls of the left ventricle (B). The RCA circumvents the tricuspid valve along the atrioventricular axis (C). The LAD artery runs leftward and inferiorly toward the apex along the interventricular cardiac axis (D).
The cardiac atrioventricular/short axis can be projected in 1-chamber or “spider” view (LAO CAU). In this view the left main coronary artery (LMCA) originating from the left coronary sinus appears elongated and its bifurcation into the LAD artery and circumflex arteries can be properly appreciated. The mitral and tricuspid annuli appear en-face circumvented by the left circumflex artery and RCA within the atrioventricular groove. Vessels with a course toward the apex, along the interventricular axis - the LAD artery, its diagonal branches and the obtuse marginals of the circumflex artery - appear with various degree of foreshortening (Figure 57).
Figure 57
Coronary anatomy from a fluoroscopic one chamber view of the left heart (LAO CAU). In this view the RCA (purple) and circumflex (yellow) are seen elongated in its course along atrioventricular groove. The posterior descending artery is foreshortened. The LAD (red) is foreshortened within the interventricular groove.
A mirror image of the LAD/circumflex arteries pattern obtained in one chamber view can be obtained in an opposite projection (RAO/CRA) on a 2-chamber view of the left heart (Figure 58). In this view it is the LAD that is seen fully elongated in its course along the anterior wall while the circumflex artery is foreshortened within the atrioventricular groove. From this view a caudal rotation toward the 3-chamber view will separate the aortic and mitral valve and elongate the course of the circumflex artery and its marginal branches. The three-chamber view of the left heart display the LAD along the anteroseptal wall, well separated from the circumflex artery which run an orthogonal course toward the inferolateral wall (Figure 59).
Figure 58
Coronary anatomy from a fluoroscopic two chamber view of the left heart (RAO CRA). In this view the LAD is seen fully elongated in its course along the anterior wall (red) and the circumflex artery is foreshortened within the atrioventricular groove (yellow-green). The mid-RCA (purple) can be also appreciated while the proximal and distal parts are foreshortened.
Coronary anatomy from a fluoroscopic three chamber view (RAO CAU). On three-chamber view, the mitral and aortic valve are both in plane. Left system (A) - display the LAD artery (red) along the anteroseptal wall, well separated from the circumflex artery (yellow-green) which run an orthogonal course toward the inferolateral wall. Right system (B) - the mid RCA (purple) is fully elongated along the atrioventricular axis while the proximal and distal parts are foreshortened.
Myocardial perfusion scan can be also interpreted as chamber views. In fact, the distribution of the radioactive tracer across the heart walls is represented in one chamber (anterior, posterior, septal and lateral walls), two chamber (anterior and inferior walls) and, four chamber (septal and lateral walls).
OPTIMAL FLUOROSCOPIC PROJECTIONS FOR CORONARY INTERVENTIONS
Optimal fluoroscopic projections during PCI should minimize parallax/foreshortening of the aorto-coronary ostia and coronary vessels in order to provide the operators with accurate information about the caliber and length of the evaluated vessel. In addition, vessel overlap should be minimized by “separating” the segment of interest from adjacent branches. Optimal viewing angle is often challenging to achieve, especially while assessing coronary ostia and bifurcations. Suboptimal viewing angles may lead to an increase in procedural time, contrast agent administration and radiation exposure from one hand and to non-favorable procedural results from the other.
PLANNING OF OPTIMAL WORKING ANGLES FOR CORONARY INTERVENTIONS: THE ROLE OF COMPUTED TOMOGRAPHY CORONARY ANGIOGRAPHY (CTCA)
Improvements in acquisition and reconstruction technology propelled the use of coronary computed tomography angiography (CCTA) as a first-line diagnostic tool for management of patients with suspected CAD. Less commonly recognized, is the concept of exploiting “au maximum” the 3D CTCA volume dataset to better inform the interventional cardiologist on “how to perform” the PCI. CCTA may allow for optimal selection of vascular access, fluoroscopic viewing angles, PCI strategy and adequate equipment, while preventing ICA-associated technical errors and potential sequelae (Figure 60). Importantly, CCTA has the potential to reduce patient contrast load, radiation exposure and procedure times, and has been demonstrated to be cost-effective when appropriately incorporated into clinical workflows. While further studies are in need to establish the role of CCTA as interventional tool, it is reasonable that in the near future CCTA will replace ICA not only in CAD diagnosis, but also in PCI guidance.
Figure 60
The multiple potential roles of CCTA in planning of coronary interventions. CCTA allow for optimal selection of vascular access, equipment selection, fluoroscopic viewing angles, PCI strategy, while reducing contrast agent volume, radiation exposure and PCI-associated technical errors and potential sequelae. CCTA: coronary computed tomography angiography.
Recommendations for the most appropriate fluoroscopic views for PCI are mostly empirical and lack an evidence-based approach 1. Di Mario C, Sutaria N. Coronary angiography in the angioplasty era: projections with a meaning. Heart. 2005 Jul;91(7):968–76. Link. Apart from CAD severity, CCTA offers crucial 3D anatomical information that can potentially dictate optimal working angles for interventions. This information might also guide selection of adequate equipment for intervention (e.g. guiding catheter shape, guidewire type and number, balloon/stent size and length, need for atherectomy), as well as optimal PCI strategy based on lesion characteristics (e.g. culprit artery localization, 1 vs. 2 stent bifurcation stenting, chronic total occlusions). The contribution of CCTA might be of particular importance while intervening in ostia of coronary arteries and proximal bifurcations considering the higher risk of geographic miss on this type of coronary lesion due to poor visualization of the stent landing zone. Eventually, though yet to be determined, CTCA may potentially improve the clinical outcomes of coronary interventions.
Planning of optimal working angles for coronary interventions by CCTA is based on the same principles learned from planning of structural heart interventions (e.g. TAVI, left atrial appendage closure). First, two perpendicular cross-sections of the evaluated coronary segment should be identified. Then, optimal projection curve of each one of the identified planes is generated by automated software. Finally, the intersection point between the two S-curves should provide the operator with a viewing angle that will minimize parallax/foreshortening of the vessel (Figure 61). For example, the coordinates of intersection between the optimal projection curves of the ostial LAD and the proximal LAD (~8mm distal to the ostium) should provide an optimal viewing angle for stenting of the ostial LAD. Likewise, for ostial LMCA stenting, the intersection between the optimal projection curves of the aortic annulus and of the ostial LMCA should provide an optimal viewing angle in which the aortic root is fully elongated and the LMCA appears in a perpendicular plane. Importantly, as previously mentioned the double S-curve between the left coronary ostium and aortic annulus isolates the left coronary cusp, while the double S-curve between the right coronary ostium and aortic annulus isolates the right coronary cusp. In other words, by isolating the left coronary cusp (i.e., 2 cusp non-right overlap view in LAO CRA) and right coronary cusp (i.e., 2 cusp non-left overlap view in steep LAO CRA), optimal viewing angles of the left main and right coronary ostia, respectively, can be obtained, thereby avoiding the need for double S-curve software programs. For coronary bifurcation stenting, optimal angles can be generated by creating a 3-point closed spline involving (a) the proximal main branch, (b) the distal main branch and (c) the side branch and subsequently calculating the en-face fluoroscopic viewing angle of that spline (Figure 62). The en-face viewing angle of this plane provides optimal assessment of the bifurcation geometry. Figure 63 describes the average optimal viewing angles for stenting of coronary ostia (LMCA and RCA) and, bifurcations based on a retrospective analysis of 100 consecutive patients who underwent CTCA for suspected CAD 16. Pighi M, Thériault-Lauzier P, Piazza N. Multimodality imaging for interventional cardiologists. EuroIntervention J Eur Collab with Work Gr Interv Cardiol Eur Soc Cardiol. 2018 Aug;14(AB):AB33–9 Link.
Figure 61
Analysis of optimal fluoroscopic viewing angles for ostial and proximal left main stenting. Ostium of the left main is identified in two orthogonal planes (A; turquoise closed spline). A centerline (green line) of the left main is created to identify the perpendicular plane of the proximal left main at 8 mm from the ostium (B). Optimal projection curves are then developed for the aortic annulus (yellow curve) and the ostial and proximal left main (turquoise and orange curves, respectively) (C). The fluoroscopic viewing angle obtained by the intersection between the aortic annulus and ostial left main optimal projection curves (D) mitigates parallax of the aortic root and allows a clear identification of the ostial left main. The fluoroscopic viewing angle obtained by the intersection between the ostial and proximal left main optimal projection curves (E) mitigates parallax of the proximal left main.
Analysis of optimal fluoroscopic viewing angles of bifurcating coronary arteries. A centerline is created in the LAD artery at least 5 mm proximally and distally from the diagonal branch take-off. Curved multiplanar reconstruction is used to create a center line and identify the bifurcation (inlet). The plane or en-face view of the bifurcation is created by placing 3 dots in the proximal main vessel, distal main vessel, and diagonal branch at 5 mm distance from the polygon of confluence. The en-face view of the plane provides the optimal fluoroscopic projection for analyzing bifurcation lesions.
Optimal fluoroscopic projections of coronary ostia and bifurcations defined by CCTA. Shown are optimal viewing angles for PCI of the right and left coronary ostia, as well as coronary bifurcations based on a retrospective analysis of 100 consecutive patients who underwent CTCA for suspected CAD.
As the frequency of use of diagnostic CTCA increases in the near future, it has the potential to provide additional information for planning and guiding PCI procedures based on 3D tomographic dataset.
Personal Perspective
From authors
Historically, knowledge about fluoroscopic anatomy was acquired through anecdotal experience. Sub optimal fluoroscopic viewing angles are often underappreciated and can lead to significant foreshortening and parallax of cardiac structures with adverse effects on the evaluation and/or percutaneous intervention. Furthermore, classic teaching in interventional cardiology has been based on pattern recognition. With the introduction of multislice computed tomography for structural heart interventions, the idea of patient specific viewing angles has gained widespread acceptance. The current chapter provides a foundational approach to mastering fluoroscopic anatomy for both transcatheter structural and coronary interventions. This approach relies on the concepts of chamber views, that can be obtained in various fluoroscopic quadrants, and optimal projection curves that allow us to understand the en-face or planar view of a given structure. Combining fluoroscopic chamber views and optimal projection curves, we can better understand the location and relative position of cardiac structures. While we progress towards a mastering of fluoroscopic anatomy, we will inevitably eliminate the need to base our teaching solely on pattern recognition. Behind each catheter injection, lies a chamber view.